Project 1 - Parsing NASA thermodynamic data
- Objective:
1)Write the function that extracts the 14 coefficients and calculates the enthaply, entropy and specific heat for all the species in the data file
Calculate the molecular weight of each species and display it in the command window
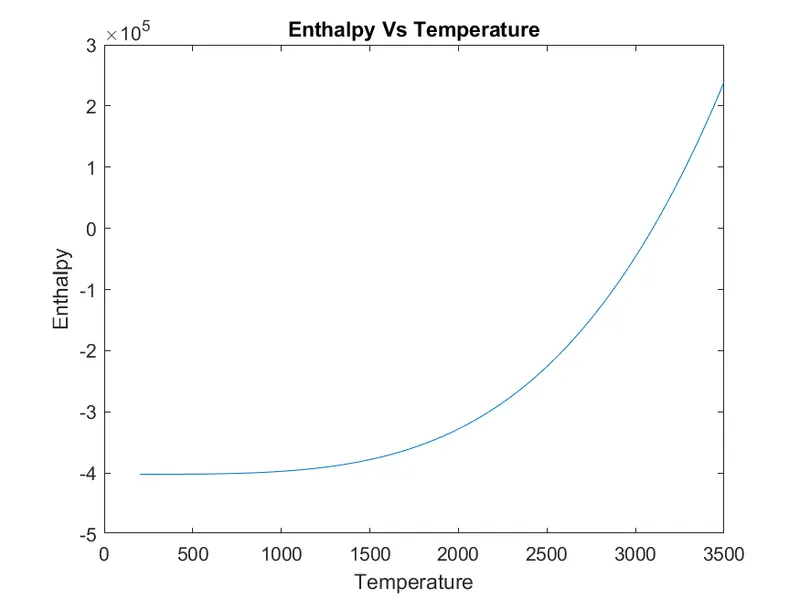
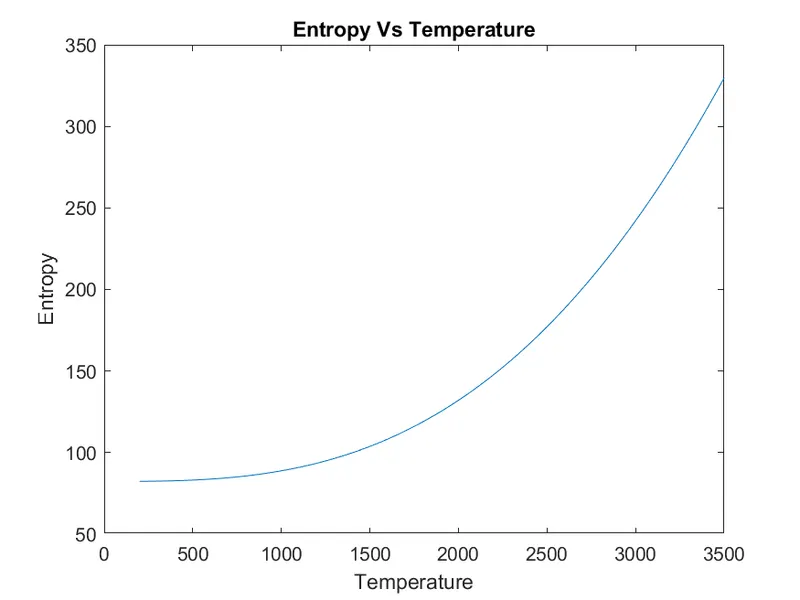
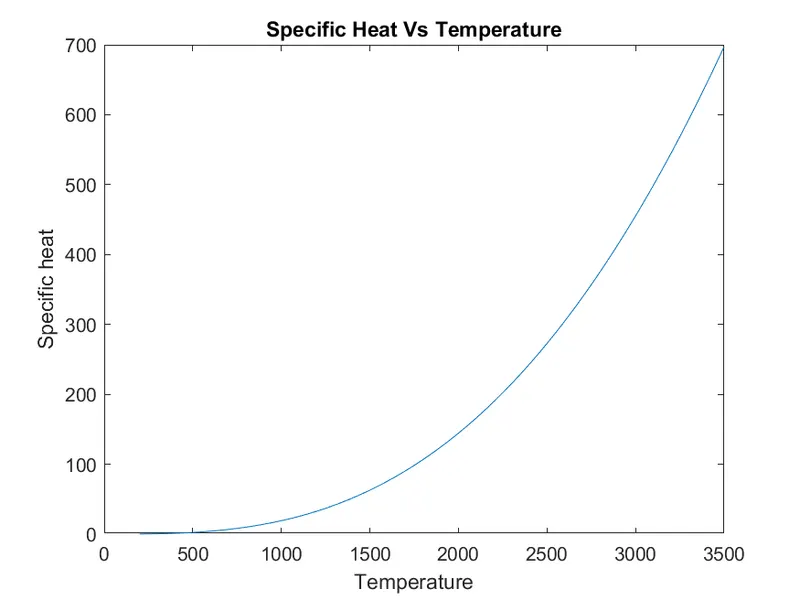
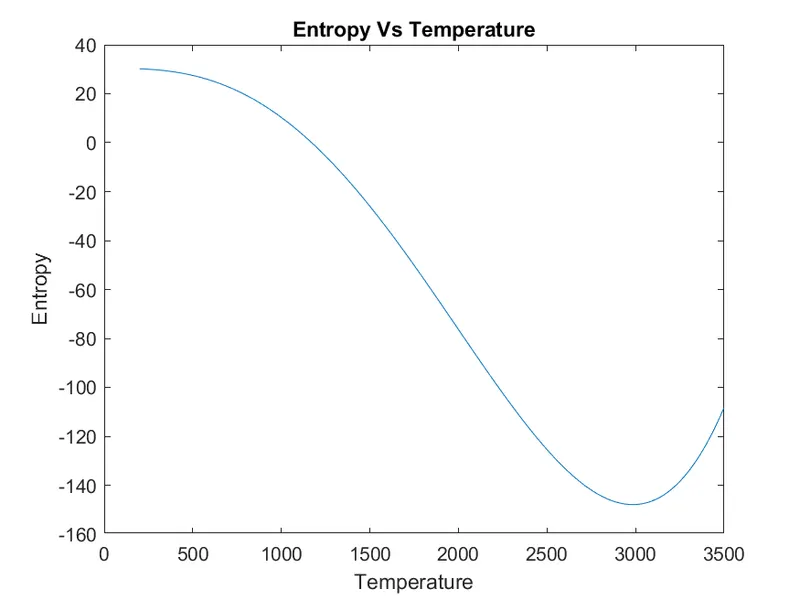
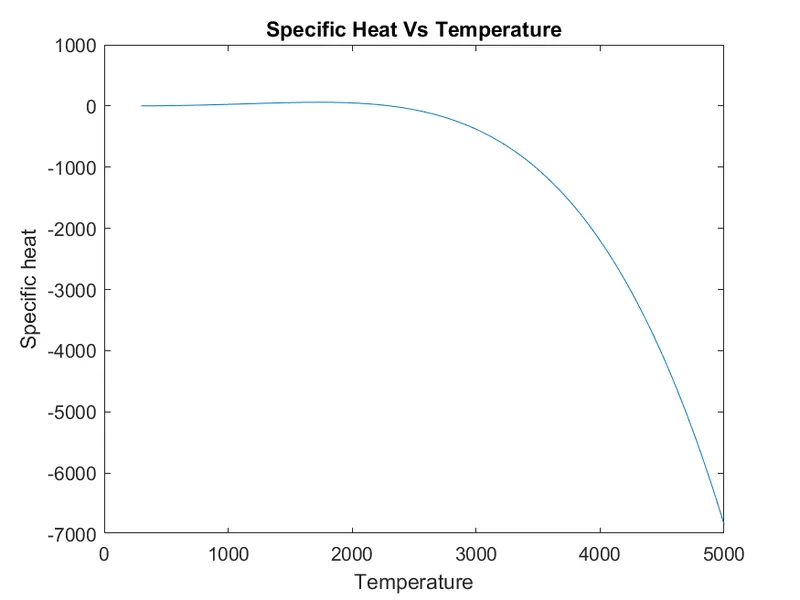
2)Plot the Cp, Enthaply and entropy for local temperature range(low temperature :high temperature) specific for each species
3)Save the plots as images with appropriate names and dump them in separate folder for each species with suitable name. All these should
be generated automatically - Procedure:
In this project, We will be reading NASA thermodynamics data and the calculate the thermodynamics properties such as Specific heat,
enthaply, entropy and molecular weight of various species and plot the respective graph. The required data is stored in the file named
THERMO.dat' and data is used for the project. Using formula used for calculating the value Cp, Enthaply and entropy - STEPS FOR CODE
• Intially, Open the file THERMO.dat while using fopen command
• fgetl command is used to to read the first line of the data file, after fscan is used used for to read global low, mid and high temp values are
used
strfind command is used to find the position of 'E' and in line to seperate coefficient
• New directory is made using mkdir command to create a folder with the species name
To calculate Entropy, Enthalpy and specific Heat functions are defined
• after then graph has been plotted T vs Cp, TVs H, T vs S -
clear all
close all
clc
R = 8.314;
R1 = fopen('THERMO.dat','r');
fgetl(R1)
temp_range = fgetl(R1);
A=strsplit (temp_range,' ');
Global_min_temp = (A{2});
Global_min_temp =str2num(Global_min_temp);
Global_mid_temp = (A{3});
Global_mid_temp =str2num(Global_mid_temp);
Global_max_temp = (A{4});
Global_max_temp =str2num(Global_max_temp);fgetl(R1)
fgetl(R1)
fgetl(R1)
for i = 1:53
Spe=fgetl(R1);
M = strsplit(Spe,' ' );
element = M{1};
low_temp= (M{end-3});
low_temp=str2num(low_temp);
mid_temp = (M{end-1});
mid_temp=str2num(mid_temp);
max_temp = (M{end-2});
max_temp =str2num(max_temp);L1 = fgetl(R1);
p1 =findstr(L1,'E');i1 = L1(1:p1(1)+3);
i1 =str2num(i1);i2 = L1(p1(1)+4:p1(2)+3);
i2 =str2num(i2);i3 = L1(p1(2)+4:p1(3)+3);
i3 =str2num(i3);i4 = L1(p1(3)+4:p1(4)+3);
i4 =str2num(i4);i5 = L1(p1(4)+4:p1(5)+3);
i5 =str2num(i5);L2=fgetl(R1);
p2 =findstr(L2,'E');i6 = L1(1:p2(1)+3);
i6 =str2num(i6);i7 = L1(p2(1)+4:p2(2)+3);
i7 =str2num(i7);i8 = L1(p2(2)+4:p2(3)+3);
i8 =str2num(i8);i9 = L1(p2(3)+4:p2(4)+3);
i9 =str2num(i9);i10 = L1(p2(4)+4:p2(5)+3);
i10 =str2num(i10);L3 = fgetl(R1);
p3 =findstr(L3,'E');i11 = L3(1:p3(1)+3);
i11 =str2num(i11);i12 = L3(p3(1)+4:p3(2)+3);
i12 =str2num(i12);i13 = L3(p3(2)+4:p3(3)+3);
i13 =str2num(i13);i14 = L3(p3(3)+4:p3(4)+3);
i14 =str2num(i14);
T = linspace(low_temp,max_temp,500);
if T >= mid_temp
Cp = (i1+i2.*T+i3.*T.^2+i4.*T.^3+i5.*T.^4)*R;
H = (i1+i2.*T./2+i3.*(T.^2)./3+i4.*(T.^3)./4+i5.*(T.^4)./5+i6./T)*R.*T;
S = (i1.*log(T)+i2.*T+i3.*(T.^2)./2+i4.*(T.^3)./3+i5.*(T.^4)./4+i7)*R;
else
Cp = (i8+i9.*T+i10.*T.^2+i11.*T.^3+i12.*T.^4)*R;
H = (i8+i9.*T./2+i10.*(T.^2)./3+i11.*(T.^3)./4+i12.*(T.^4)./5+i13./T)*R.*T;
S = (i8.*log(T)+i9.*T+i10.*(T.^2)./2+i11.*(T.^3)./3+i12.*(T.^4)./4+i14)*R;
end
mkdir('C:\Users\athar\OneDrive\Desktop\file parsing',element);
cd(element)
figure(1)
plot(T,Cp)
xlabel ('Temperature');
ylabel ('Specific heat');
title('Specific Heat Vs Temperature');figure(2)
plot(T,H)
xlabel ('Temperature') ;
ylabel ('Enthalpy') ;
title ('Enthalpy Vs Temperature')
figure(3)
plot(T,S)
xlabel ('Temperature') ;
ylabel ('Entropy');
title('Entropy Vs Temperature')
saveas (figure(1), 'Specific_heat.png')
saveas (figure(2), ' Enthaply.png')
saveas (figure(3), ' Entropy.png')
cd('C:\Users\athar\OneDrive\Desktop\file parsing');
atoms = ['H','C','N','O','A'];
atomic_weight = [1,12,14,16,40];
MW = 0;
for p = 1:length(element)
for q = 1:length(atoms)
if strcmp (element(p),atoms(q))
MW = MW+atomic_weight(q);
u = q;
end
end
k = str2num(element(p));
if k>1
MW = MW+atomic_weight(u)*(k-1);
end
end
sprintf('%s species %s %f',element,'molecular mass',MW)
end
fclose(R1); - sc of folder

- plot of O2
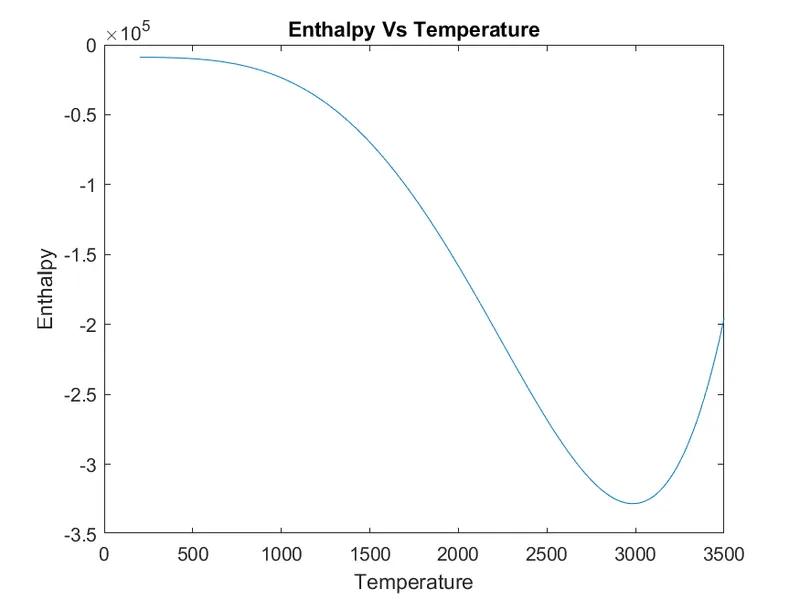
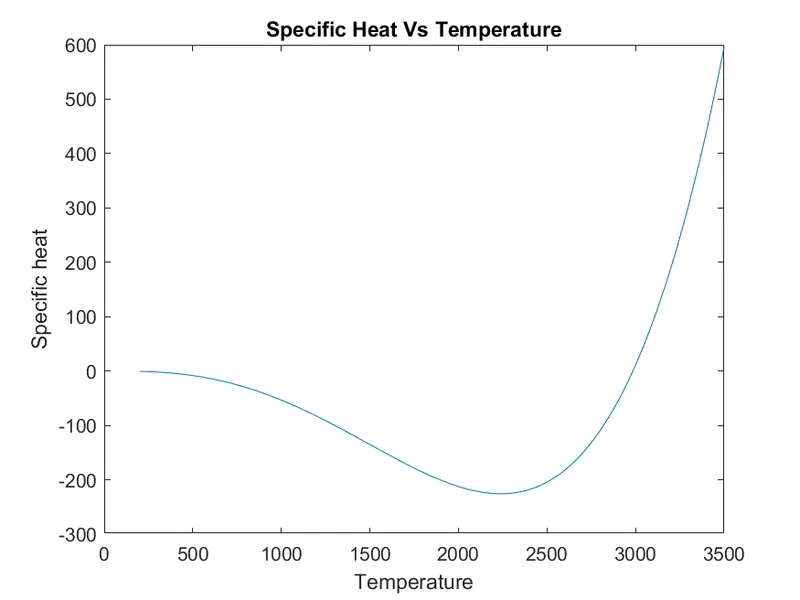
- N2
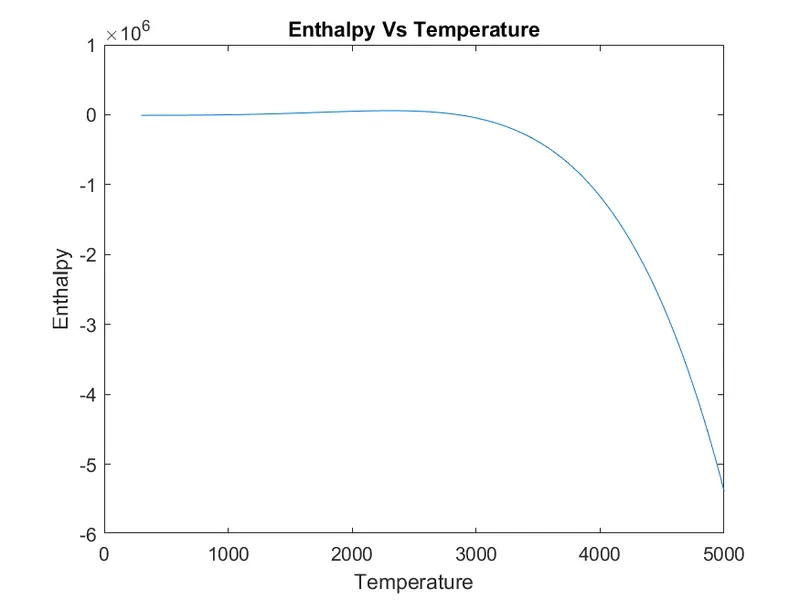
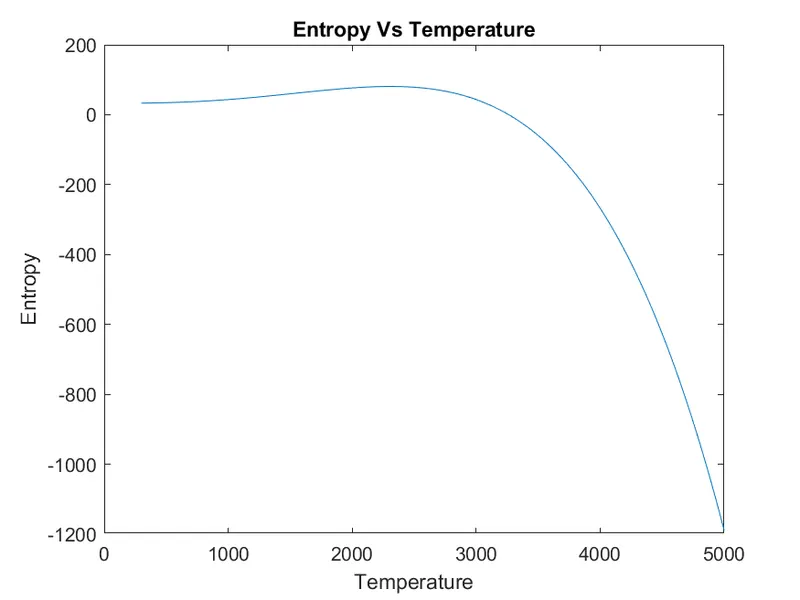
- CO2