Week 5 Battery characteristics using drive cycle
simulating generic battery model charge discharge using UDDS data:
1)UDDS Data:Urban dynamometer driving schedule(UDDS):
The cycle simulates a urban route of 7.5 miles (12.07 km) with frequent stops. The maximum speed is 56.7 mph (91.25 km/h) and the average speed is 19.6 mph (31.5 km/h).The cycle runs for 1369seconds.
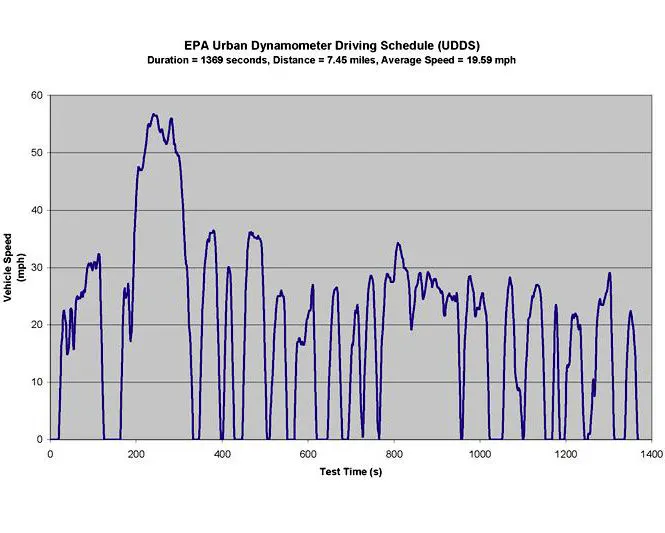
This drive cycle shows the actual behaviour of an moving car.
1.let us simulate the charge discharge characteristics of an battery for this UDDS cycle
2.The simulation model is
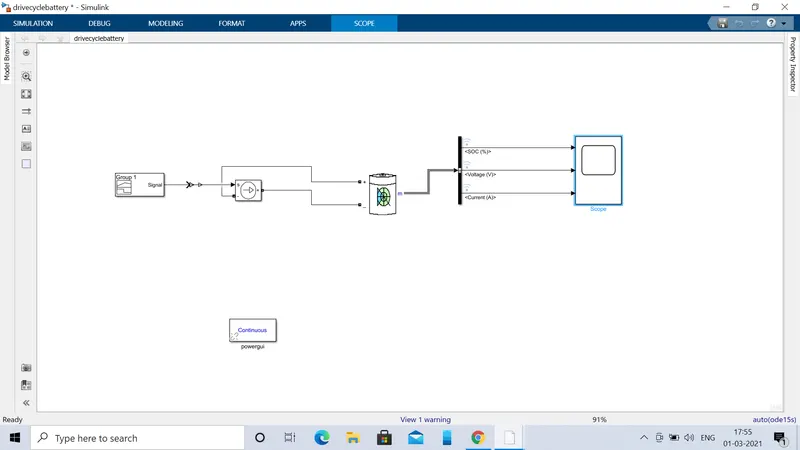
3.The simulated blocks that we used are
a)signal builder
b)controlled current source
c)battery
d)bus selector
e)scope
f)powerGUI
a)signal builder:
1.The Signal Builder block helps to create interchangeable groups of piecewise linear signal sources and use them in a model. You can quickly switch the signal groups into and out of a model to facilitate testing.
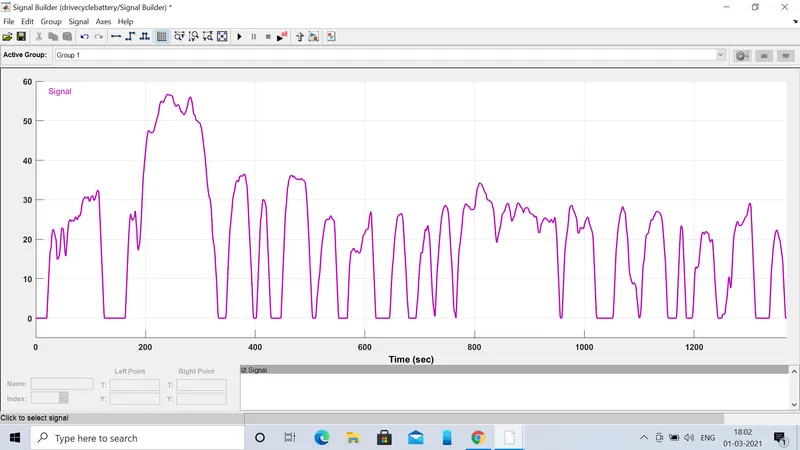
2.In the signal builder block the udds is imported and generated the signal to use for the simulation.The generated signal is
b)Controlled current source:
The Controlled Current Source block converts the input signal into an equivalent current source. The generated current is driven by the input signal of the block. The positive current direction is as shown by the arrow in the block icon.
c) generic battery:
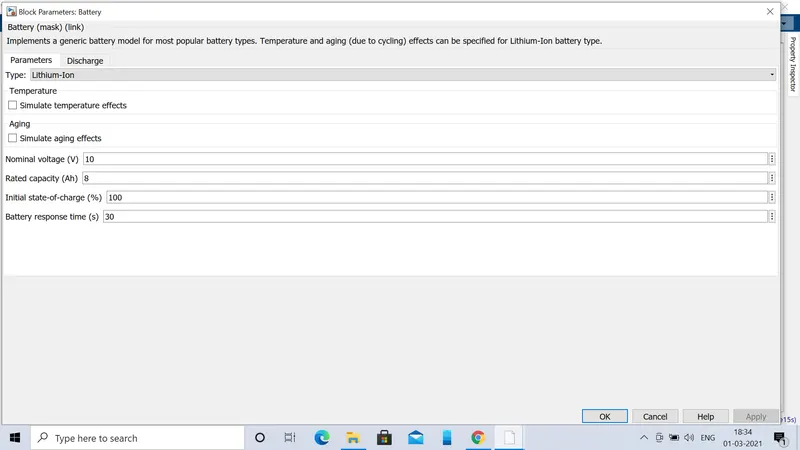
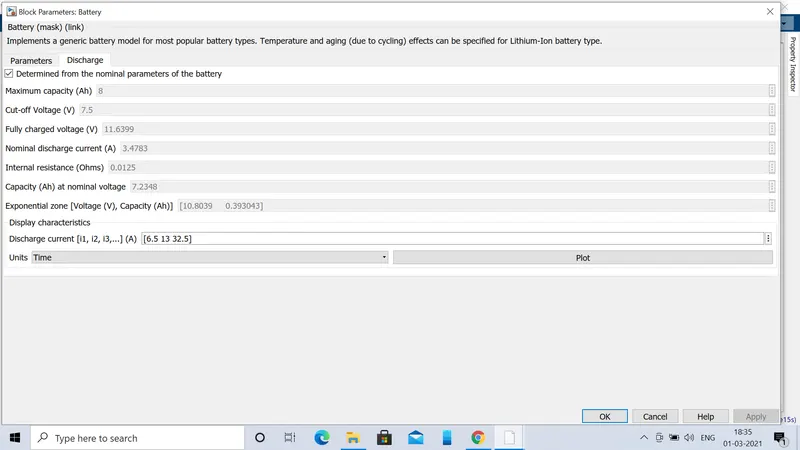
This battery is used to specify the required battery specifications with temperature and ageing effects.
The specified parameters are
BUS selector:
The Bus Selector block outputs the signals you select from the input bus. The block can output the selected elements separately or in a new virtual bus.
Scope:
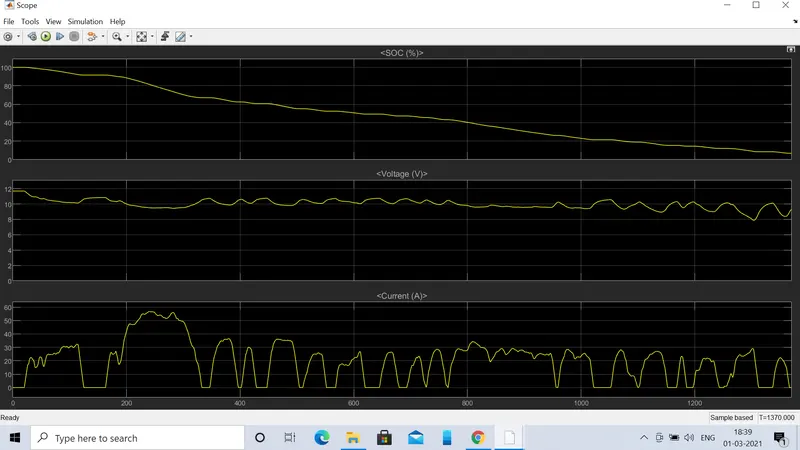
The scope is used to display the signals with time domain.
The displayed results of state of charge(soc),voltage,current are
PowerGUI:
It is used to slove the circuit by using different methods
observations:
state of charge:
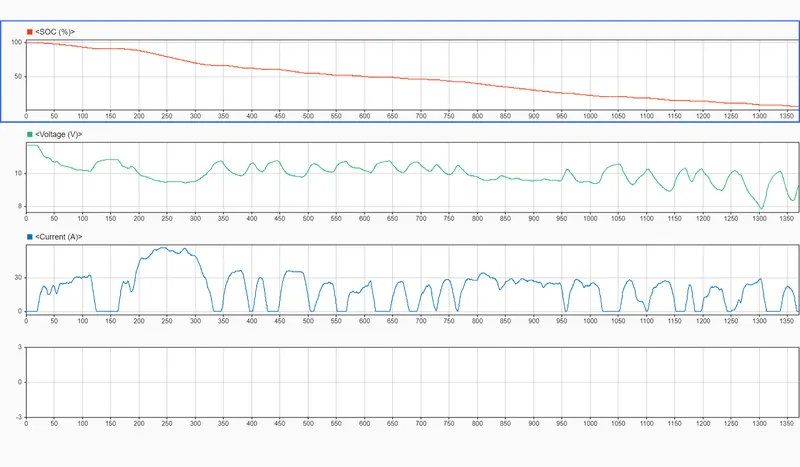
1.The state of charge comes from 100% to 20% by the end of the drive cycle.
2.There is a small ups and downs in the soc curve the up in the curve represends the charging and the down represents the dischrage of the battery inthe drive cycle the discharge is more when the compared with the charging.
3.At some points the soc curve is linearly decreasing that these points there is a constant discharge of the current.
voltage:
1.As the speed is increasing the voltage is decreasing and the current drawn from the battery is increasing
2.The decrease in the voltage of the battery represents the increase in the speed of the vehicle from the drive cycle.and the increase in the voltage represents the charge of the battery that is the vehicle is retarding and the motor is generating the power to the battery.
current:
1.As the speed increse the current drawn from the battery increases and and it follows the speed curve of the vehicle.
2.As the current increses the voltage decreases that means the power decreases in the battery and it is discharging and when the current decreases the the voltage increases and the power increases that means the battery is charging .