Week 5 Battery characteristics using drive cycle
AIM:
To simulate generic battery model charge discharge using UDDS data.
DESCRIPTION:
Generic Battery block used in matlab:
This the battery model used with the following parameters.
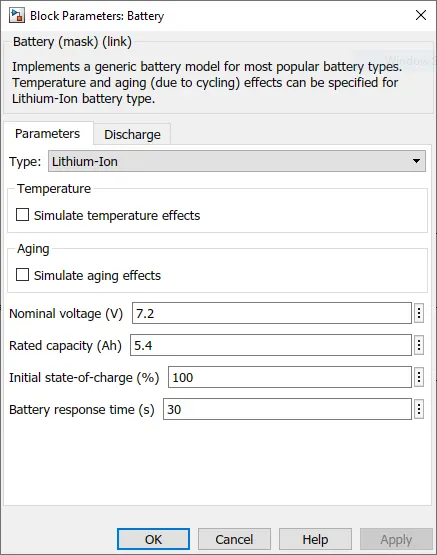
Matlab model:
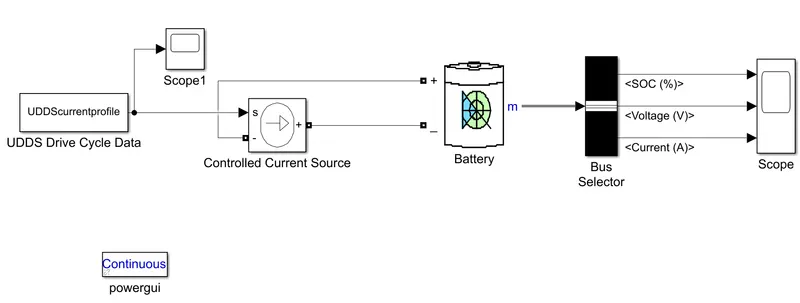
Blocks used here:
- Form workspace
- Scope1
- Controlled current source
- Battery
- Bus selector
- Scope
From Workspace:
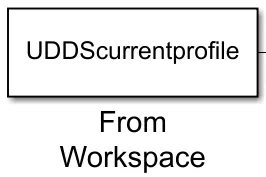
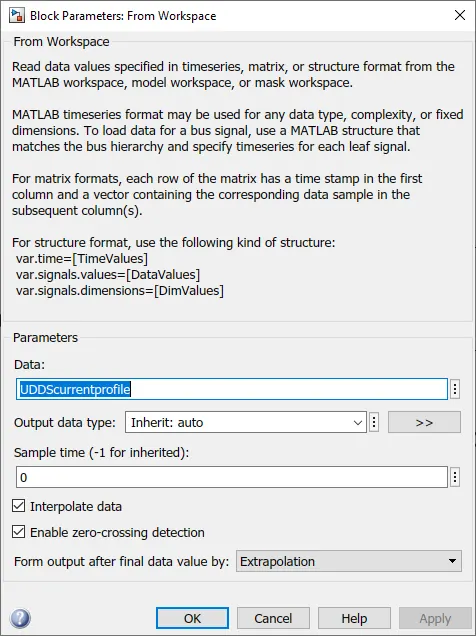
This block is used to get the UDDS Drive cycle data file from the workspace which is imported in a matlab script file as numeric data.
2. Controlled current source:
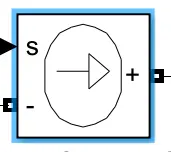
The Controlled Current Source block converts the Simulink input signal into an equivalent current source. The generated current is driven by the input signal of the block. The positive current direction is as shown by the arrow in the block icon. You can initialize the Controlled Current Source block with a specific AC or DC current. If you want to start the simulation in steady state, the block input must be connected to a signal starting as a sinusoidal or DC waveform corresponding to the initial values.
The drive cycle data is given as input to the controled current source. The positive terminal of this controlled current source is connected to the negative terminal of the generic battery and the negative terminal of the cuurent source is connected to the positive terminal of the generic battery block.
3. Bus Selector:
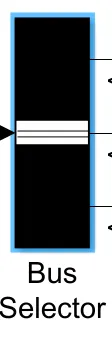
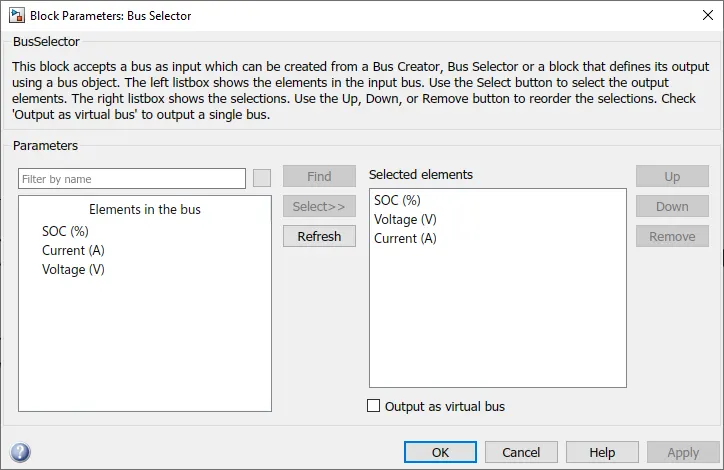
The Bus Selector block outputs the elements you select from the input bus. The block can output the selected elements separately or in a new virtual bus. Here we are asssigning the output parameters which are to be exported. Here all the parameters such as SOC, Volatge, Current are let out.
Time limit:
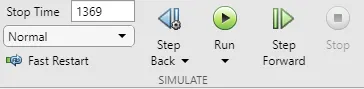
Here the time limit is set upto 1369seconds based on the drive cycle data.
Graphs:
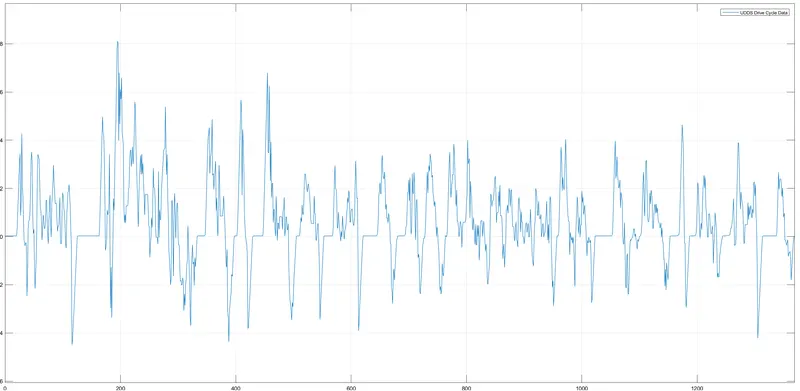
This is plot of the drive cycle data which is imported from the workspace.
Output plots:
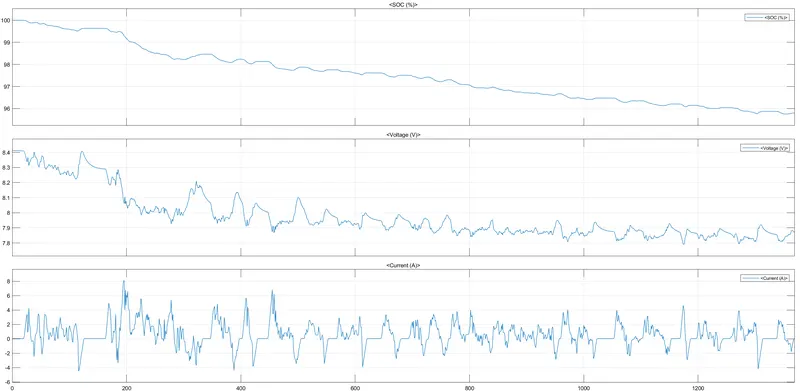
Here the first graph explains the SOC of the battery in %. It clearly tells that the SOC curve is travelling downwards indicating the draining of the battery. We have state that the battery charge comes down to 95.8% from fully charged state 100%. SOc curve moves towards up indicating the charging mode. And the second curve states the voltage relationship with the time in seconds. And the third curve states the current vs time plot, which is totally based on the drive cycle data imported and the negative cuurent indicating th charging state of the battery and the positive charge states the discharging state of the battery.
GOOGLE DRIVE LINK : https://drive.google.com/file/d/1rFqH6HIiD-taqckR6slGJf5rnabVYveW/view
UDDS Drive cycle data: https://drive.google.com/file/d/11B_lu9lWQ-FH_-lPO_x9hWaHKU_KP3C6/view?ts=5ff7eb50
CONCLUSION:
A Generic battery model charge discharge using UDDS data is simulated and the plots are expalined.