Week 5 Battery characteristics using drive cycle
Introduction to Battery Technology for Electric Vehicles using MATLAB & Simulink
Week 5 Battery characteristics using drive cycle
Q.Simulate generic battery model charge discharge using UDDS data.
Ans=>
UDDS:
The EPA (United States Environment Protection Agency) mandated "Uraban Dynamometer Driving Schedule"(UDDS) test on fuel economy that is commonly called "LA4"or "the city test" and represent city driving condition.It is used for light duty vehicle testing.
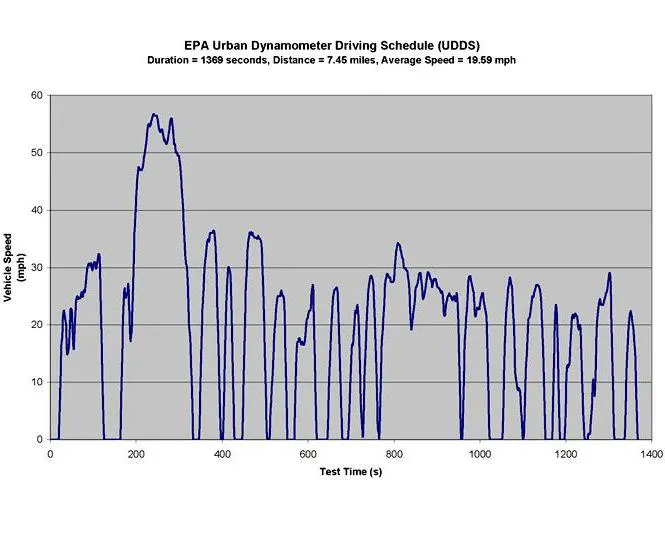
Now we are using this drive cycle to simulate the battery model in simulink for study charge discharge characteristics.
But first we need to convert this UDDS data of mph to current profile so that we can see how battery responds to this data and ultimately we can predict the how far battery last i.e SOC and charge discharge profile.
Its equivalent current profile of UDDS= Current Vs Time as follows:
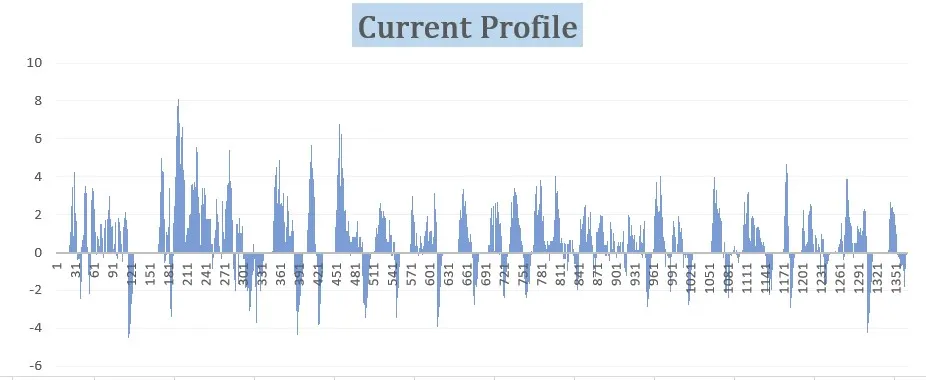
Now its ready our data to feed in simulink model & configure battery model to see how it performs with drive cycle input.
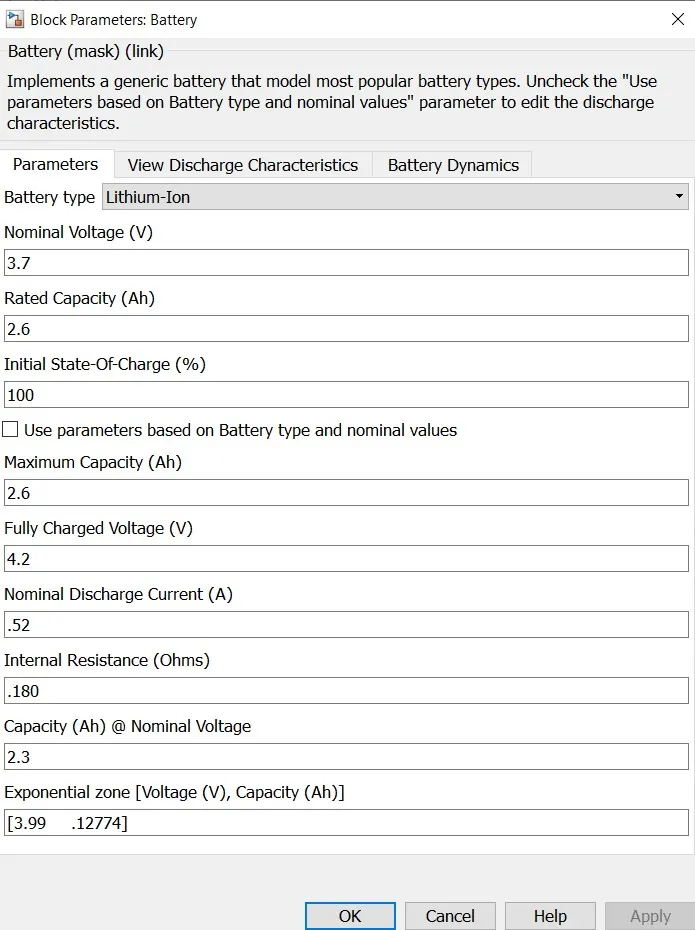
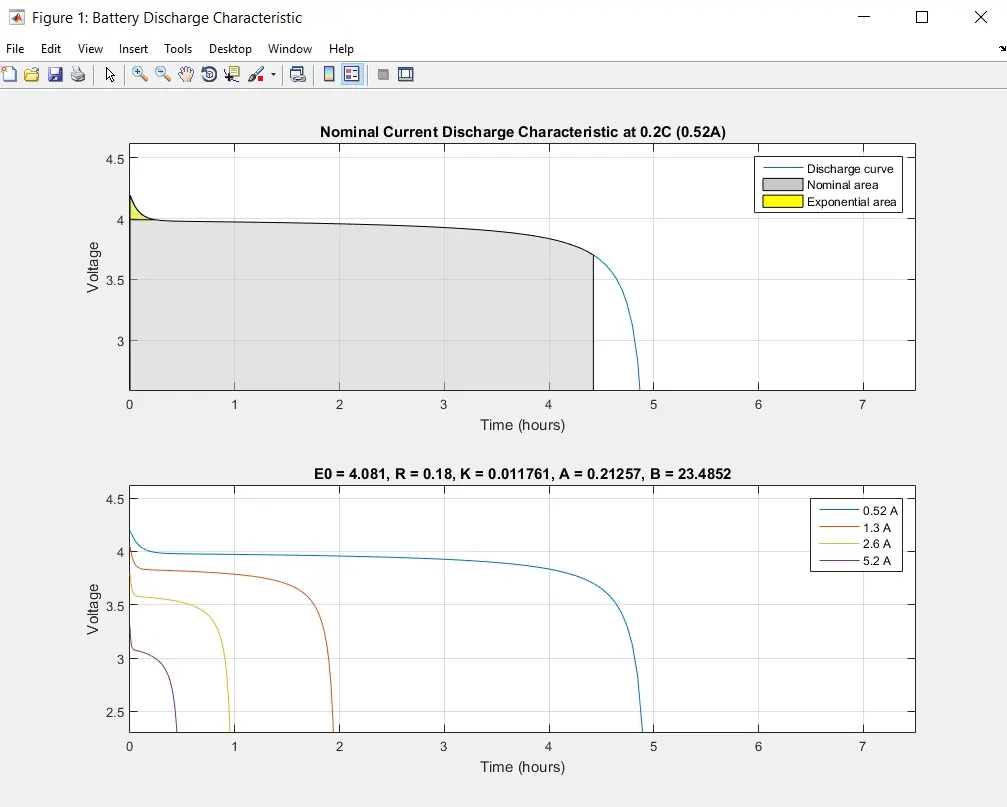
So here we used Lithium Ion Rechargeable Cell type LIR 18650-2600mAh to simulate the generic battery model by using UDDS data in MATLAB SIMULINK.
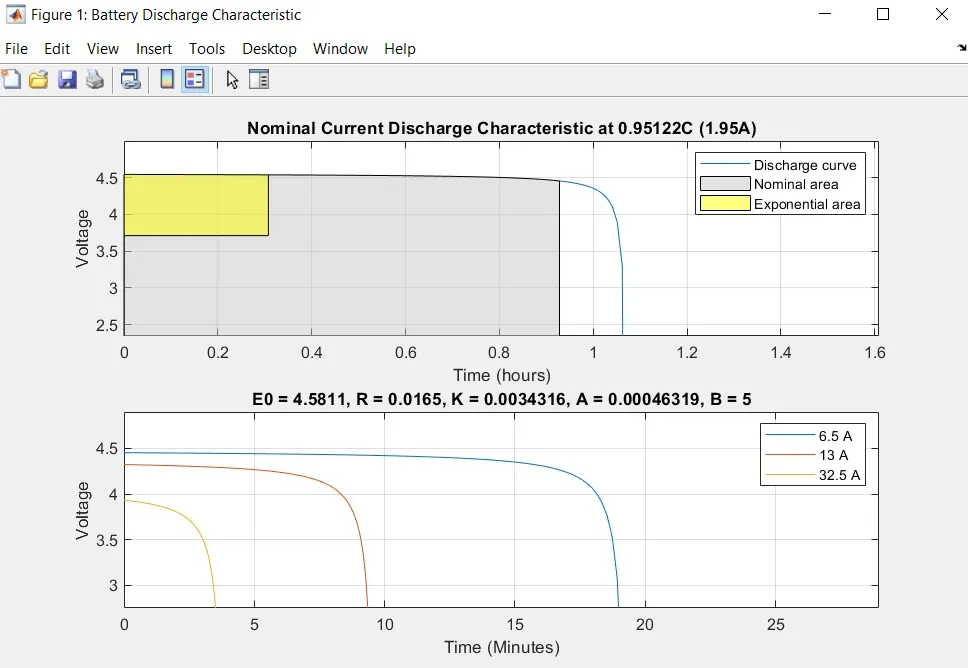
The detail specification to configure the Lithium battery is as given below:
The plot generated for above parameters are as follow:
Model Setup:
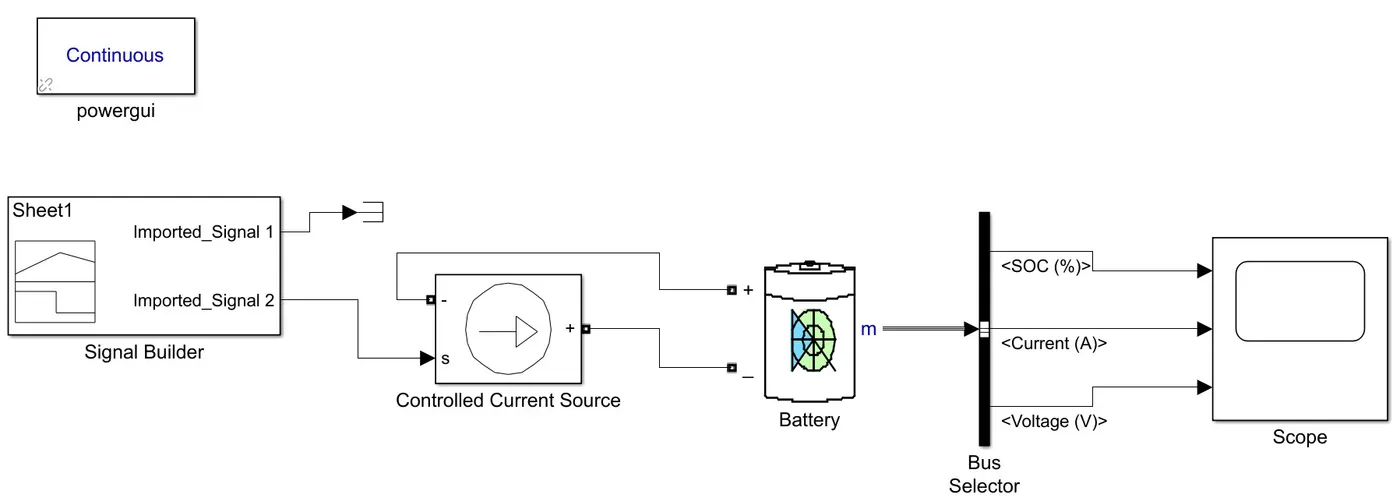
Block used:
1. Signal Builder-
The Signal Builder block allows you to create interchangeable groups of piecewise linear signal sources and use them in a model. You can quikly switch the signal groups into and out of a model to facilitate testing. In Signal Builder window, create signals and define the output waveforms.
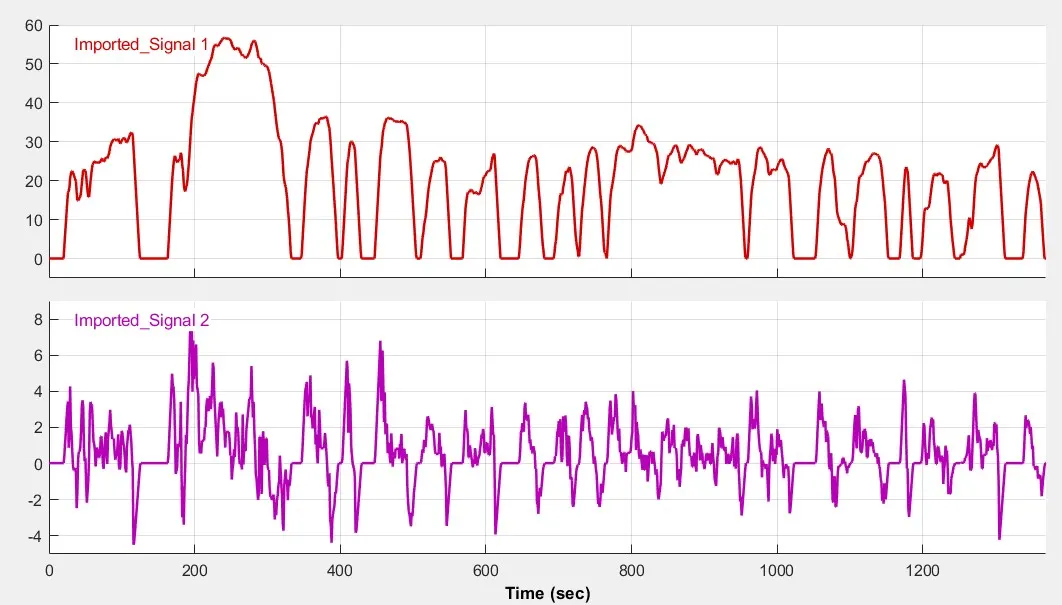
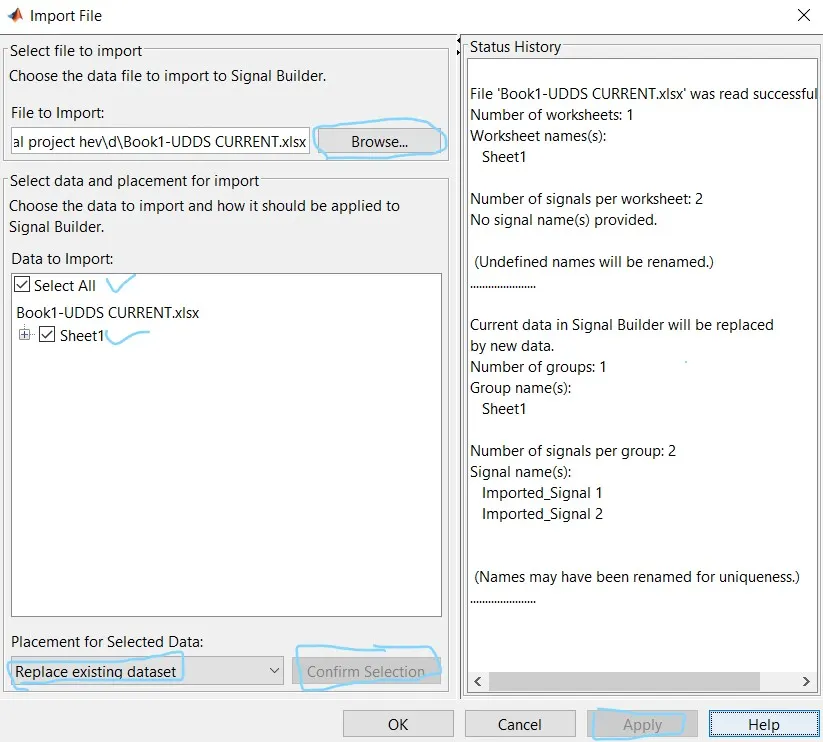
from these two imported signals to Signal Builder we terminate Signal 1 and connect Signal 2 to Controlled Current Source source port.
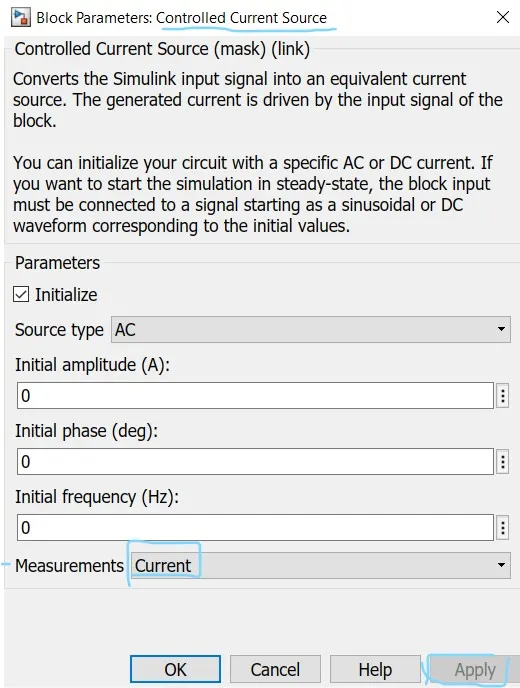
2. Controlled Current Source-
The Controlled Current Source block converts the Simulink input signal into an equivalent current source. The generated current is driven by the input signal of the block. The positive current direction is as shown by the arrow in the block icon.
You can initialize the Controlled Current Source block with a specific AC or DC current. If we want to start the simulation in steady-state, the block input must be connected to a signal starting as a sinusoidal or DC waveform corresponding to the initial values.
Double click controlled current source and from the drop-down menu of measurement select current.The signal output will connect with a scope by adding the current signal to it.(+) the terminal will connect with the battery (-) terminal.
3. Battery
The Battery block implements a generic dynamic model that represents the most popular types of rechargeable batteries.
4. BUS Selector
The Bus Selector block outputs the signals you select from the input bus. The block can output the selected elements seperately or in a new virtual bus.
So from input of battery select SOC%, Current & Voltage to output scope.
5. PowerGUI
The powergui block allows you to choose one of these methods to solve your circuit:
Continuous, which uses a variable-step solver from Simulink®
Discretization of the electrical system for a solution at fixed time steps
Continuous or discrete phasor solution
The powergui block also opens tools for steady-state and simulation results analysis and for advanced parameter design.
You need the powergui block to simulate any Simulink model containing Simscape™ Electrical™ Specialized Power Systems blocks. It stores the equivalent Simulink circuit that represents the state-space equations of the model.
6. Scope
Display signals generated during simulation.
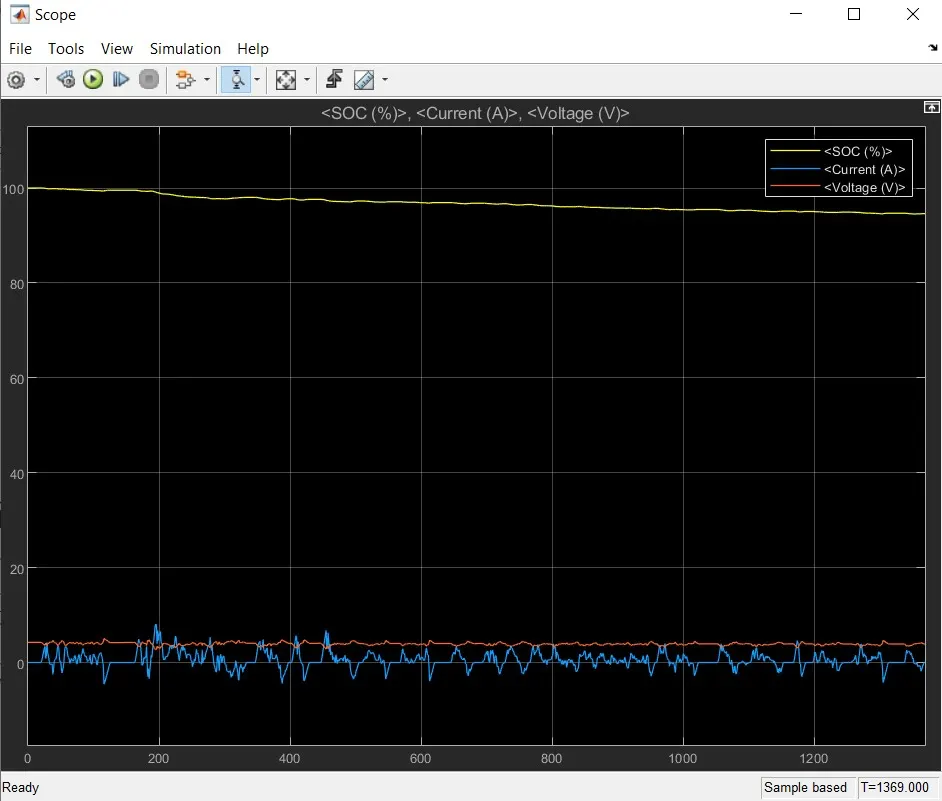
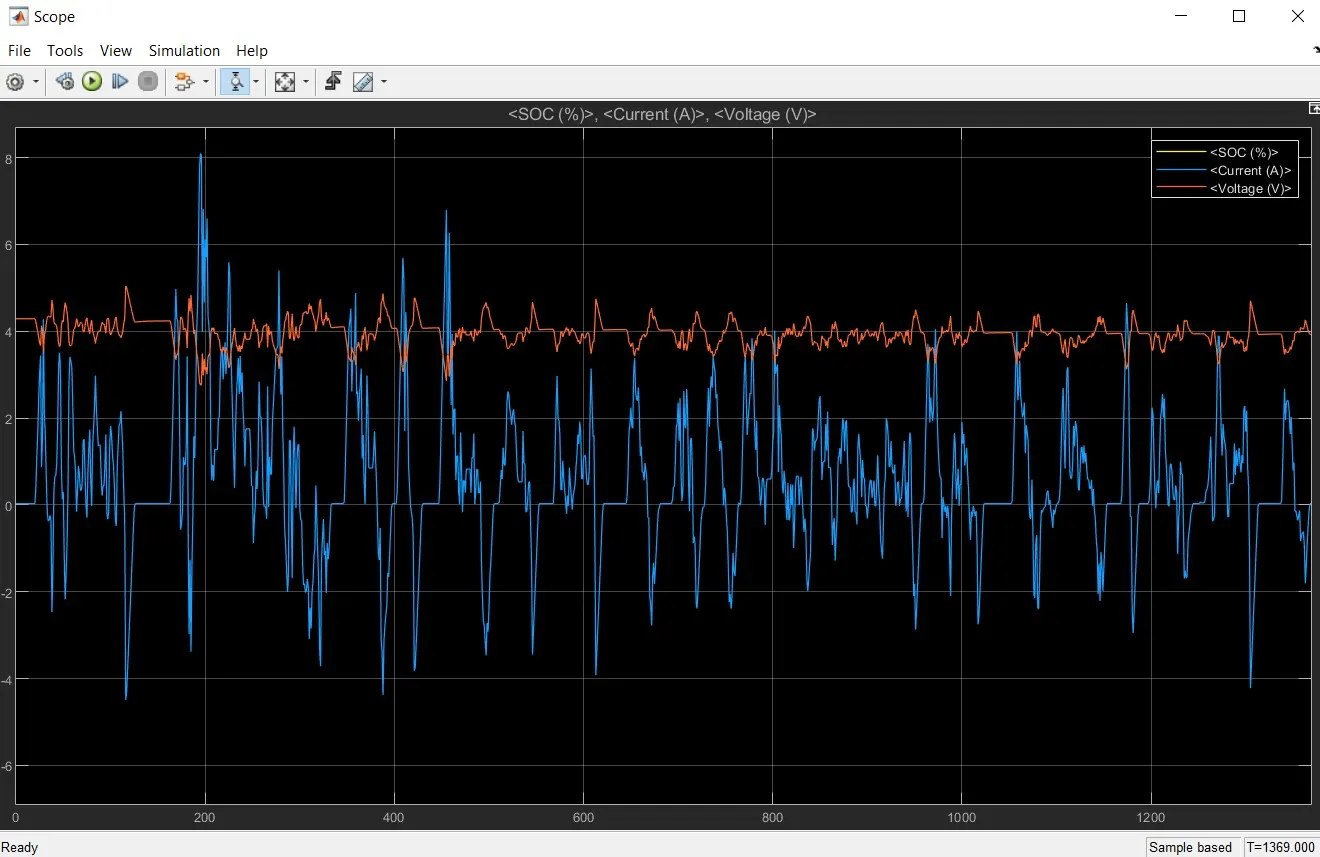
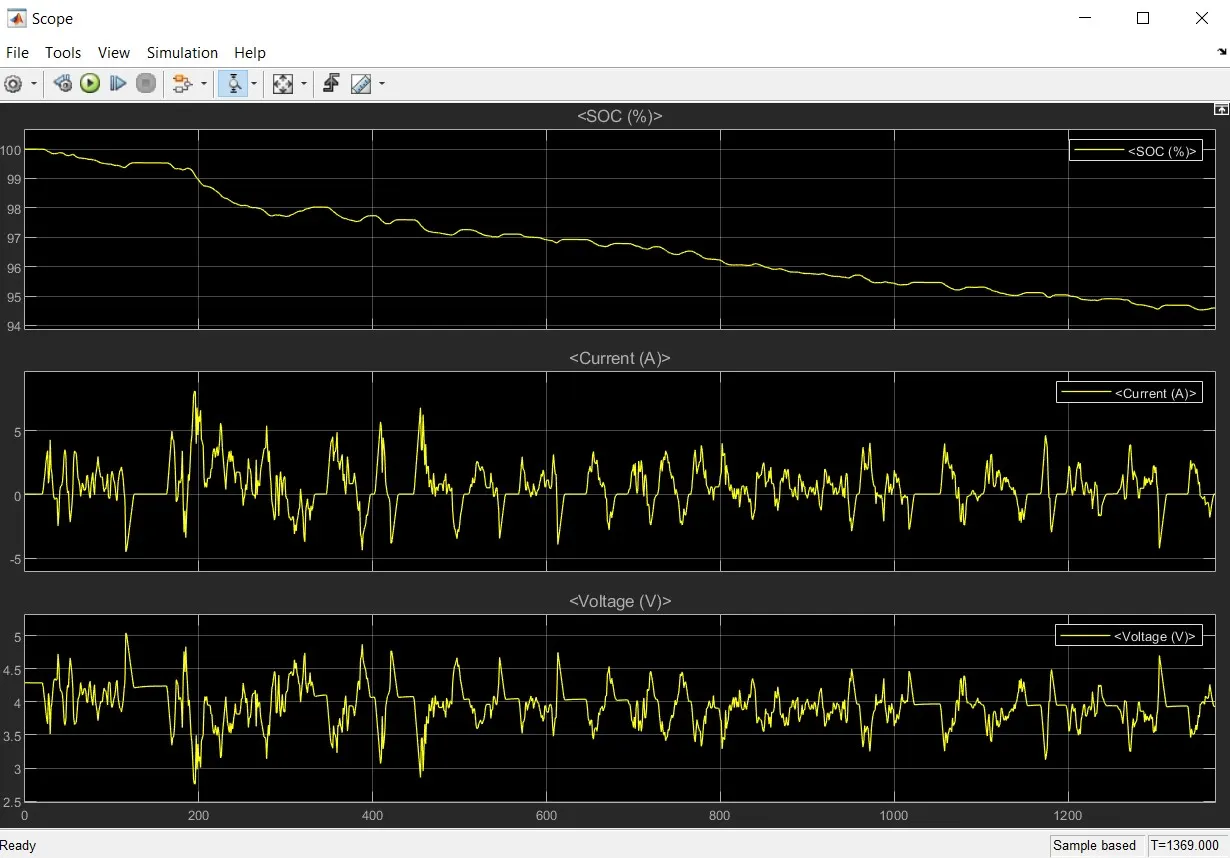
From above generic battery model charge discharge using UDDS data.It can be observed that after complete drive cycle the battery is discharged from a 100% charge state to around 94.5% charge state.
Also, it can be observed that when current profile goes in below zero value i.e negative current(-) actually used to increase the SOC level of battery during period of decceleration or braking of drive cycle.Thus battery gets charge during that moment.
Here Current value varies between -4A to +8A .
And Voltage varies between 5V to 3V.
And further we can study the temperature effect on battery by enable that block of temperature effect in battery model as follows:
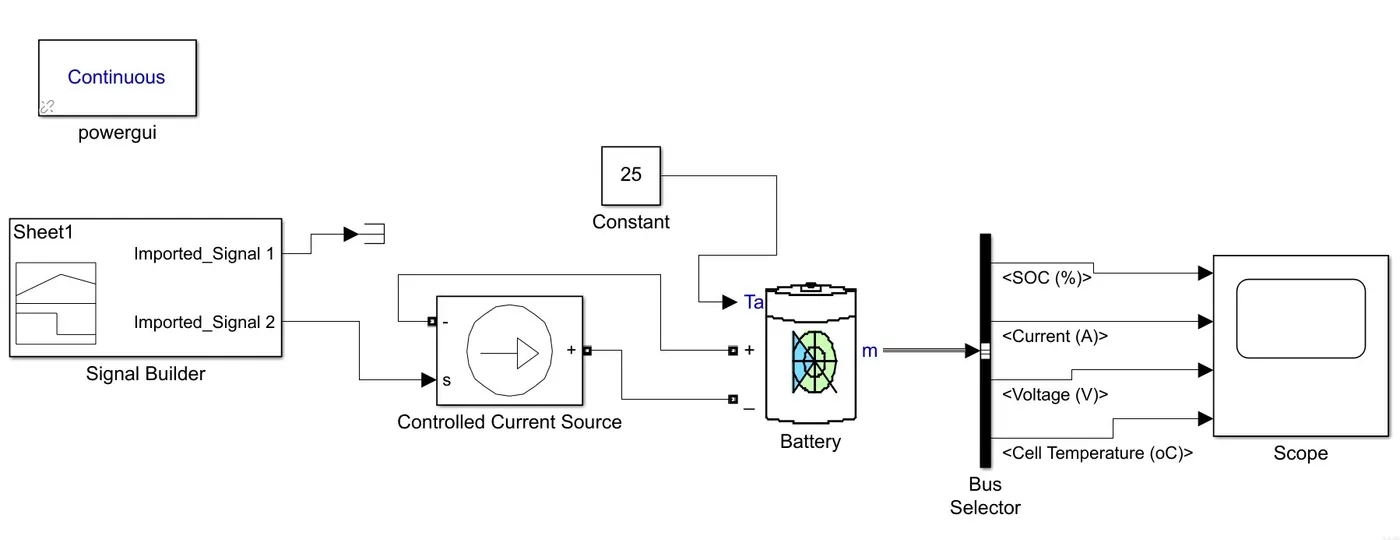
In above model we just add ambient tenperature constant block of 25 degree celcius and see Cell temperature effect .And new Battery parameter are set rest all as same above model.
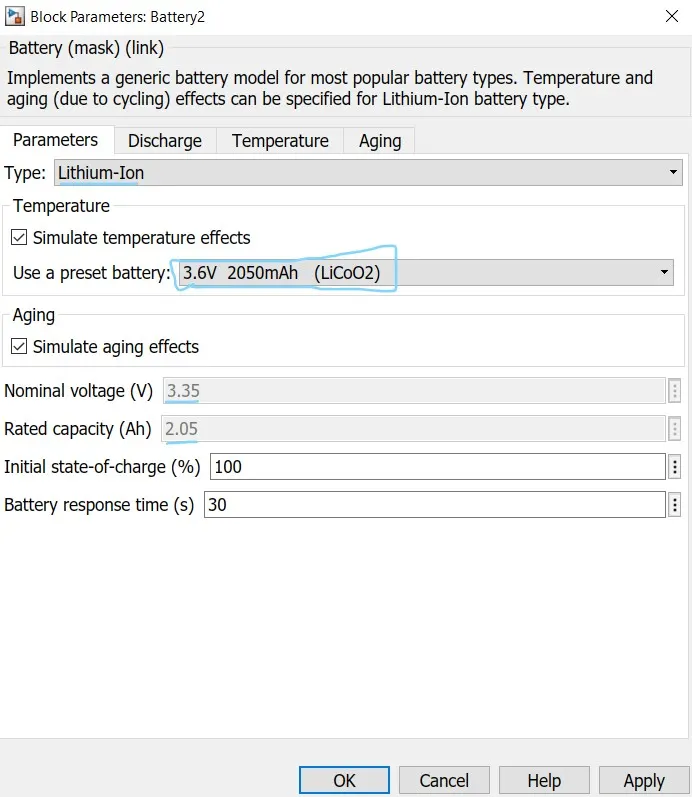
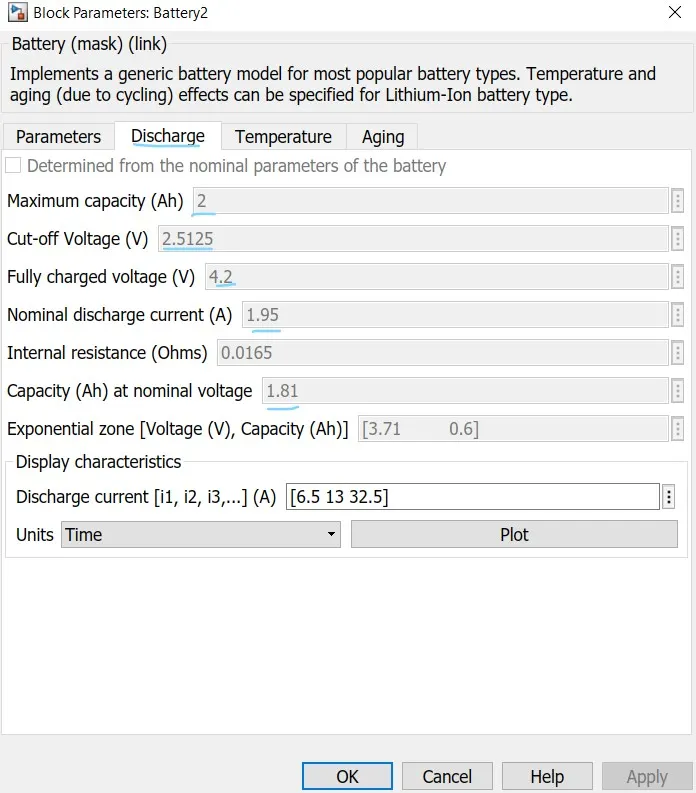
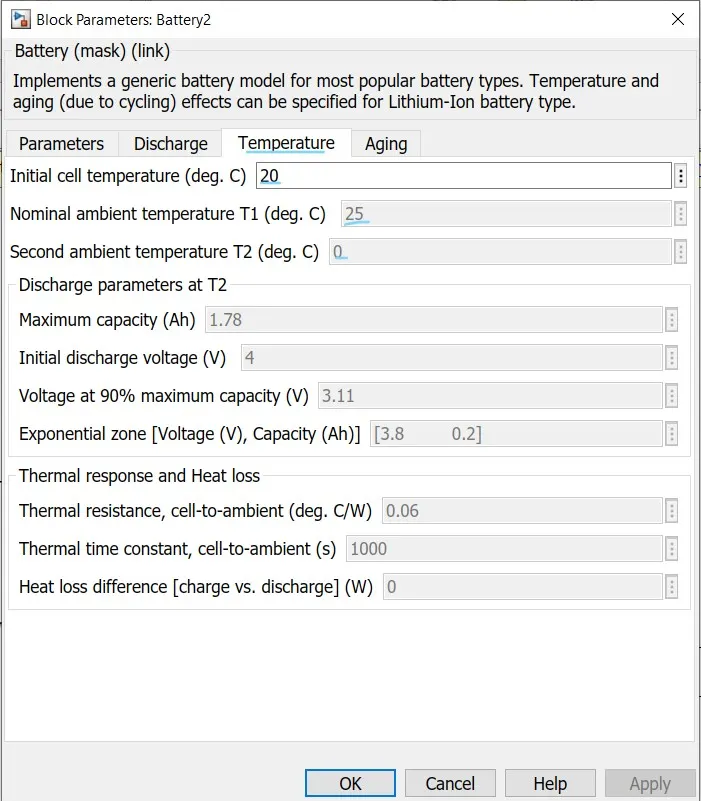
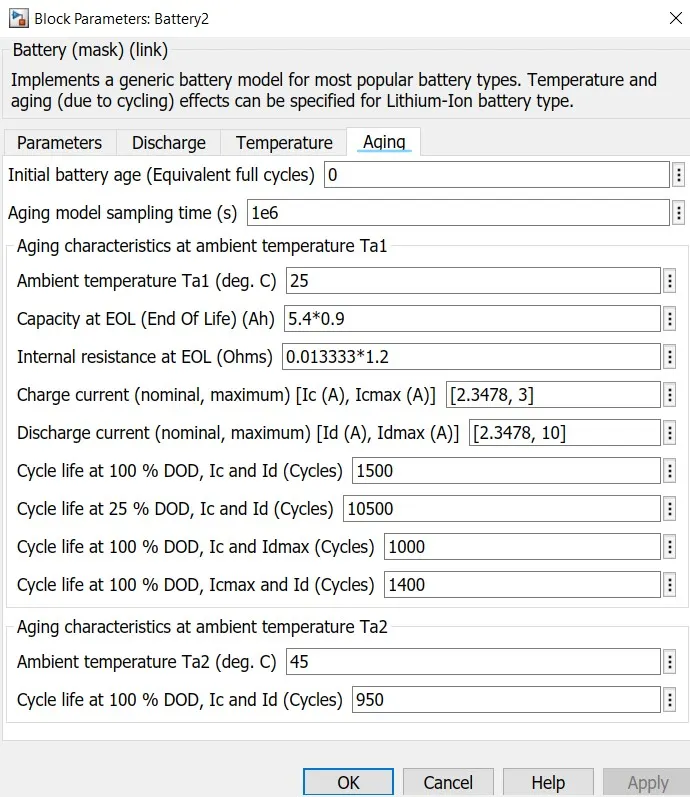
The plot generated for above parameters are as follow:
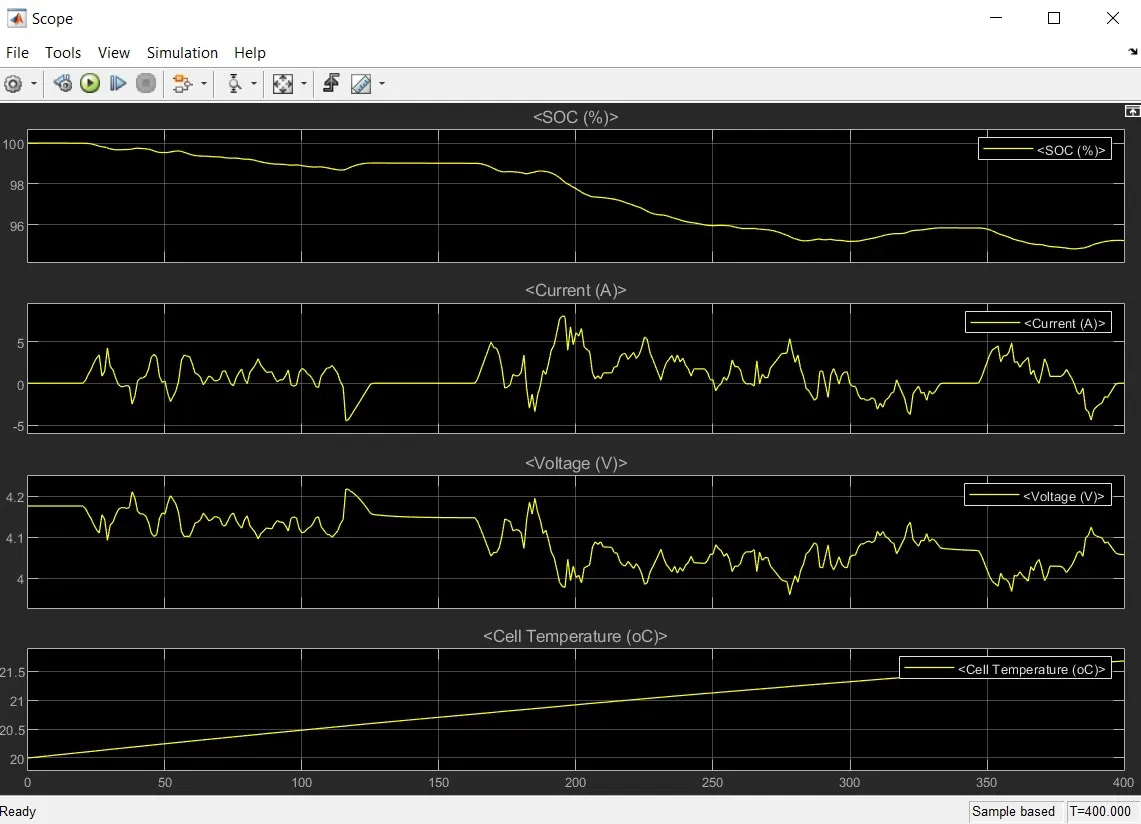
from above result of run time 400 sec. of drive cycle along with the SOC decrease with time, Cell temperature of battery increase from initial temperature of 20 0C to 21.5 0C .