Week 4 - Genetic Algorithm
AIM: Write code in MATLAB to optimize the stalagmite function and find the global maxima of the function.
OBJECTIVE:
- Explain the concept of a genetic algorithm
- Explain the syntax for ga in MATLAB in your report.
INTRODUCTION:
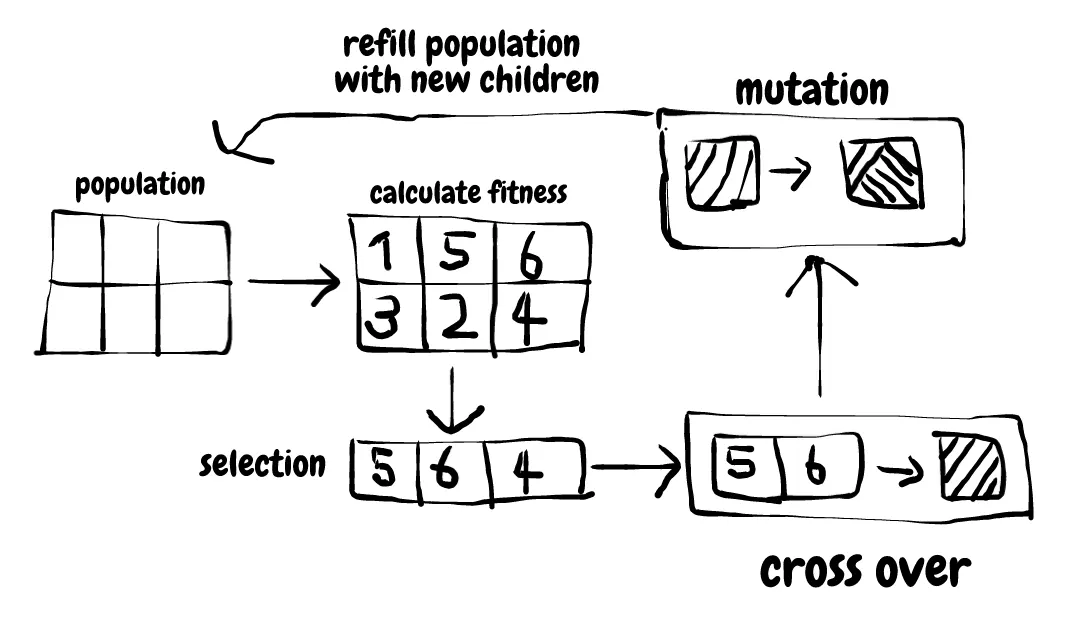
A genetic algorithm is a search heuristic that is inspired by Charles Darwin's theory of natural evolution. This algorithm reflects the process of natural selection where the fittest individuals are selected for reproduction in order to produce offspring of the next generation. (Reference -google)
Five terms are considered in a genetic algorithm.
- Initial population
- Fitness function
- Selection
- Crossover
- Mutation
FORMULA:
CODING SECTION:
code - 1 main program in order to global maxima
clear all
close all
clc

x = linspace(0,1.0,200);
y = linspace(0,1.0,200);

[xx,yy] =meshgrid(x,y);
num_cases =50
f = func_stalagmite(xx,yy)

%Study 1 - Statistical Behavior without bounding
tic
for i= 1:num_cases
    [inputs, fopt(i)] = ga(@func_stalagmite,2);
    xopt(i)=inputs(1);
    yopt(i)=inputs(2);
end
study1_time = toc

figure(1)
subplot(2,1,1)
surfc(-xx, -yy, -f)
hold on
shading interp
plot3(-xopt,-yopt,-fopt,'marker','o','markersize',5,'markerfacecolor','r')
title('Unbounded Inputs')
subplot(2,1,2)
plot(-fopt)
xlabel('Iterations')
ylabel('Maximum Function')
hold off

%Study 2 - Statistical Behavior with Upper and lower Bounds
tic
for i= 1:num_cases
    [inputs, fopt(i)] = ga(@func_stalagmite,2,[],[],[],[],[0;0],[1;1]);
    xopt(i)=inputs(1);
    yopt(i)=inputs(2);
end
study2_time=toc

figure(2)
subplot(2,1,1)
surfc(-xx, -yy, -f)
hold on
shading interp
plot3(-xopt,-yopt,-fopt,'marker','o','markersize',5,'markerfacecolor','r')
title('Bounded Inputs')
subplot(2,1,2)
plot(-fopt)
xlabel('Iterations')
ylabel('Maximum Function')
hold off

%Study 3 - Statistical Behavior - Increasing GA Iterations
options= optimoptions('ga');
options= optimoptions(options,'PopulationSize',200);

tic
for i= 1:num_cases
    [inputs, fopt(i)] = ga(@func_stalagmite,2,[],[],[],[],[0;0],[1;1],[],[],options);
    xopt(i)=inputs(1);
    yopt(i)=inputs(2);
end
study3_time = toc

figure(3)
subplot(2,1,1)
surfc(-xx, -yy, -f)
hold on
shading interp
plot3(-xopt,-yopt,-fopt,'marker','o','markersize',5,'markerfacecolor','r')
title('Bounded Inputs with Increased Iterations')
subplot(2,1,2)
plot(-fopt)
xlabel('Iterations')
ylabel('Maximum Function')
hold off
code - 2 function
function output_values = func_stalagmite(xx,yy)
   f1_x = (sin(5.1*pi.*xx+0.5)).^6;
   f2_x = exp(-4*log(2)*((xx-0.0667).^2)/(0.64));
   f1_y = (sin(5.1*pi.*yy+0.5)).^6;
   f2_y = exp(-4*log(2)*((yy-0.0667).^2)/(0.64));
   output_values = -(f1_x.*f2_x.*f1_y.*f2_y);
endoutput: