Week 3 - Solving second order ODEs
AIM: Write a program in Matlab\Octave that will simulate the pendulum motion.
OBJECTIVE :
the position of the pendulum as a function of time. Use this information to animate the motion of the pendulum, as shown in the below figure.
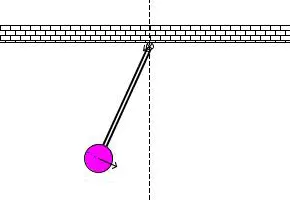
INTRODUCTION :
A pendulum is a weight suspended from a pivot so that it can swing freely. When a pendulum is displaced sideways from its resting, equilibrium position, it is subject to a restoring force due to gravity that will accelerate it back toward the equilibrium position.
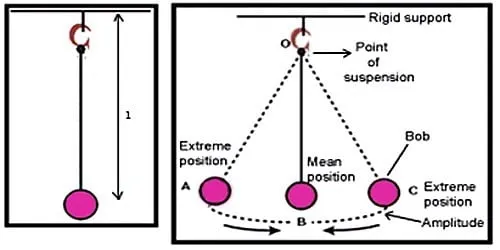
figure: simple pendulum
GIVEN DATA:
L=1 metre,
m=1 kg,
b=0.05.
g=9.81 m/s2.
Simulate the motion between 0-20 sec, for angular displacement=0,angular velocity=3 rad/sec at time t=0.
FORMULA :
Second-order ODE
Where,
g = gravity in m/s2,
L = length of the pendulum in m,
m = mass of the ball in kg,
b=damping coefficient.
CODING SECTION:
Code - 1 : function
function [dtheta_dt] = ode_func(t,theta,b,g,l,m)

    theta1 = theta(1)
    theta2 = theta(2)
    dtheta1_dt = theta2;
    dtheta2_dt = -(b/m)*theta2 - (g/l)*sin(theta1);
    dtheta_dt = [dtheta1_dt; dtheta2_dt];

end
code - 2: code for simulating the pendulum using second-order ODE
 clear all
 close all
 clc

 b = 0.05; %damping coefficient
 g = 9.81; %gravity in m/s2
 l = 1;    %length of the pendulum in m
 m = 1;    %mass of the ball in kg

gravity in m/s2,

L = length of the pendulum in m,

m = mass of the ball in kg,

b=damping coefficient.

 %initial condition
 theta_0 = [0;4];

 % time points
 t_span = linspace(0,20,150);

 %solve ODE
 [t, results] = ode45(@(t,theta) ode_func(t, theta, b, g, l, m),t_span, theta_0);

 plot (t, results(:,1))
 hold on
  plot (t, results(:,2))


  xlabel('time')
  ylabel('plot')

  %animation of pendulum

  ct = 1;
     for i = 1:length(results(:,1))
      x0 = 0
      y0 = 0

      x1 = l*sin(results(i,1));
      y1 =-l*cos(results(i,1));

       figure(2)

       plot([-1 1],[0 0],'linewidth',5,'color','r');
       axis([-2 2 -2 2])

        xlabel('time')
        ylabel('plot')

       grid on
       line([x0 x1],[y0 y1],'linewidth',3,'color','b');
       hold on;
       plot(x1,y1,'o','markersize',20,'markerfacecolor','y','markeredgecolor','y');
       hold off;

       pause(0.001)
       M(ct) = getframe(gcf);
      ct = ct + 1;
  end

movie(M)
v = VideoWriter('pendulumanimation.avi','Uncompressed AVI');

open(v)
writeVideo(v,M)
close(v)
output:
figure: graph between velocity & time
figure: simple pendulum
figure: workspace data
Animation video:
Embed Item: Animation of simple pendulum motion
ERROR DURING EXECUTION:
Error - 1: This type of error comes because I forgot end bracket.
Error - 2: This type of error comes while I using for-loop because 'i' through ':' so