Week - 4 - Crash Box Simulation
OBJECTIVES:
To simulate the crash box(1.2 and 1.5mm thick) onto a rigid wall at 50kmph and obtain the following output.
Deliverables:
- Input.k file and output files (d3plot, glstat, sleout, rcforc)
- Animation of the final simulation
- Cross-sectional force generated in the middle of the crashbox (along its length)
- Acceleration plot of a node in the middle of the crashbox (along its length)
- Maximum directional stress and strain along the length of the crashbox (X strain, Y strain etc)
- Plot of all energies (total, internal, kinetic, hourglass, sliding)
- Compare the accelerations and stress/strain plots of 1.2/1.5mm crashboxes.
PROCEDURE:
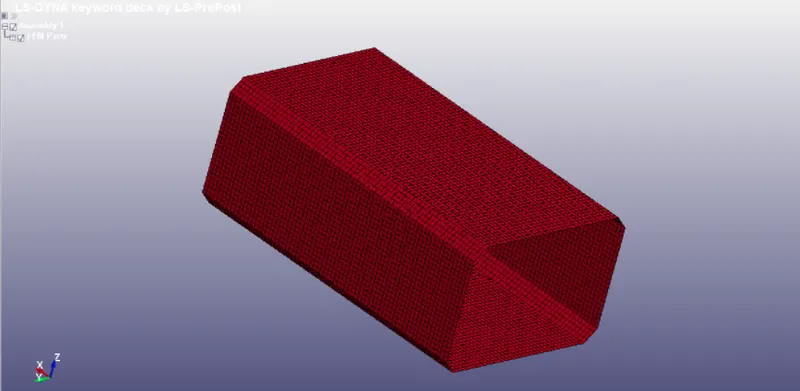
1. Import crash_box.k file in LS-prepost.
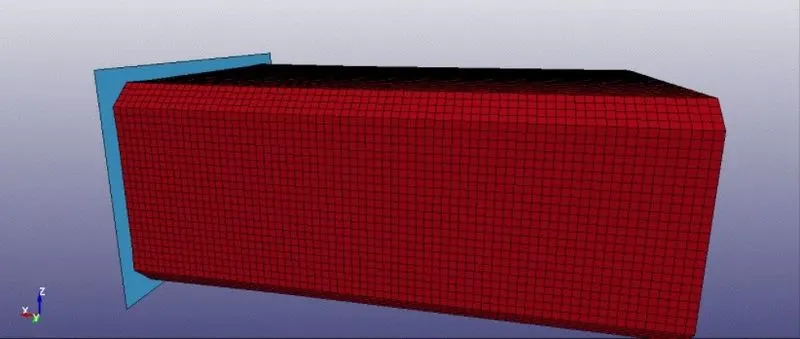
2. Create a rigid wall planar using create entity and tranlate it to suitable location.
3. Create a section ID for shell with ELFORM 2 and thickness 1.2mm for casel and after simulation change to 1.5mm in .k file and save it in another folder for case2.
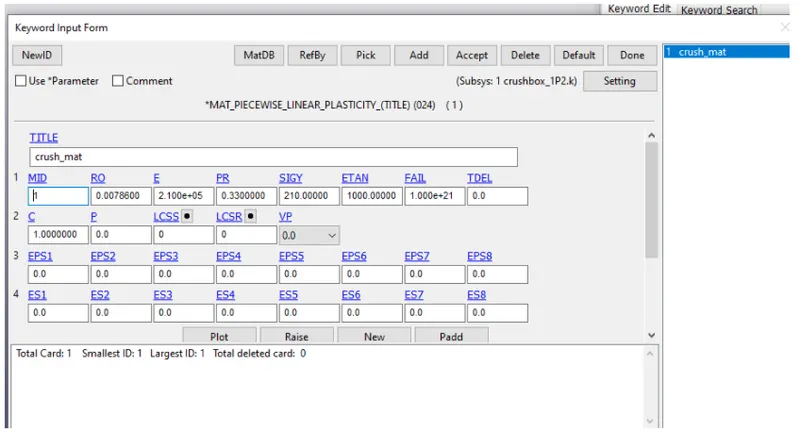
4. Create a material 024 Piecewise Linear Plasticity and assign properties of Steel in gmm ms. Assign Material ID and section ID to Part card.
5. Create a keyword for initial velocity of 13.88mm/ms (50kmph) along Vx.
6. Create contact keyword with Automatic_Single_Surface and select slaves as the crush box nodes and no master since rigid body is automatically considered as master.
7. Create a Hourglass keyword with IHQ=2 and a Control_hourglasss keyword with | THQ=2, QH=0.1.
8. Create Database keyword for ASCII and select ELOUT, GLSTAT, RCFORCE, SECFORCE, SLEOUT with DT 0.5. Binary D3plot with DT 0.05 is assigned.
9. Create crosssection_plane under Create entity> database in the middle of the component. Create History_node and history_shell database.
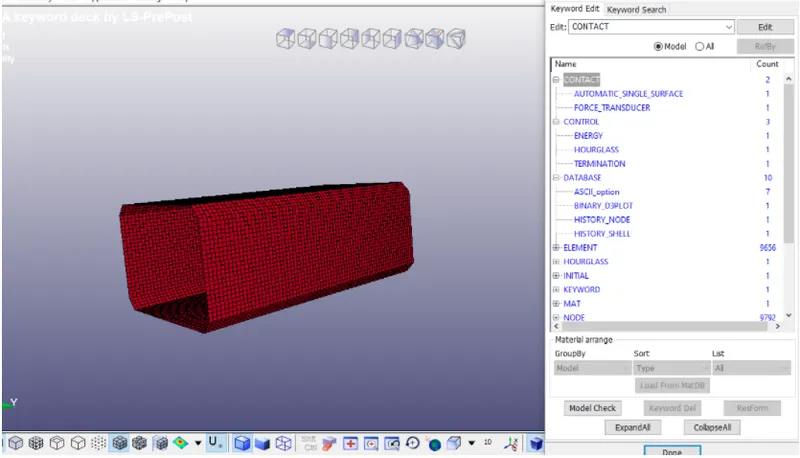
10. Assign control termination with 1 ms simulation time. Save the keyword file and run in LS-Dyna Manager.
11. After normal termination CPU clocks 418 nanoseconds, Open the Binary plot file in LS-Dyna and run the simulation.
12. Vonmisses stresses
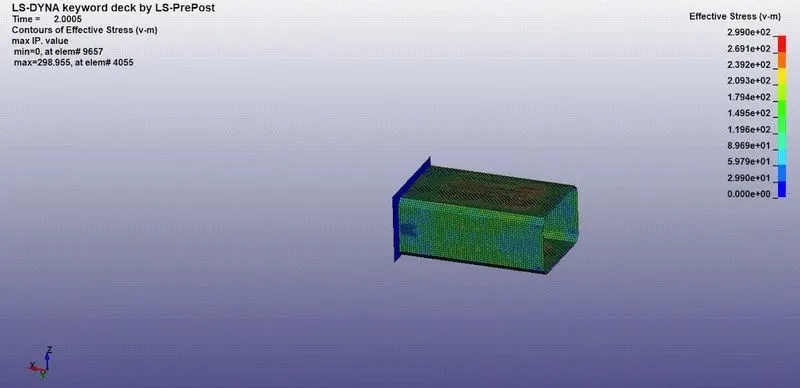
Crush box 1.2mm thick
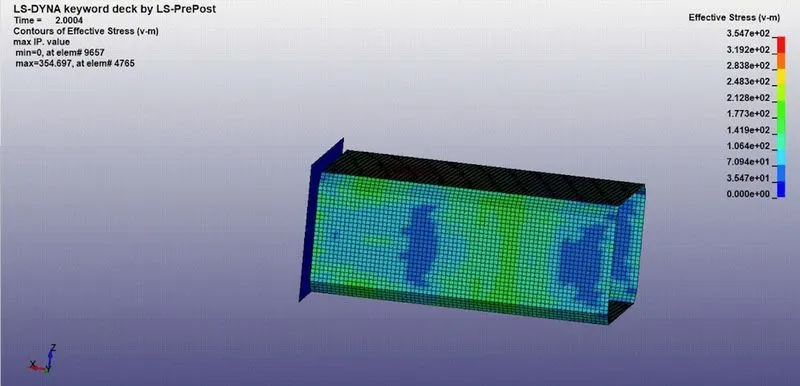
Crush box 1.5mm thick
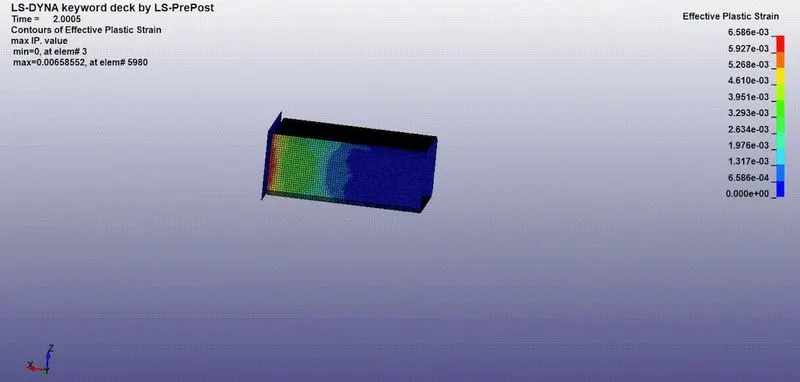
Effective plastic strain of 1.2mm thick
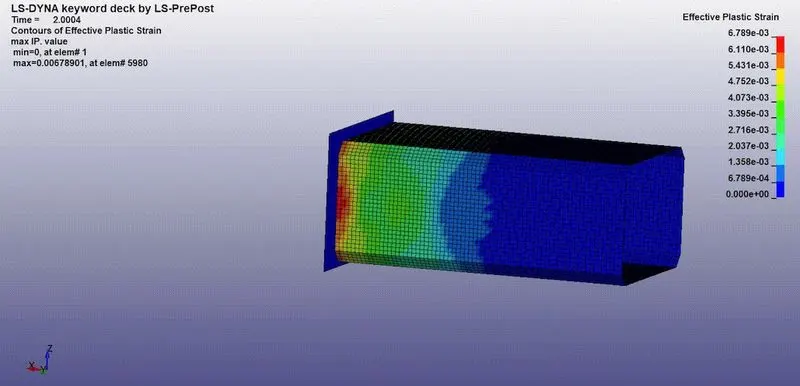
Effective plastic strain of 1.5mm thick
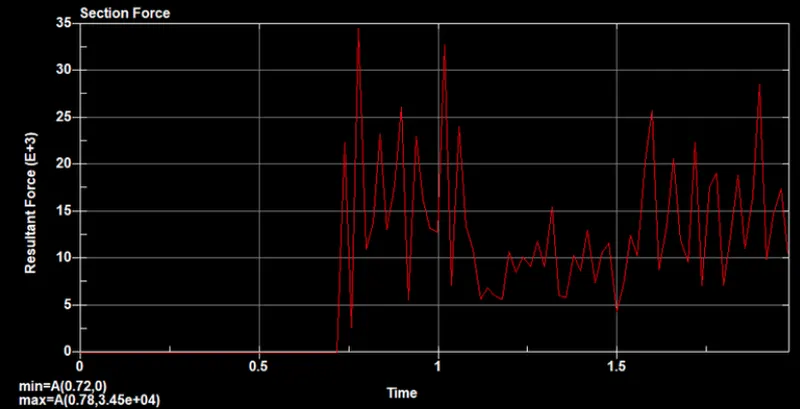
Section force on 1.2mm thick crash box
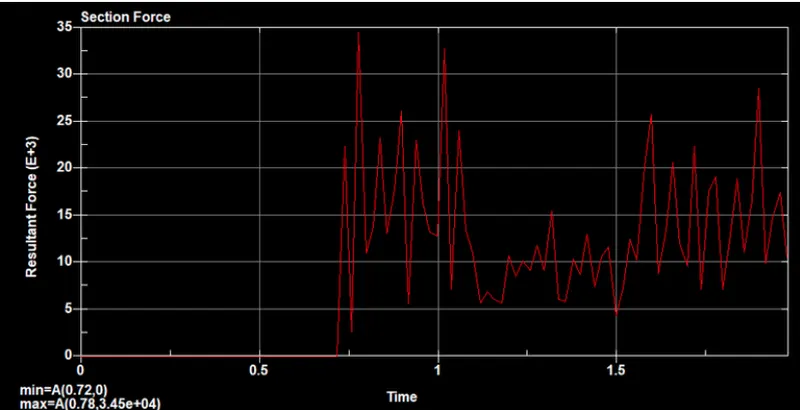
Section force on 1.5mm thick crash box
Acceleration plot of a node in the crash box:
The resultant acceleration is plotted for a node 6252
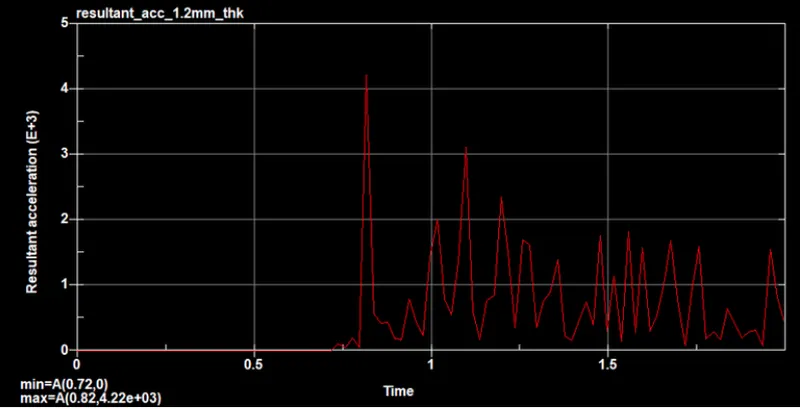
Resultant acceleration plot of a node in 1.2mmt crash box.
For 1.2mm thick crash box a resultant acceleration is developed during the collision with rigid wall and increases to a maximum of 4.22x E+3 mm/ms at time 0.82 ms and decreases while the crash box is rebounded.
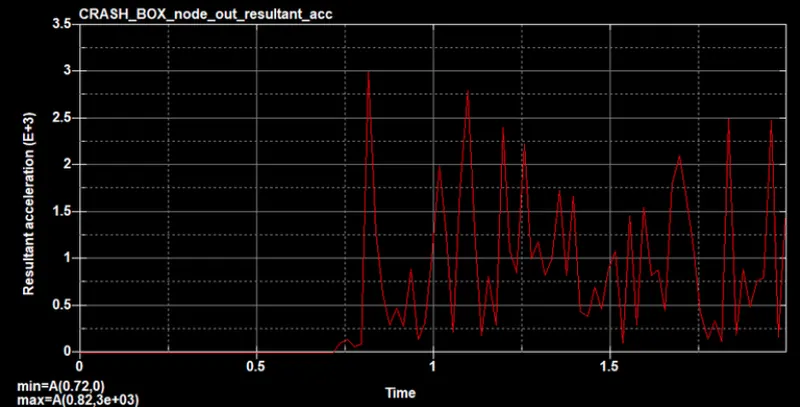
Resultant acceleration plot of a node in 1.5 mmt crash box.
For 1.5mm thick crash box a resultant acceleration is developed during the collision with rigid wall and increases to a maximum of 3E3 mm/ms at time 0.82 ms and decreases while the crash box is rebounced.
Directional stress along the length of the crash box.
The directional stress like X-stress, y-stress and z-stress is plotted for the crash box with 1.2 mm and 1.5 mm thickness.
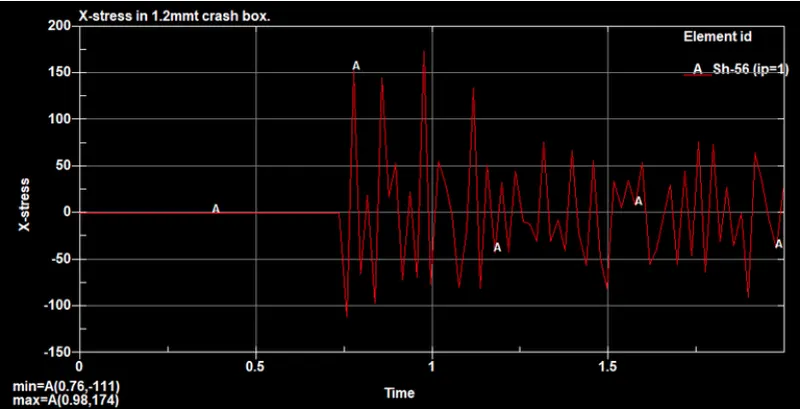
X-Stress in 1.2mmt crash box
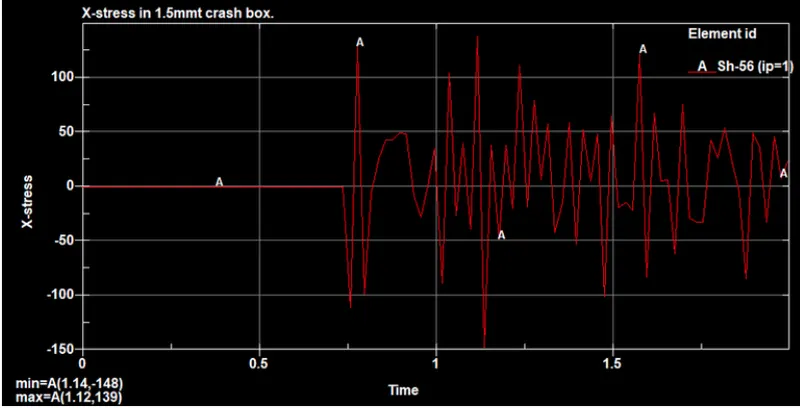
X-Stress in 1.5mmt crash box
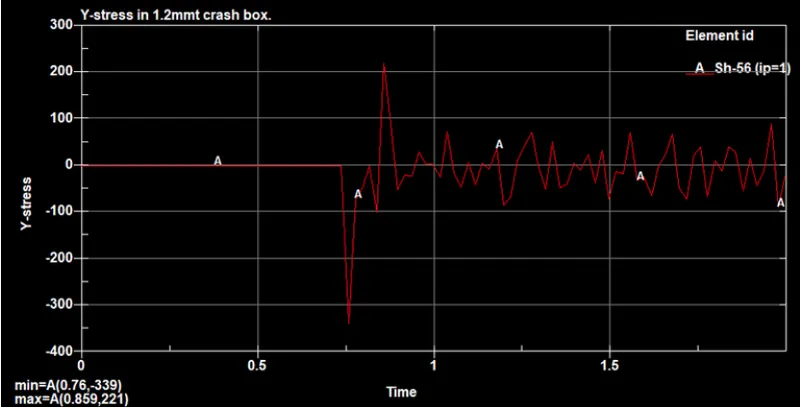
Y-Stress in 1.2mmt crash box
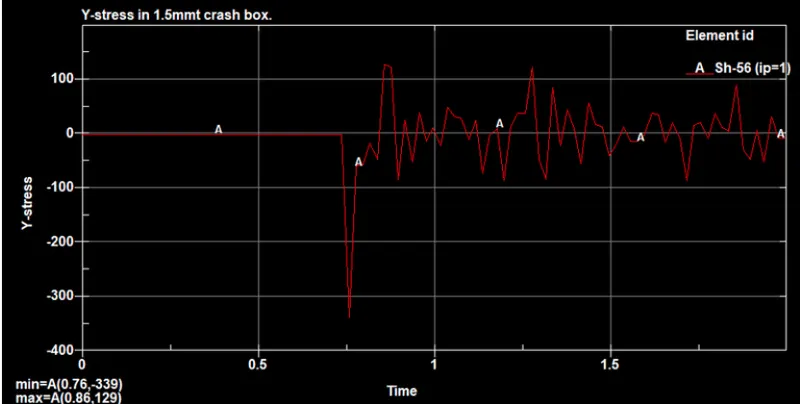
Y-Stress in 1.5mmt crash box
Energy plots:
The energy plots comprising of kinetic energy, internal energy, total energy, hourglass energy and sliding energy were plotted for 1.2 mm and 1.5 mm thick crash boxes. The graph represents an energy balance of a dynamic test on a crash box and it can be noted that as the kinetic energy decrease, the internal energy increases as expected from the theory. The other important things to consider are that the total energy has to remain constant and the sliding interface must remain low.
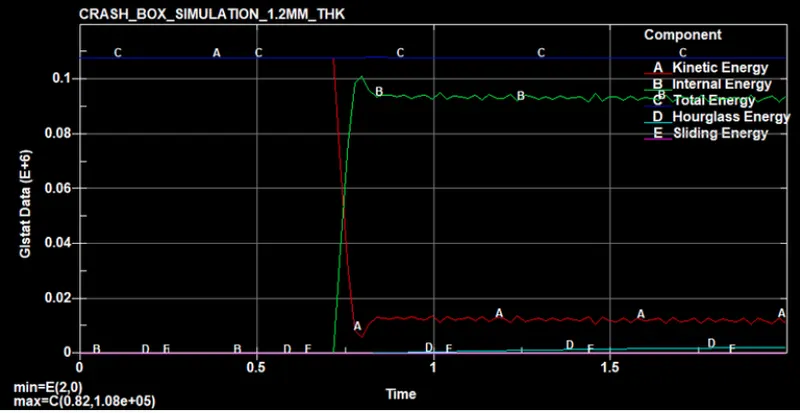
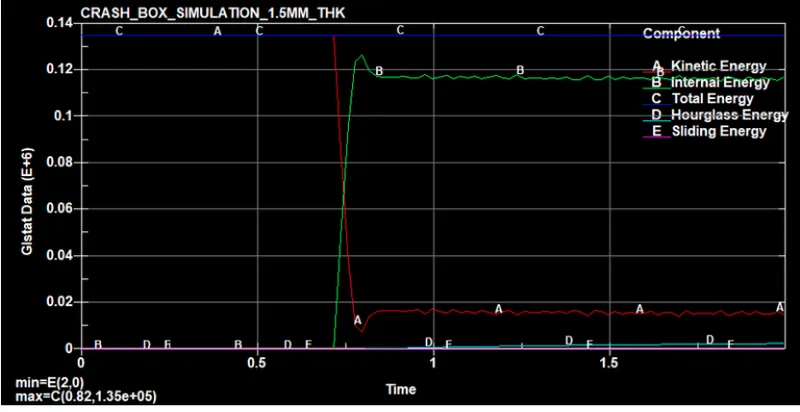
The Global Energy plots show the Kinetic energy, internal energy, Total energy, Sliding energy, and Hourglass energy values for the crash simulation. The Energies are higher for the 1.5 mm thick crash box. The total energy for the 1.2 mm thick and 1.5 mm thick crash box was recorded as 0.11E+6 N-mm and 0.14E+6 N-mm respectively.
At 0ms, the whole of the total energy is Kinetic energy. But as the simulation progresses and the impact between the Crash box and the Rigid wall takes place, at approx 0.36 ms, the Kinetic energy starts getting converted into Internal energy. The Internal energy reaches its peak and the kinetic energy reaches its lowest value at about 0.44 ms when the crash box is on the verge of getting rebounded from the rigid wall. The crash box then moves with a constant rebound velocity which is reflected in the energy plot as internal energy gets converted to kinetic energy and remains constant through the rest of the simulation.
CONCLUSION:
1. The keywords are properly defined for simulation
2. The Simulations are represented clearly.
3. Plots for various outputs are compared.
4. The results are reported.