Configuration and Characteristics of Battery Model
Question
1.From datasheet of a lithium ion battery configure the generic battery model in MATLAB
2.Simulate generic battery model charge discharge using UDDS data.
Your Answers
Week 4 Configuration and Characteristics of Battery Model Problem Statement:
A. From the datasheet of a lithium-ion battery configure the generic battery model in MATLAB
B. Simulate generic battery model charge-discharge using UDDS data.
Answer:
(A); To configure a Lithium-ion battery with MATLAB Simulink, a datasheet of a cylindrical lithium-ion rechargeable cell is considered and the link to the datasheet is provided in reference no. 1. The battery model is A123 ANR26650M1 and the specification mentioned in this datasheet describes the technological parameters and testing standard for the lithium-ion rechargeable cell manufactured and supplied A123 Systems
Blocks used to Configure and Simulate the lithium-ion battery model:
1)
Battery
Description
The Battery block implements a generic dynamic model that represents most popular types of rechargeable batteries.
This figure shows the equivalent circuit that the block models.
Charge and Discharge Characteristics
The circuit parameters can be modified to represent a specific battery type and its discharge characteristics. A typical discharge curve consists of three sections.
The first section represents the exponential voltage drop when the battery is charged. The width of the drop depends on the battery type. The second section represents the charge that can be extracted from the battery until the voltage drops below the battery nominal voltage. Finally, the third section represents the total discharge of the battery, when the voltage drops rapidly.
When the battery current is negative, the battery recharges, following a charge characteristic.
The model parameters are derived from the discharge characteristics. The discharging and charging characteristics are assumed to be the same.
The Exp(s) transfer function represents the hysteresis phenomenon for the lead-acid, nickel-cadmium (NiCD), and nickel-metal hydride (NiMH) batteries during the charge and discharge cycles. The exponential voltage increases when a battery is charging, regardless of the battery's state of charge. When the battery is discharging, the exponential voltage decreases immediately.
The state of charge (SOC) for a battery is a measure of battery's charge, expressed as a percent of the full charge. The depth of discharge (DOD) is the numerical compliment of the SOC, such that DOD = 100% - SOC.
For example, if the SOC is:
100% — The battery is fully charged and the DOD is 0%.
75% — The battery is 3/4 charged and the DOD is 25%.
50% — The battery is 1/2 charged and the DOD is 50%.
The A123 ANR26650M1 data sheet specifications include the required discharge curve points and other required parameters.
Now, specific data which are adopted from the referred datasheet for configuration of the battery are given below:
These parameters are derived from the data sheet for the A123 Li-ion temperature-dependent battery model.
| Parameter | Value |
|---|---|
|
Nominal voltage (c) |
|
|
Rated capacity |
|
|
Maximum capacity (d) |
|
|
Fully charged voltage (a) |
|
|
Nominal discharge current |
|
|
Internal resistance |
|
|
Capacity at nominal voltage (c) |
|
|
Exponential zone (b) |
[ |
|
Nominal ambient temperature |
|
|
Second ambient temperature |
|
|
Maximum capacity at 0°C (h) |
|
|
Initial discharge voltage at 0°C (e) |
|
|
Voltage at 90% maximum capacity at 0°C (g) |
|
|
Exponential zone at 0°C (f) |
[ |
|
Thermal resistance, cell-to-ambient (estimated) |
|
|
Thermal time constant, cell-to-ambient (estimated) |
|
The highlighted parts are given input to the battery model for the simulation, referring to the datasheet. The parameters given to the Simulink window are given below:
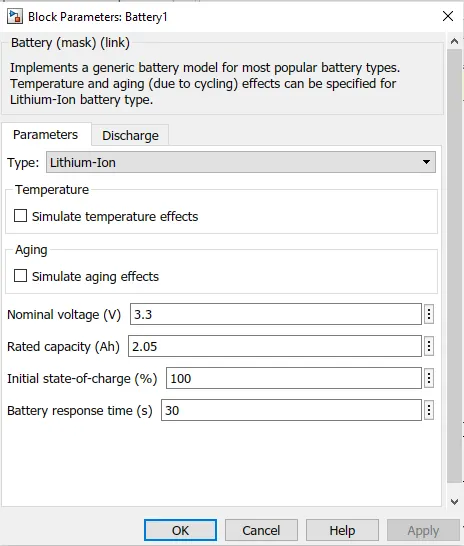
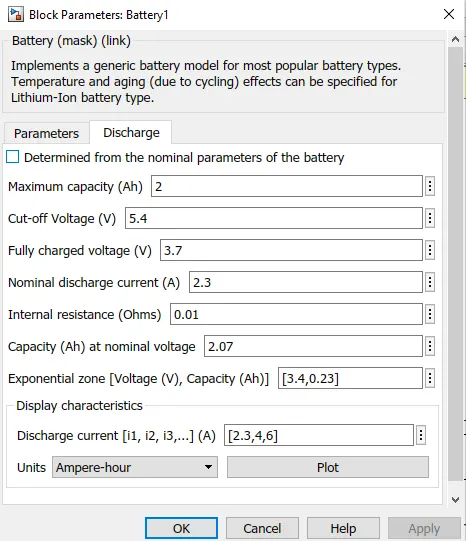
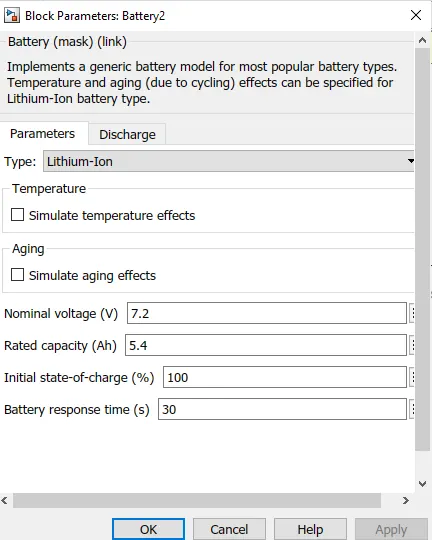
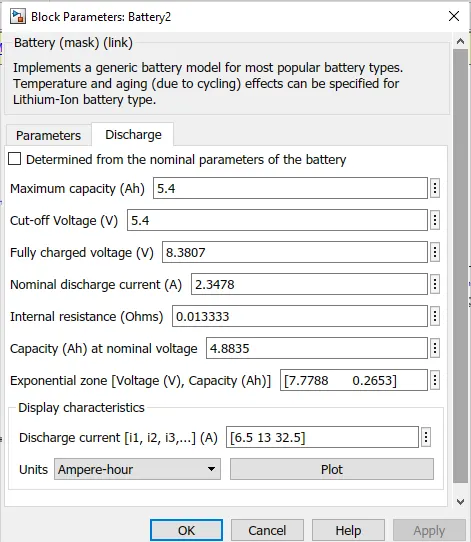
To understand the relation between battery parameters and the output curve natures another lithium-ion battery is simulated with the same kind of input conditions an< all the same connected blocks. The major difference is that the battery is given thi value defaults to the particular battery block, and is given below:
2) Drive Cycle Source(UDDS ):
The US FTP-72 (Federal Test Procedure) cycle is also called Urban Dynamometer Driving Schedule (UDDS) or LA-4 cycle (CFR 40, 86. App. I) [2656]. This cycle should not be confused with the UDDS schedule for heavy-duty vehicles. The cycle simulates an urban route of 7.5 mi (12.07 km) with frequent stops. The maximum speed is 56.7 mph (91.25 km/h) and the average speed is 19.6 mph (31.5 km/h).
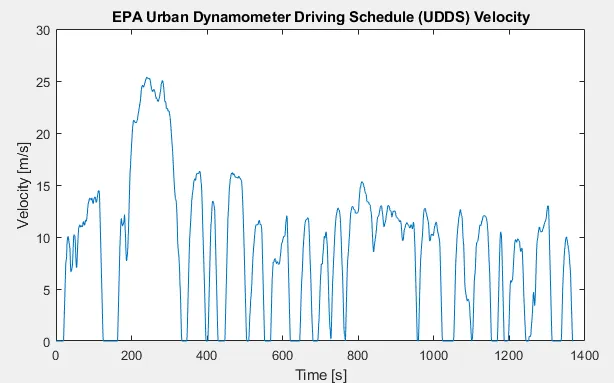
The cycle consists of two phases: (1) 505 s (5.78 km at 41.2 km/h average speed) and (2) 867 s. The first phase begins with a cold start. Weighting factors of 0.43 and 0.57 are applied to the first and second phases, respectively. Emissions are expressed in g/mile or g/km. The same engine driving cycle is known in Australia as the ADR 27 (Australian Design Rules) cycle and in Sweden as A10 or CVS (Constant Volume Sampler) cycle. In Sweden, both phases have the same weighting factors.
3) Controlled Current Source
Description
The Controlled Current Source block converts the Simulink® input signal into an equivalent current source. The generated current is driven by the input signal of the block. The positive current direction is as shown by the arrow in the block icon.
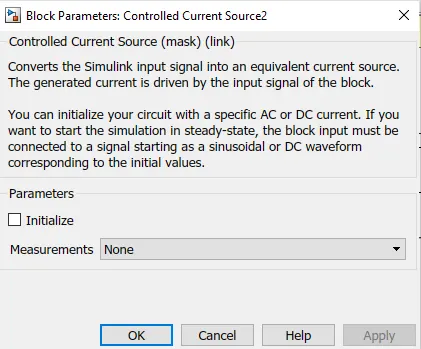
You can initialize the Controlled Current Source block with a specific AC or DC current. If you want to start the simulation in steady state, the block input must be connected to a signal starting as a sinusoidal or DC waveform corresponding to the initial values
4)
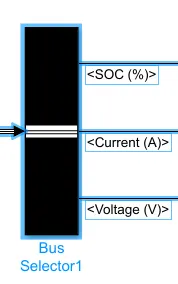
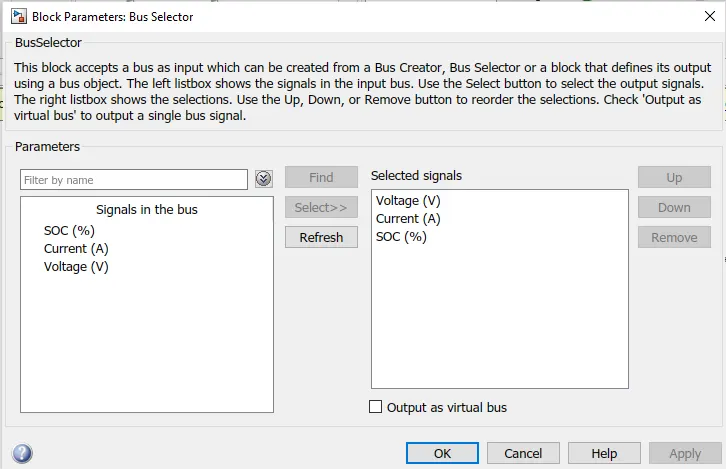
This block accepts a bus as input which can be created from a Bus Creator, Bus Selector or a block that defines its output using a bus object. The left listbox shows the signals in the input bus. Use the Select button to select the output signals. The right listbox shows the selections. Use the Up, Down, or Remove button to reorder the selections. Check 'Output as virtual bus' to output a single bus signal.
5) powergui
Description
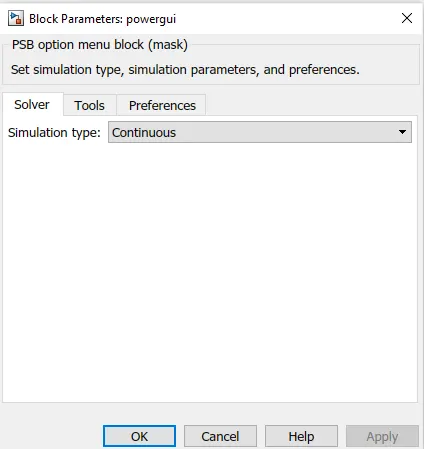
The powergui block allows you to choose one of these methods to solve your circuit:
Continuous, which uses a variable-step solver from Simulink®
Discretization of the electrical system for a solution at fixed time steps
Continuous or discrete phasor solution
The powergui block also opens tools for steady-state and simulation results analysis and for advanced parameter design.
You need the powergui block to simulate any Simulink model containing Simscape™ Electrical™ Specialized Power Systems blocks. It stores the equivalent Simulink circuit that represents the state-space equations of the model.
When using one powergui block in a model:
Place the powergui block in the top-level diagram for optimal performance.
Make sure that the block uses the name powergui.
The powergui block becomes disabled during model update. To ensure proper model execution, do not restore the library link for the powergui block.
(B)
In this section, the outputs will be shown and discussed of the lithium-ion battery simulation. To understand the output results and correlate them to the battery parameters; another lithium-ion battery is used to observe the same results but with a different rating given as default in the Matlab block of the same. A complete picture of the model is given below:
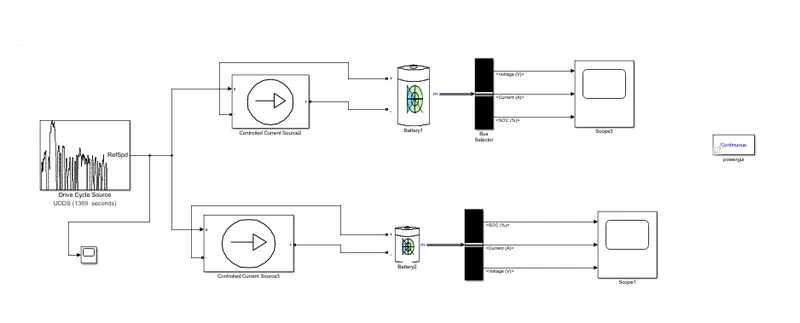
The basic understanding of the battery modeling can be explained in simpler terms:
• The signal builder block is used to create the UDDS drive cycle data. The main drawback of this block is that it accepts data in the form of the current profile. So, the UDDS drive cycle data's speed vs time data was converted to current vs time data. And the excel file containing the data is imported to the block.
• The output of the signal builder is given to the current-controlled source which is connected to the battery as a load. So the battery discharges according to this signal given by the signal builder which is the UDDS drive cycle data.
• The Powergui block is necessary for the simulation of any Simulink model containing SimPowerSystemsTM blocks. It is used to store the equivalent Simulink circuit that represents the state-space equations of the model.
• The output of the battery is given to the scope via a bus selector. The bus selector outputs the battery signals (voltage, current, SOC) to the scope.
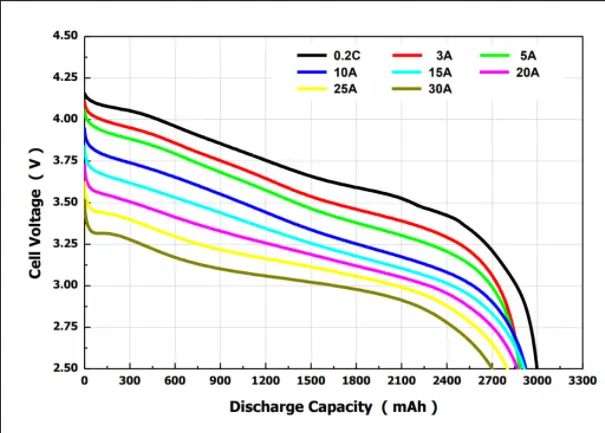
The same characteristics are compared with the help of the plot function of the battery parameter window and the result is:
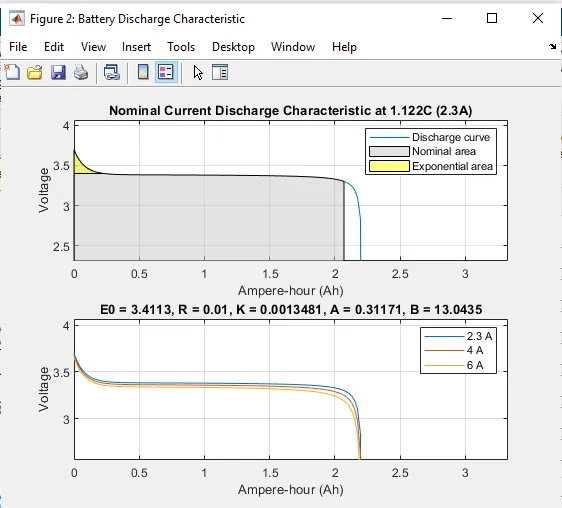
As we can see, the result characteristics are a clear match with the datasheet provided here. From the discharge curves, the nominal and exponential areas are clearly distinguishable. The maximum capacity of this battery is 2.6Ah, while the standard discharge current rate is 0.52A, which makes it a standard discharge of 0.2C rate, capable of running for 5 hours at 0.52A. Intuitively, that would mean that the battery should be able to run at 2.6A for 1 hour. However, due to Peukert's law, this is not possible in reality due to the internal resistance and heat generated by the battery when it has to supply a higher current. If the battery were discharged at a 1C rate i.e. 2.6A, then it should certainly run for less than 1 hour due to reduced capacity. According to the discharge curves in the datasheet, it is shown that when the battery is discharged at 7.8A or 3C, then the capacity reduces to about 85% i.e. from 2.6Ah to
2.2Ah. In addition, due to Peukert's law, the battery should not be able to run for 20 minutes at 7.8A. However, the curves plotted above depict that the capacity has only reduced from 2.6Ah to
2.53Ah and it will also run for 20 minutes at 7.8A - both of which should not be the
case.
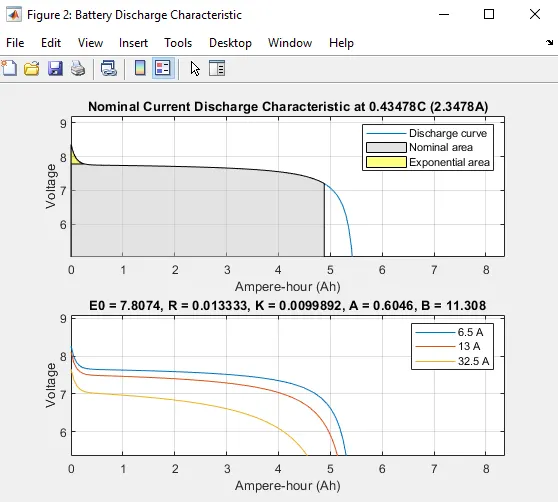
Hence, this implies that this built-in battery mode! in MATLAB/SIMULINK does not account for Peukert's law and that the internal resistance of the battery does not vary with the amplitude of the current. The same is observed with the default battery parameter of the block and showing the same type of behavior; all the same, things are happening but in those instances the values are different and it is shown below:
Output Voltage-Current-SOC Graph:
Simulated with the datasheet lithium-ion battery parameters:-
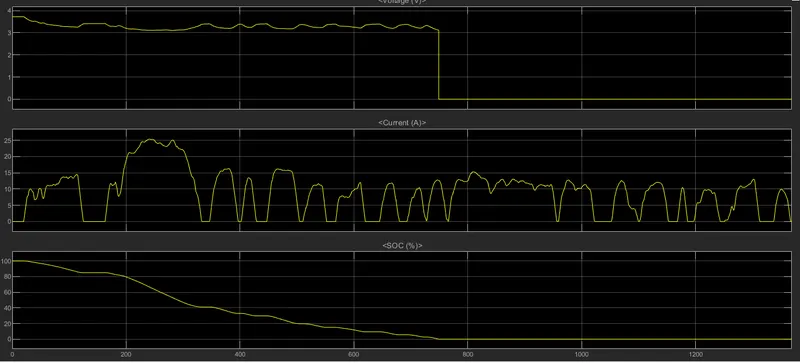
Simulated with the default lithium-ion battery parameters:-
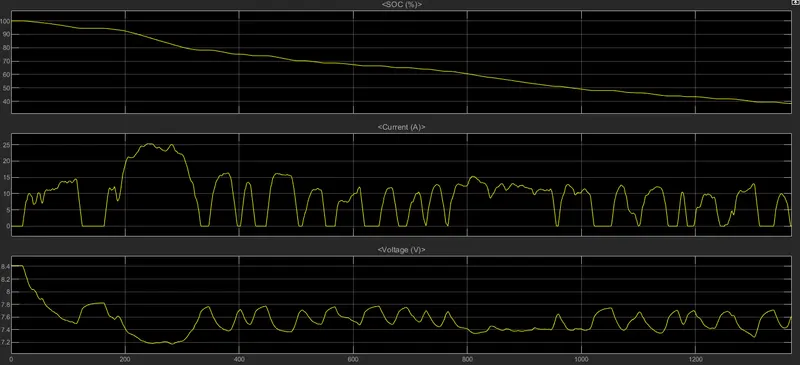
From both the output results of the Voltage-Current-SOC graph, we can see that the voltage is quickly falling from its maximum value Simulated with the default lithium-ion battery parameters o nominal value and then slowly decreasing as per the requirements of the UDDS drive cycle data. The rise in voltage is happening because at that instance the regenerative braking is happening and for that, the battery gets charged, and voltage rise bit for a very brief moment. The current drawn from the battery is shown by the second row of the output result. The portion where the negative current is shown is basically the regenerative braking part, where the battery getting charged by applying braking with the car paddle. The State Of Charge shows us the amount of charge left in the battery, giving us a rough idea about the same. The SOC is decreased as time increases and the battery is discharged. Only at the times of regenerative braking, the SOC level of the battery is raised.
Conclusions: The lithium-ion battery model with the help of a datasheet is developed and the required output graphs for the same are given.
References: 26650.pdf (a123batteries.com)