Project 1 - Parsing NASA thermodynamic data
AIM:- TO write a function that extracts the 14 co-efficients and calculates the enthalpy, entropy and specific heats for all the species in the data file.
INTRODUCTION:-
FILE PARSING:-Parsing a file means reading in a data stream of some sort and building an in memory model of the semantic content of that data. This aims at facilitating perfoming some kind of transformation on the data.
THEORY:-
Thermodynamic properties:-
1)Specific heat(cp):-ratio of the quantity of heat required to raise the temperature of a body one degree to that required to raise the temperature of an equal mass of water one degree
2)enthalpy(h):-a thermodynamic quantity equivalent to the total heat content of a system. It is equal to the internal energy of the system plus the product of pressure and volume.
3)entropy(S):-a thermodynamic quantity representing the unavailability of a system's thermal energy for conversion into mechanical work, often interpreted as the degree of disorder or randomness in the system.
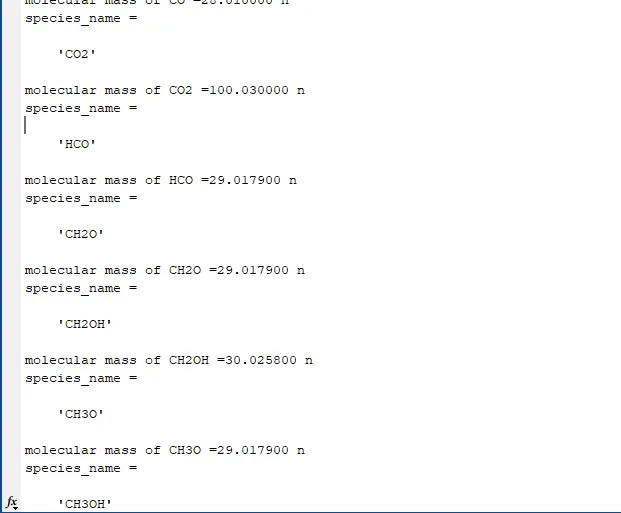
1.Calculate the molecular weight of each species and display it in the command window.
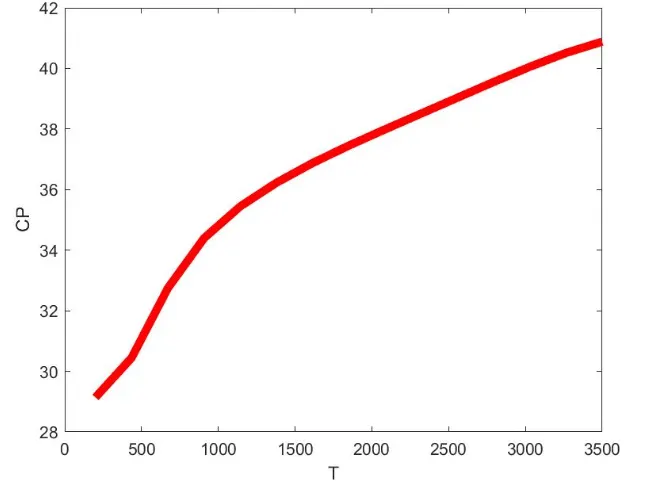
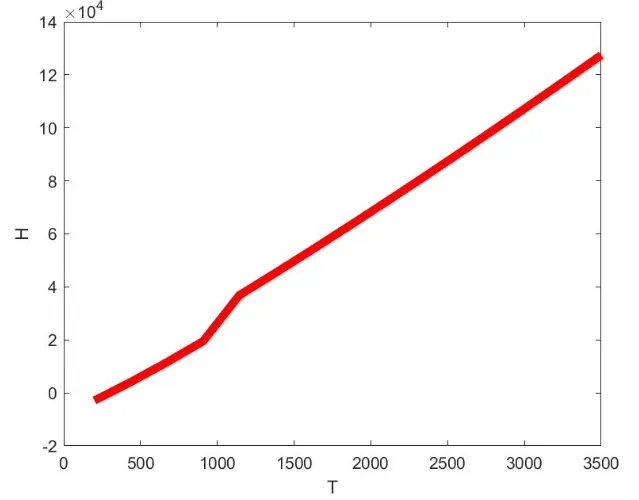
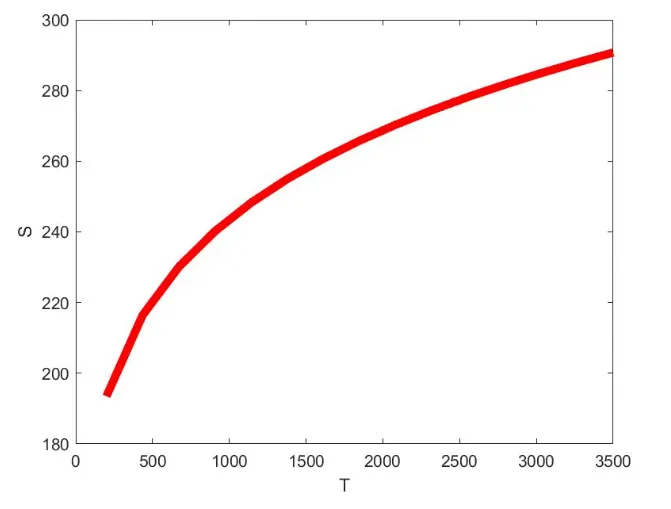
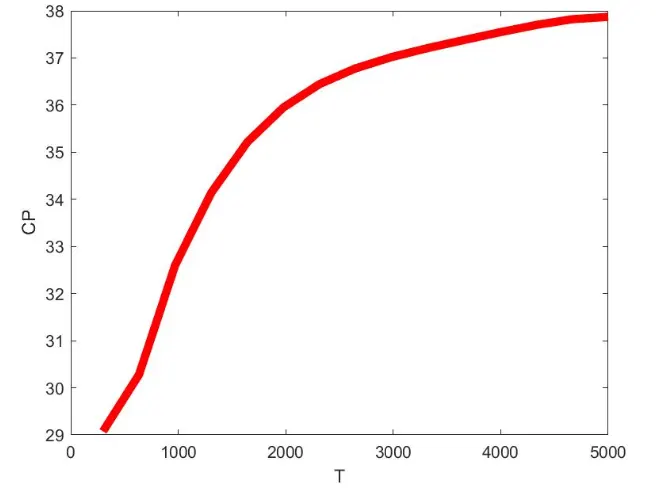
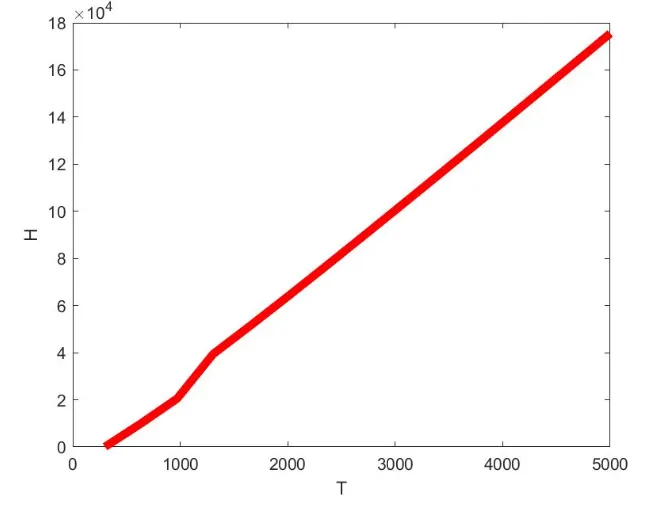
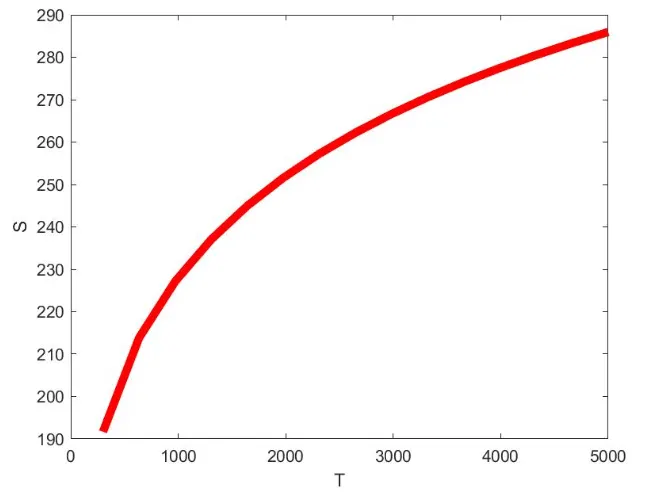
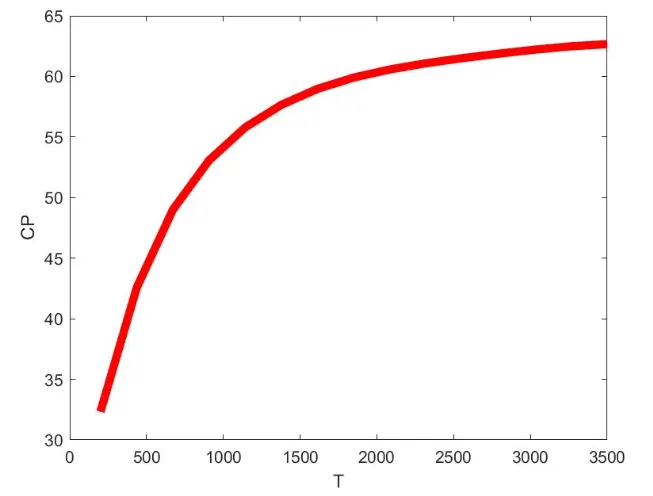
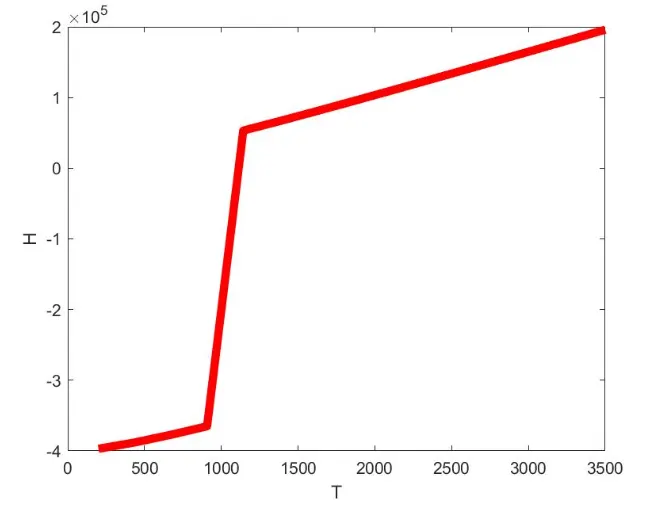
3. Plot the Cp, Enthalpy and Entropy for the local temperature range (low temperature : high temperature) specific for each species.
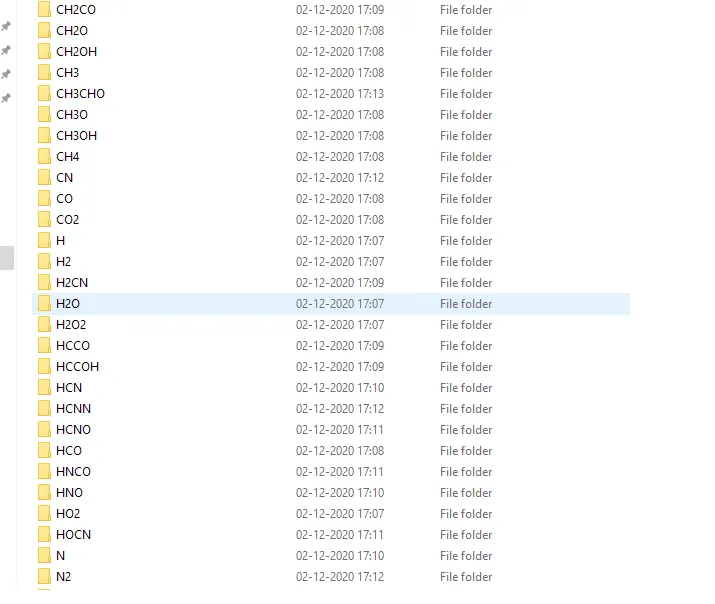
4. Save the plots as images with appropriate names and dump them in separate folders for each species with suitable name. All these should be generated automatically.
5. taking the "THERMO.dat" file as an input and generate Cp, H and S plots.
6. write a detailed report to describing logic.
Here R is the universal gas constant, T is the temeprature
The FIRST 7 coefficients are HIGH-temperature coefficients and the SECOND 7 coefficients are LOW-temperature coefficients.
Also use the LOCAL TEMPERATURE RANGES which is unique for each individual species
MATLAB PROGRAMME:-
close all
clear all
clc


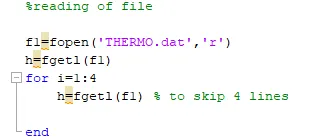
%reading of file

f1=fopen('THERMO.dat','r')
h=fgetl(f1)
for i=1:4
    h=fgetl(f1) % to skip 5 lines

end
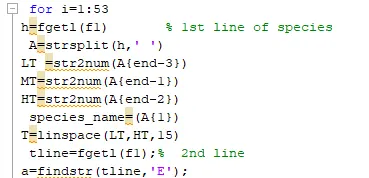
 for i=1:53
h=fgetl(f1)       % 1st line of species
 A=strsplit(h,' ')
LT =str2num(A{end-3})
MT=str2num(A{end-1})
HT=str2num(A{end-2})
 species_name=(A{1})
T=linspace(LT,HT,15)
 tline=fgetl(f1);%  2nd line
a=findstr(tline,'E');
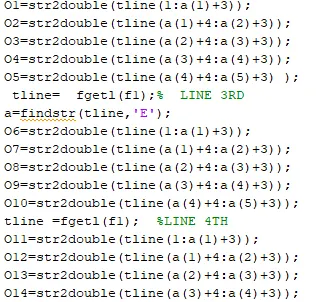
O1=str2double(tline(1:a(1)+3));
O2=str2double(tline(a(1)+4:a(2)+3));
O3=str2double(tline(a(2)+4:a(3)+3));
O4=str2double(tline(a(3)+4:a(4)+3));
O5=str2double(tline(a(4)+4:a(5)+3) );
 tline=  fgetl(f1);%  LINE 3RD
a=findstr(tline,'E');
O6=str2double(tline(1:a(1)+3));
O7=str2double(tline(a(1)+4:a(2)+3));
O8=str2double(tline(a(2)+4:a(3)+3));
O9=str2double(tline(a(3)+4:a(4)+3));
O10=str2double(tline(a(4)+4:a(5)+3));
tline =fgetl(f1);  %LINE 4TH
O11=str2double(tline(1:a(1)+3));
O12=str2double(tline(a(1)+4:a(2)+3));
O13=str2double(tline(a(2)+4:a(3)+3));
O14=str2double(tline(a(3)+4:a(4)+3));
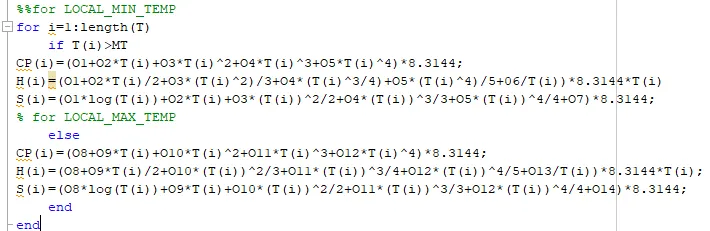
%%for LOCAL_MIN_TEMP
for i=1:length(T)
    if T(i)>MT
CP(i)=(O1+O2*T(i)+O3*T(i)^2+O4*T(i)^3+O5*T(i)^4)*8.3144;
H(i)=(O1+O2*T(i)/2+O3*(T(i)^2)/3+O4*(T(i)^3/4)+O5*(T(i)^4)/5+06/T(i))*8.3144*T(i)
S(i)=(O1*log(T(i))+O2*T(i)+O3*(T(i))^2/2+O4*(T(i))^3/3+O5*(T(i))^4/4+O7)*8.3144;
% for LOCAL_MAX_TEMP
    else
CP(i)=(O8+O9*T(i)+O10*T(i)^2+O11*T(i)^3+O12*T(i)^4)*8.3144;
H(i)=(O8+O9*T(i)/2+O10*(T(i))^2/3+O11*(T(i))^3/4+O12*(T(i))^4/5+O13/T(i))*8.3144*T(i);
S(i)=(O8*log(T(i))+O9*T(i)+O10*(T(i))^2/2+O11*(T(i))^3/3+O12*(T(i))^4/4+O14)*8.3144;
    end
end
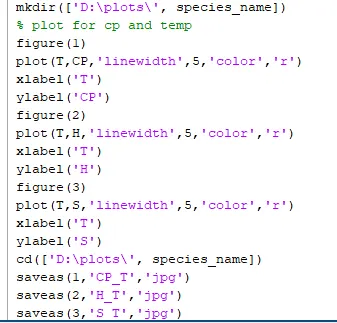
mkdir(['D:\plots\', species_name])
% plot for cp and temp
figure(1)
plot(T,CP,'linewidth',5,'color','r')
xlabel('T')
ylabel('CP')
figure(2)
plot(T,H,'linewidth',5,'color','r')
xlabel('T')
ylabel('H')
figure(3)
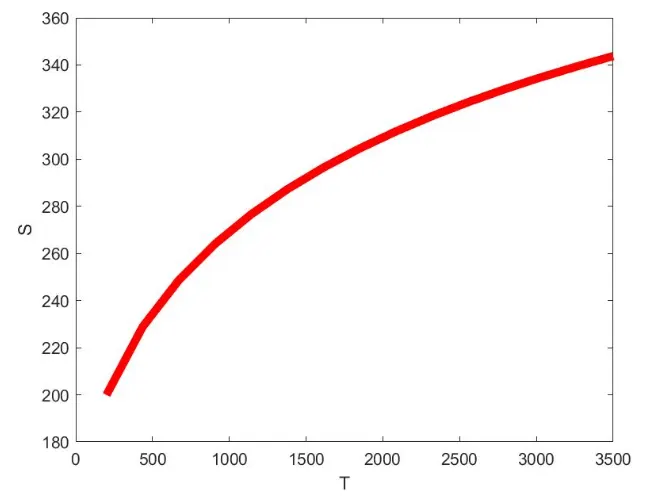
plot(T,S,'linewidth',5,'color','r')
xlabel('T')
ylabel('S')
cd(['D:\plots\', species_name])
saveas(1,'CP_T','jpg')
saveas(2,'H_T','jpg')
saveas(3,'S_T','jpg')
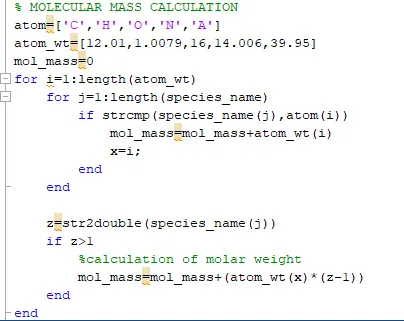
% MOLECULAR MASS CALCULATION
atom=['C','H','O','N','A']
atom_wt=[12.01,1.0079,16,14.006,39.95]
mol_mass=0
for i=1:length(atom_wt)
    for j=1:length(species_name)
        if strcmp(species_name(j),atom(i))
            mol_mass=mol_mass+atom_wt(i)
            x=i;
        end
    end

    z=str2double(species_name(j))
    if z>1
        %calculation of molar weight
        mol_mass=mol_mass+(atom_wt(x)*(z-1))
    end
end
% printing floating values of molecular mass
fprintf('molecular mass of %s is=%fn',species_name,mol_mass)

end