Week 4 - CHT Analysis on Exhaust port
AIM
To study the Conjugate Heat Transfer analysis method by performing four cylinder engine exhaust port simulation using ANSYS Fluent.
INTRODUCTION
The interaction between conduction within a solid body and the convection from the solid surface to fluid moving over the solid surface is a common phenomenon found in heat exchangers. The study of such phenomenon is important to design the parts in which such interactions takes place. For the accurate prediction of such heat transfer Conjugate Heat Transfer (CHT) analysis is used , which will simultaneously solve all the relevant solid and flow field heat transfer processes.
OBJECTIVE
- To calculate the wall/surface heat transfer coefficient on the internal solid surface.
- To show the velocity & temperature contours in appropriate areas.
- Validation of heat transfer coefficientpredictions from the simulations.
THEORY
The Conjugate Heat Transfer (CHT) analysis is the study of the heat transfer between a fluid-solid interface. In this method the thermal energy is exchanged between the interfaces. This method is useful in combining the heat transfer in fluids and heat transfer in solids. In case of fluids convection dominates where as in case of solids conduction dominates and hence it is necessary to combine these two heat transfer mechanisms to understand the heat transfer at the interface of these two.
CHT analysis used to get the analytical or numerical values of the heat transfer coefficient close to experimentally obtained values and for this purpose the boundary conditions are conjugated at the fluid-solid interface. Such coupling is necessary in the fluid-solid interfaces to obtain accurate values of temperature distribution and heat load on the solid surface.
Such CHT analysis are used in the sizing of heat exchangers , heat sinks in electronic devices , designing heaters & coolers , thermal treatment of materials , gas turbines , aerospace applications etc…
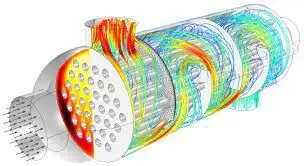
For example , heat exchange between a solid surface and a fluid flowing over it is governed by the conduction equations for the solid surface and that of fluid is governed by three dimensional Navier-Stokes equations. So in order to solve for the interface of the solid and fluid which are governed by two different equations the solutions has to be coupled.
The advantage of CHT analysis over conventional heat transfer analysis is that simultaneous solution of flow field of the fluid and temperature field of solid are carried out. Hence the CHT analysis gives accurate predictions in practical coupled heat transfer situations.
PROCEDURE
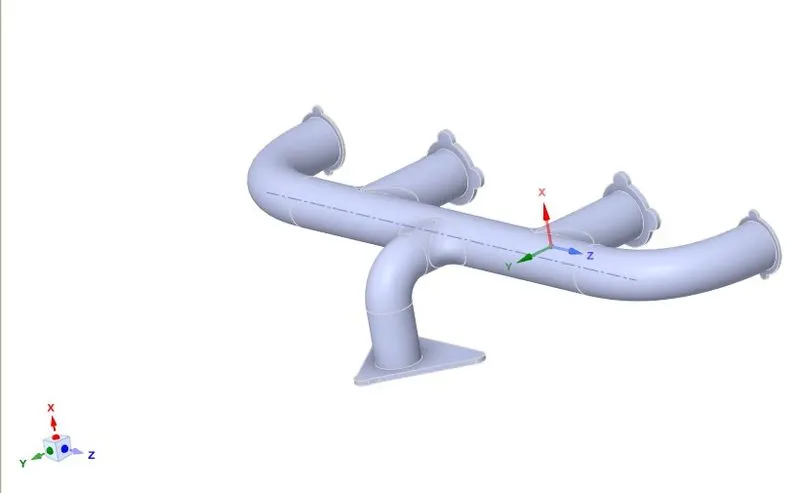
- To set up the geometry space claim software is used. The 3-D geometry created using this software is shown below ,
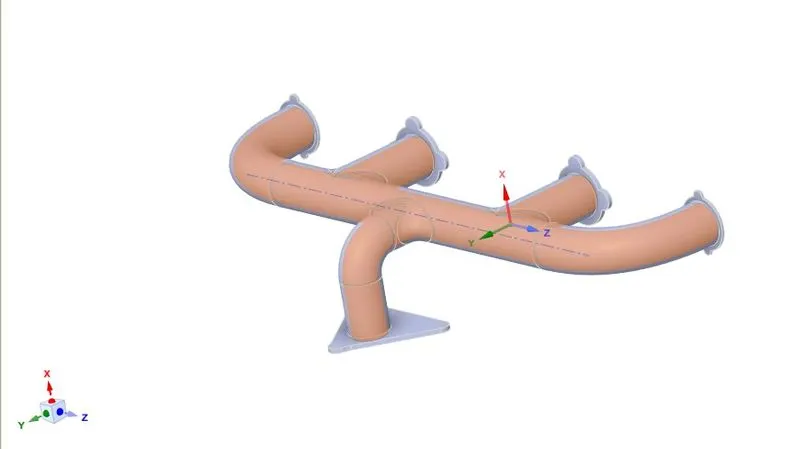
- Using the volume extract tool , a fluid body is created inside the solid body geometry as shown below,
- The share topology tool has been used to get conformal mesh.
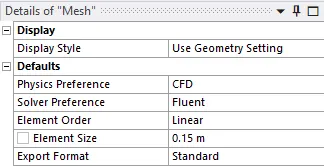
- To mesh this geometry ANSYS meshing software is used.
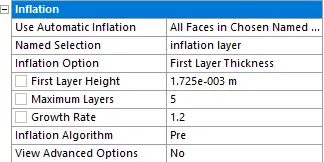
- An inflation layer is created at the interface between fluid geometry and solid geometry. The first layer thickness is calculated for a `y^+` value of`30`. Also a refinement for the solid geometry is done using body sizing method with an element size of `10`mm.
Meshed geometry,
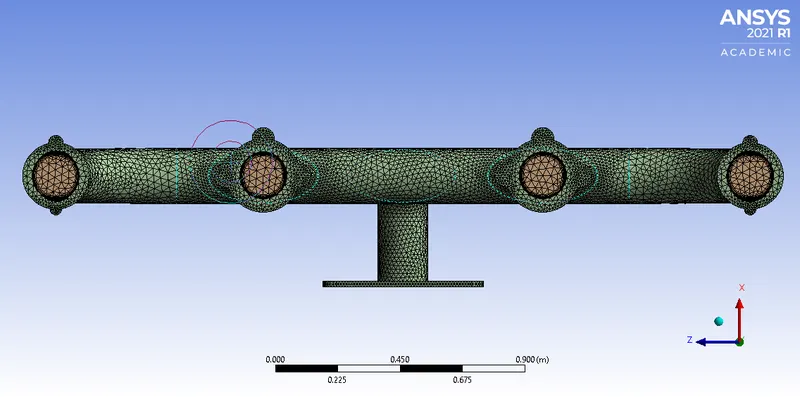

Inflation layer,

SIMULATION SET-UP
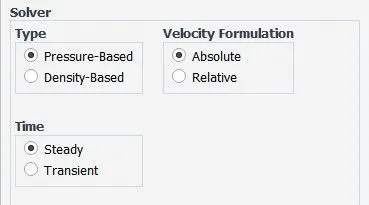
- Pressure based steady state solver is used and the solution scheme is Coupled pressure-velocity coupling.
- Material used for the fluid is default air and for the solid is aluminium.
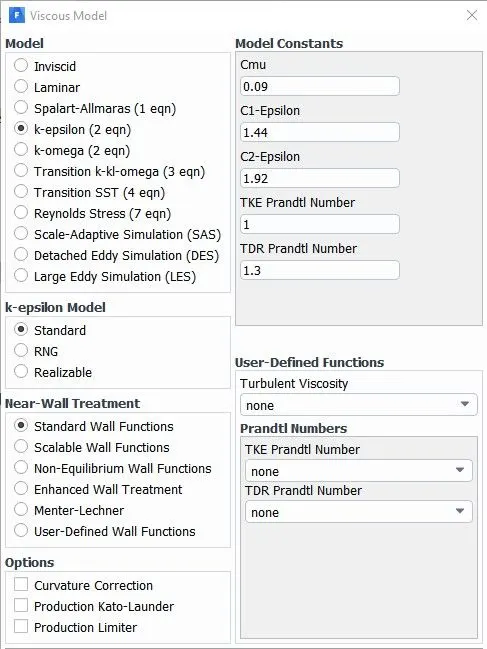
- Turbulence model used is standard k-epsilon with standard wall functions.
- Energy equations has been used.
- Boundary conditions are specified with inlet velocity as 5m/s and temperature of 700K.
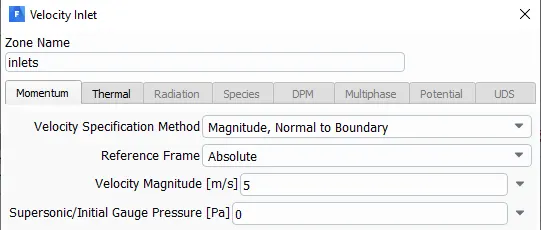

- Outlet boundary condition is specified as 1atm.
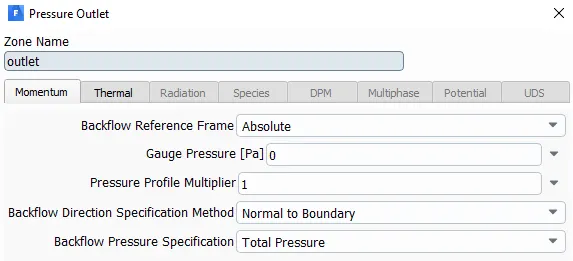
- The heat transfer coefficient for the outer wall is given as 20W/(m^2K).
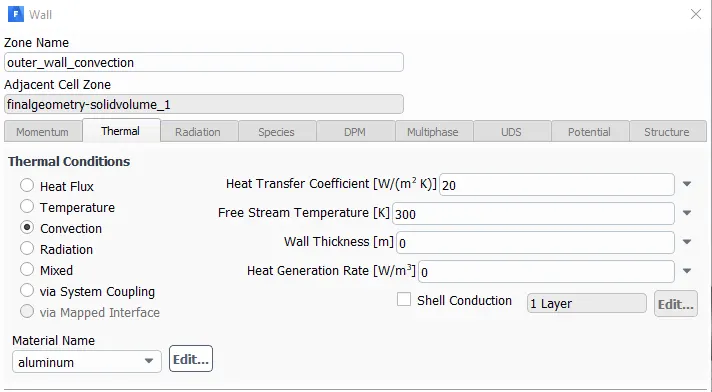
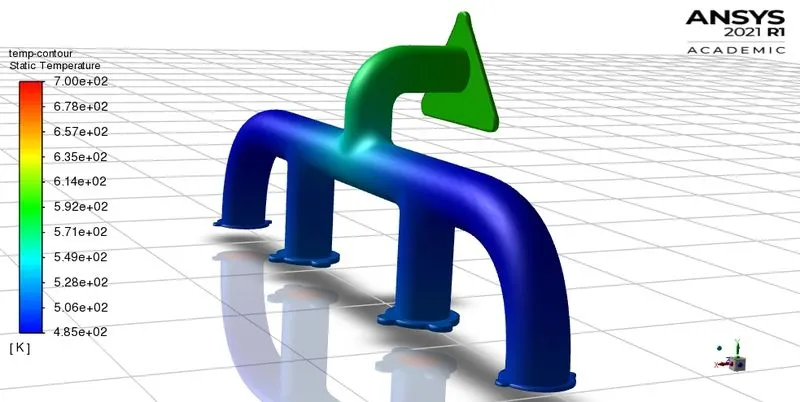
- Contour plot for surface temperature has been created.
RESULTS
- Convergence plot,
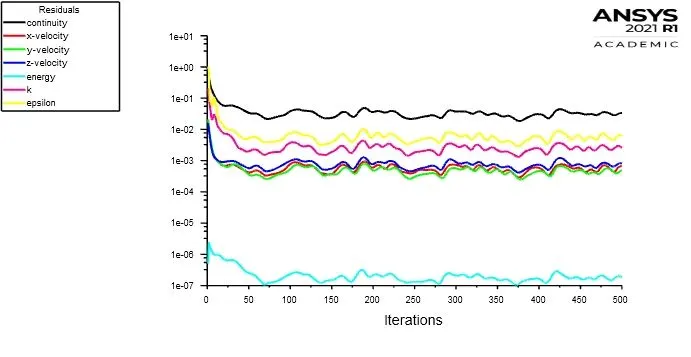
- Static surface temperature,
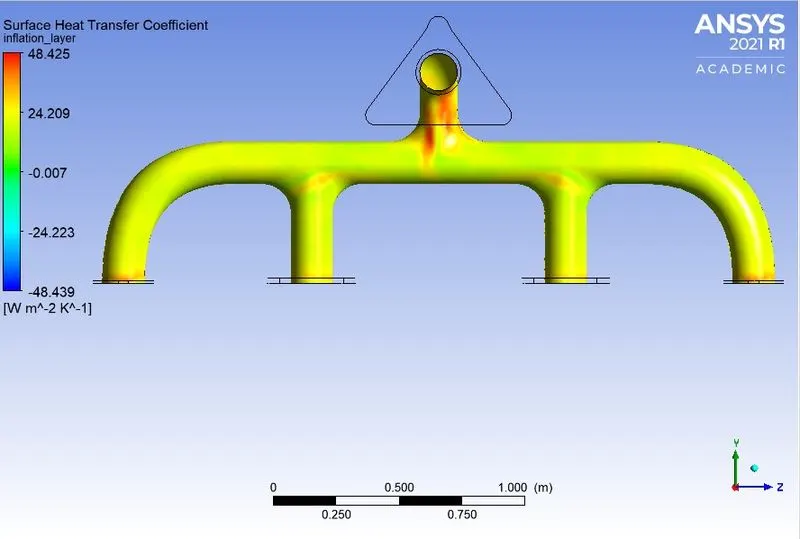
- Surface heat transfer coefficient,
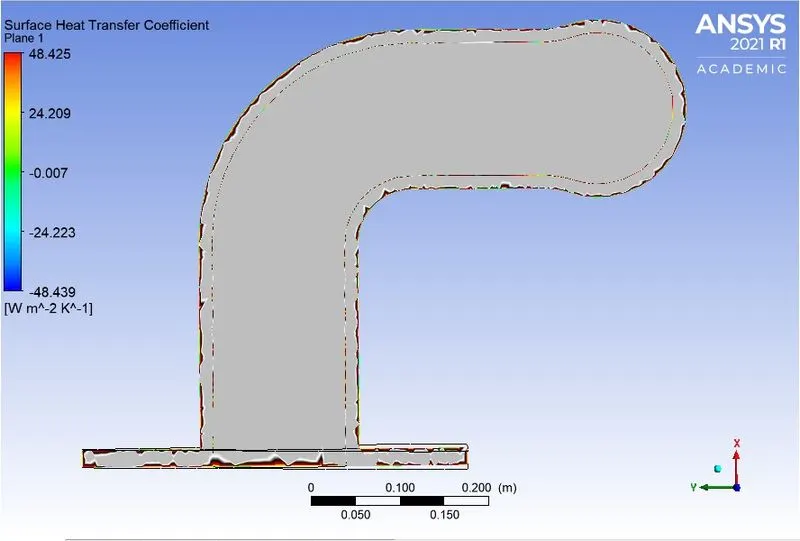
- Surface heat transfer coefficient at the outlet port,
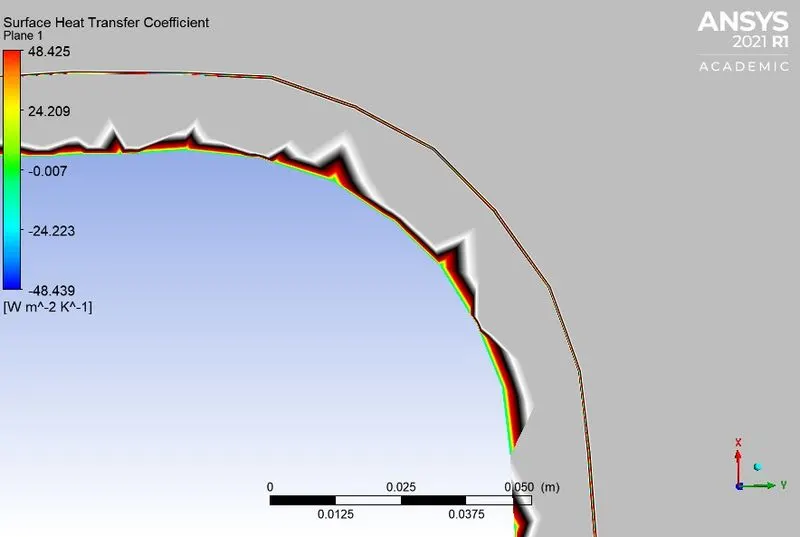
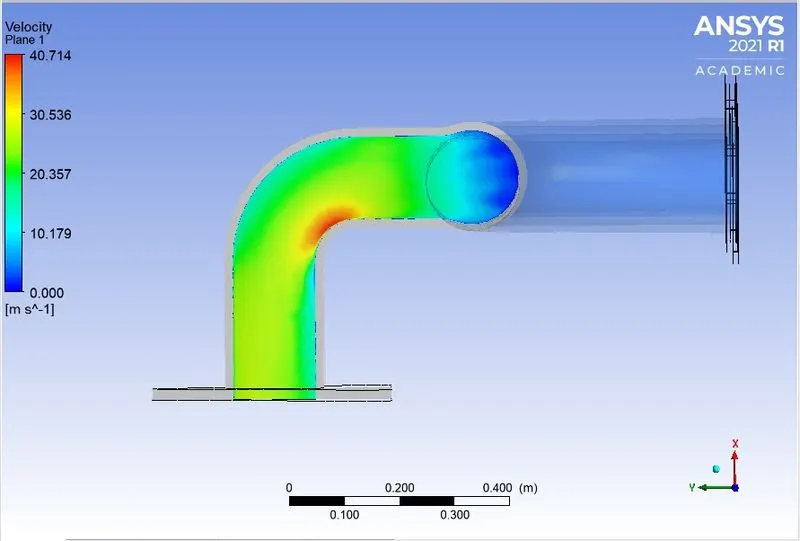
- Velocity plot at regions of maximum heat transfer coefficient,
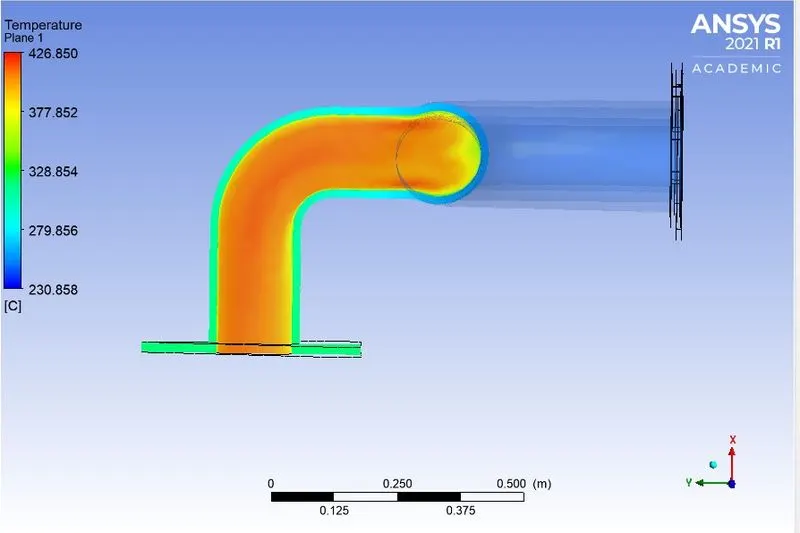
- Temperature plot,
VALIDATION OF HTC
The Heat Transfer Coefficient (HTC) is validated by using the Nusselt number equation at the corresponding Reynolds number.
The average Nusselt number , `Nu = 0.037*Re^0.8*Pr^0.43`
Where , Reynolds number is in the range `5*10^7<=Re<=10^7` and Prandtl number is in the range `0.6<=Pr<=60`.
The general equation for Nusselt number , `Nu = (h*L_c)/k`
From this equation we get , `h = (Nu*k)/L_c`
Where , ‘h’ is the heat transfer coefficient , `L_c` is the characteristic length and ‘k’ is the thermal conductivity of the fluid.
On solving these equations the predicted HTC values can be validated.
The accuracy of the prediction depends on various factors like complexity of the geometry , mesh refinement , solvers used and turbulent model used.
Another important factor which affects the accuracy of prediction is the temperature value used to describe the fluid. This reference temperature value chosen will effect the results of convective heat transfer coefficient predictions.
CONCLUSION
The simulation of fluid flow through an exhaust port of an inline four cylinder engine has been done successfully using ANSYS software and the Heat Transfer Coefficient (HTC) at the surface has been plotted.
The turbulence model used is standard k-epsilon with standard wall functions. The `y^+` value selected for this model is 30 as it will be in the turbulent region at this value. And hence the first layer thickness is also calculated for this `y^+` value.
From the HTC plot , the maximum value is seen at the bend of the outlet port. The reason for this is the high velocity at these regions. These high velocity region can be seen in the velocity plot at that region. The temperature is also the highest at that region.