Week-4 Challenge WOT Condition Part-2
Question 1:
Aim:The difference between mapped and dynamic model of engine, motor and generator.
Mapped model:
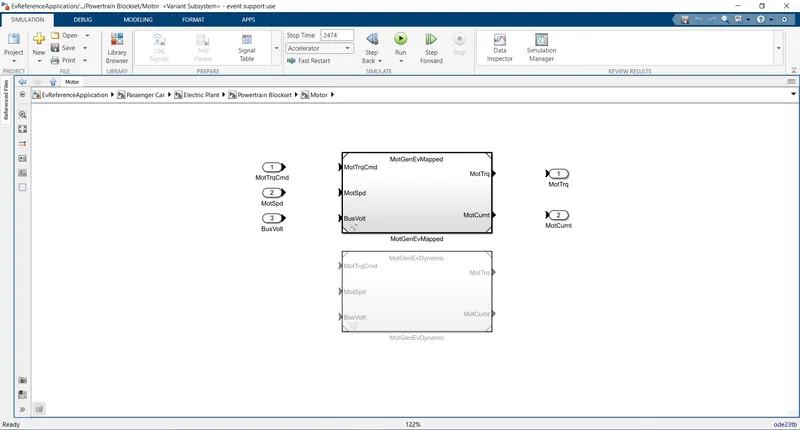
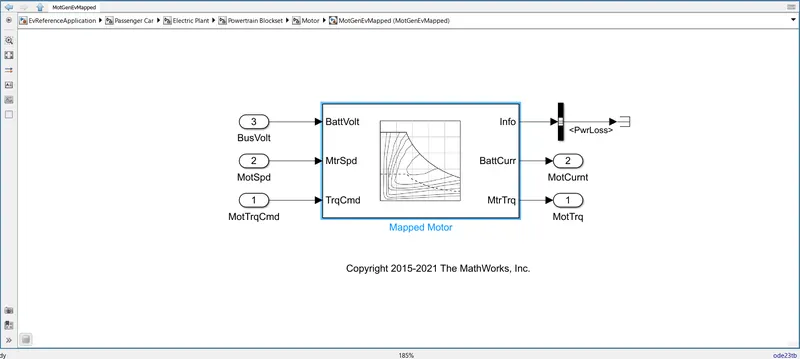
The Mapped motor block implements a mapped motor and drive electronics operating in torque-control mode. Specify electrical torque range with a torque-speed envelope or maximum motor power and torque. Output torque tracks a torque reference demand and includes a motor and drive response time constant. Specify electrical losses as a single operating point that estimates loss across the operating range, measured loss, or measured efficiency.The input of the system are the motor torque, speed and bus voltage.
Mapped engines represent macro engine behaviour as a set of lookup tables(brake torque,fuel flow,air masflow,exhaust temperature,efficiency and emissions) as functions of commanded load and measured engine speed.Mapped engine models are suitable for analysis and design activities that do not require enigne subsystem dynamic characteristics,for example in egine and transmission powertrain matching analysis for fuel economy,emissions and performance trade-offs.
Dynamic model:
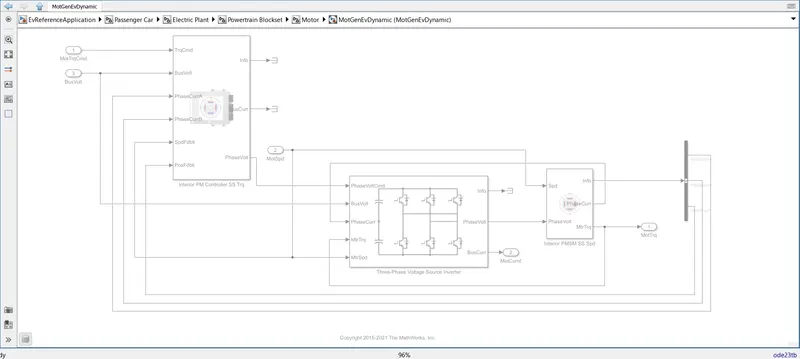
Dynamic engine decompose engine behaviors into individual component models that account for engine dynamics, most notably intake airflow and turbo charger dynamics. Dynamics engine models are suitable for desiging control, estimator and diagnostic, algorthims that depend on dynamic subsysytem states, for example in closed loop AFR (air fuel ratio) control algorithm development.
The mapped or dynamic engines are selected by following below procedures:
1.Open the EV model in simulink.
2.Select passenger car block.
3.Go to electric plant block and select motor block
4.Inside the motor block the mapped or dynamic model can be selected.
Question 2:
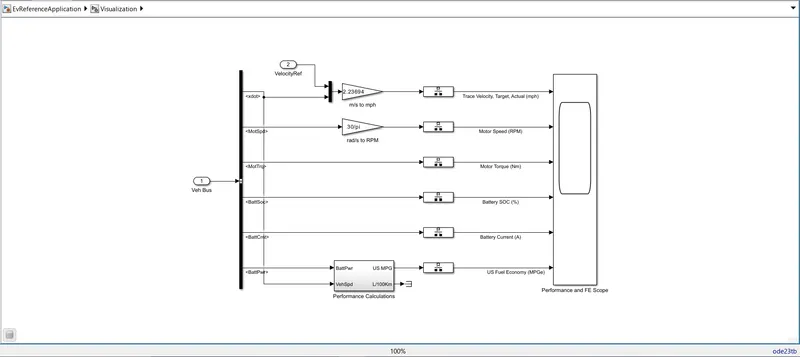
According to the US standard, the distance per unit volume of fuel is expressed in miles per gallon (mpg). Energy consumption is an integration of the power output at the battery terminals.For a conventional gasoline vehicle,the fuel efficiency is calculated via miles per gallon (mpg).However fuel efficiency for hybrid electric vehicles is calculated via miles per gallon equivalent(mpge).mpg is the number of miles your car can drive per gallon of gas.
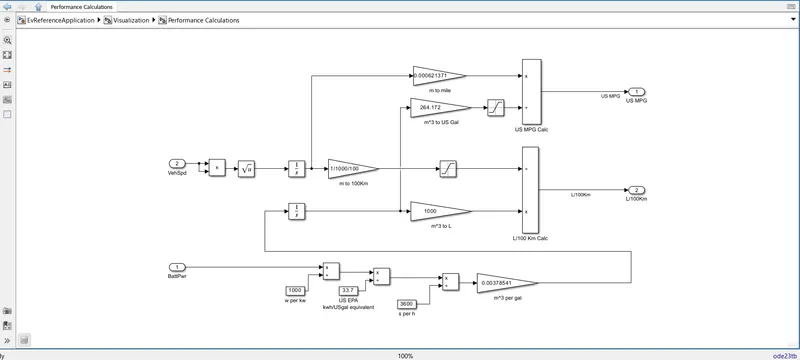
The factors to be considered are
a)vehicle speed
b)Battery Power
c)fuel volume flow.
The vehicle speed is multiplied by time and then integrated to get the range of distance.This value is multiplied by factor 0.0000621371 to convert into distance, mile. Both the battery cell fuel and Fuel volume flow are then integrated. The total volume value is multiplied by factor 264.172 to convert the volume from m3 to US Gallon. Then the distance is divided by total Fuel volume flow to get miles per Gallon, US MPG.It has been found that 1 gallon of gas has the same amount of energy as 33.7 kwh of electricity.So in this way the calculation of the model is done.
Question 3:
Aim: To run the HEV ReferenceApplication with WOT drive cycle and change the grade and wind velocity in the environment block and observe it's characteristics.
Steps:
1. Open the HEV model by coping the command from the powertrain block set.
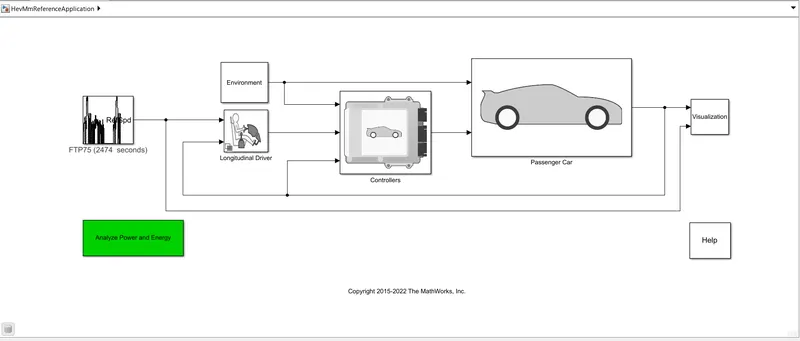
2. Change the drive cycle to WOT as shown below
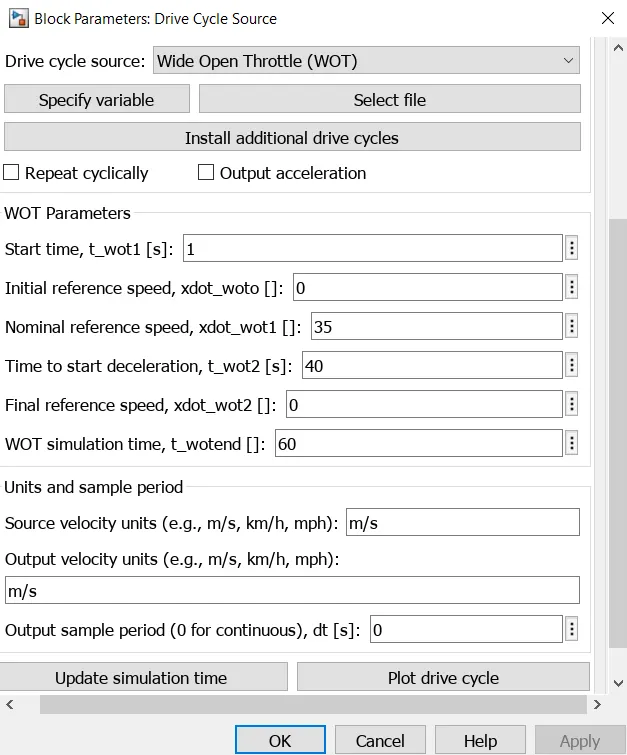
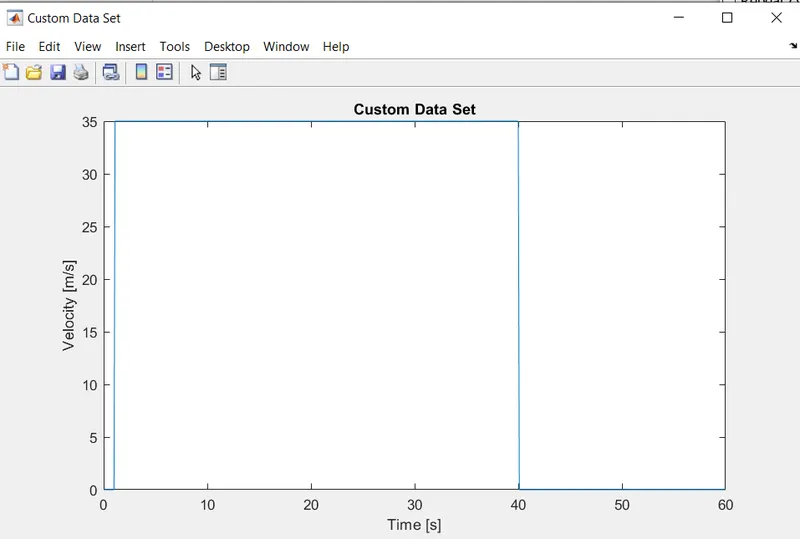
This is the new drive cycle given to the system in here the speed is changed to 35 m/s and can run to a time period of 60sec.
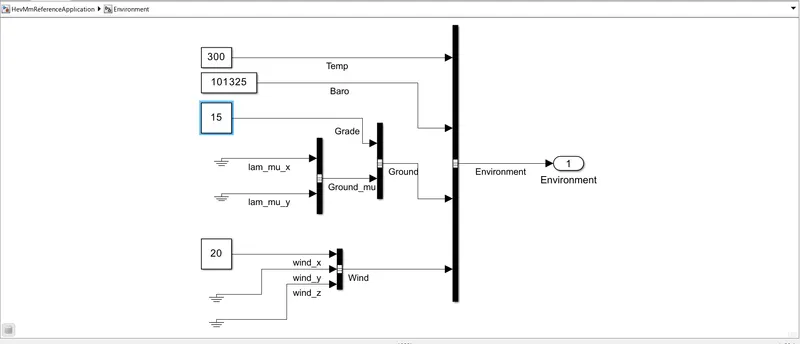
3.Move to the environment block and change the value of grade to 15 and the wind to be 20
Results:
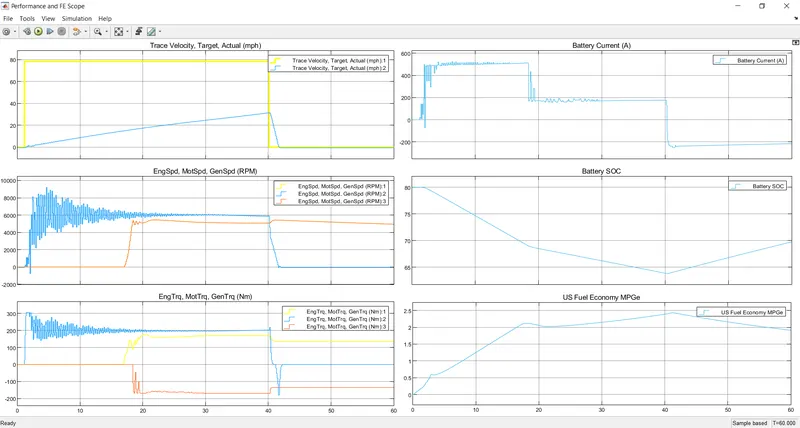
Graph 1: Trace velocity,target,actual(mph):
high velocity achieved by car= 30 mph.
time taken to accelerate = 40 sec.
time taken to deaccelerate = 3 sec.
Graph 2: Engine Speed, motor speed, generator speed(rpm):
high motor speed=5925 rpm.
high engine speed= 5435 rpm.
high generator speed= 5435 rpm
graph 3:motor torque, engine torque, generator torque (Nm):
max motor torque = 200 Nm.
max engine torque = 174 Nm.
max generator torque = 170 Nm
graph 4:battery current:
The battery supply current is at 178 ampere when full throttle(max speed) is applied by the user and it reduces - 200 amp toduring deaccelaration of the vehicle.
graph 5:battery soc:
the battery soc falls from 80% to 63% during accelaration of vehicle and it increases to 63% to 70% during de-accelaration as the bttery gets charged due to regenerative braking.
graph 6:fuel economy:
max fuel economy achieved = 2.4.
Question 4:
Aim: To compare the simulated results of hybrid and pure electric powertrain by keeping all other parameters same as above question.
Hev results:
9
EV results:
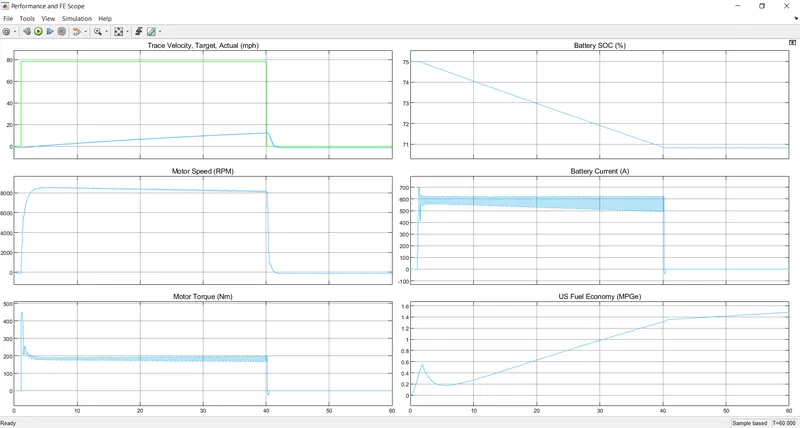
Observation:
1) In graph 1 the HEV(30mph) had reached high speed than the EV(15mph) in the given 40 sec acceleration period.
2) The motor speed of EV(8000 rpm) is more than the HEV(5925 rpm) in graph 2 and it is more fluctating in the HEV
3) Motor torque is almost same fo the both HEV and EV ( around 200Nm).
4) The battery SOC is maintained well in the case of EV (75 to 71 %) than in HEV( 80 to 63%)
5) The fuel economy is good in a pure electric vehicle than HEV.