Week-4 Challenge WOT Condition Part-2
1. What is the difference between the mapped and dynamic models of the engine, motor, and generator? How can you change the model type?
Ans: powertrain block set provides two types of combustion engine models: mapped and dynamic.
Mapped engine:
Mapped models and dynamic models are two approaches to modeling an engine, motor, or generator.
Mapped models are based on a set of fixed maps that relate the input and output variables of the system. These maps are generated from experimental data or simulations and can be used to predict the system behavior under different operating conditions. Mapped models are computationally efficient but may not capture the dynamic response of the system accurately.
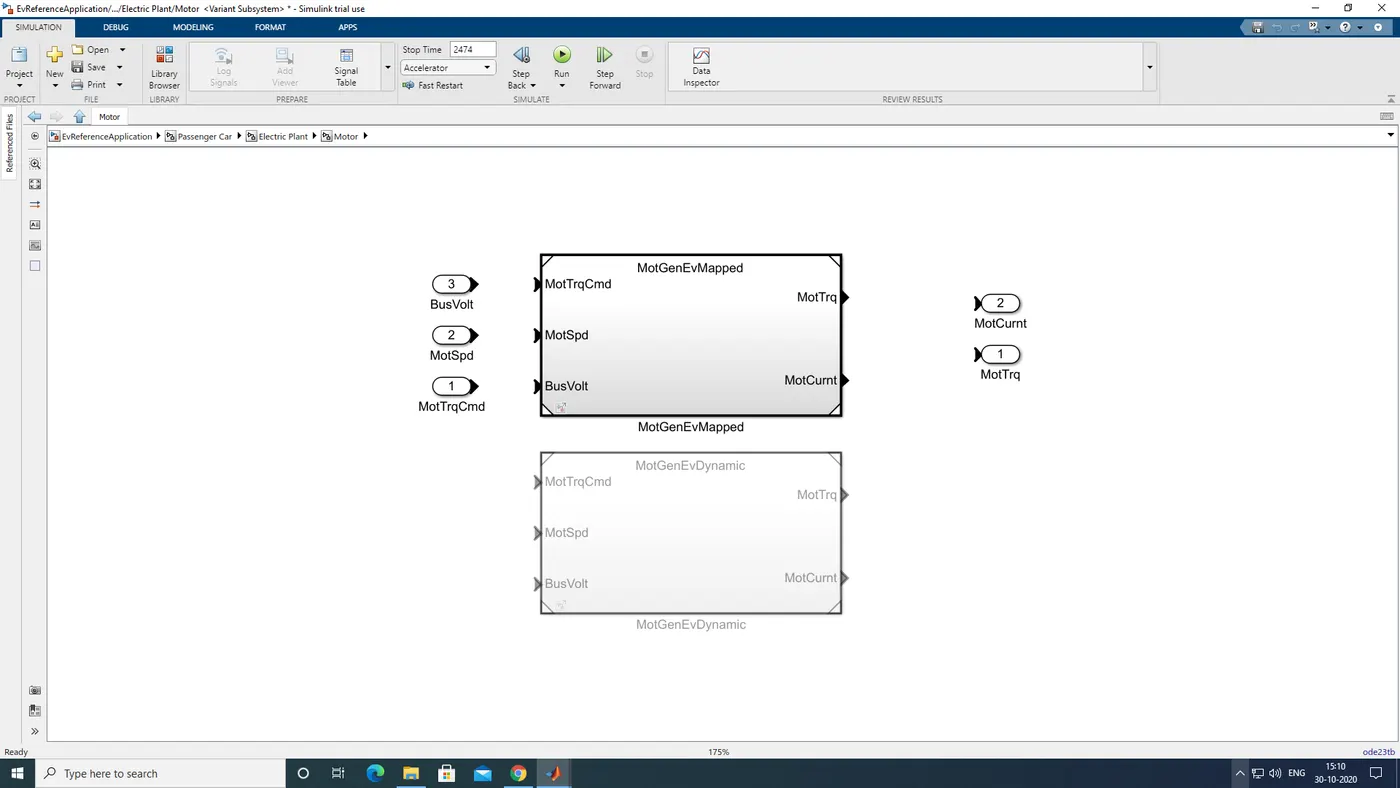
1. Mapped engines represent macro engine behavior as a set of lookup tables(brake torque, fuel flow, air mass flow, exhaust temperature, efficiency, and emissions) as functions of commanded load and measured engine speed.
2. Mapped engine models are suitable for analysis and design activities that do not require engine subsystem dynamic characteristics, for example in engine and transmission powertrain matching analysis for fuel economy, emissions and performance trade-offs.
Dynamic engine:
Dynamic models, on the other hand, are based on the physical principles that govern the system's behavior. These models are more complex and computationally intensive but can provide a more accurate representation of the system dynamics. Dynamic models can capture the transient behavior of the system and can be used to study the effect of different control strategies.
To change the model type, you need to modify the equations or maps used to describe the system behavior. For example, to switch from a mapped model to a dynamic model, you need to replace the fixed maps with differential equations that describe the system dynamics.
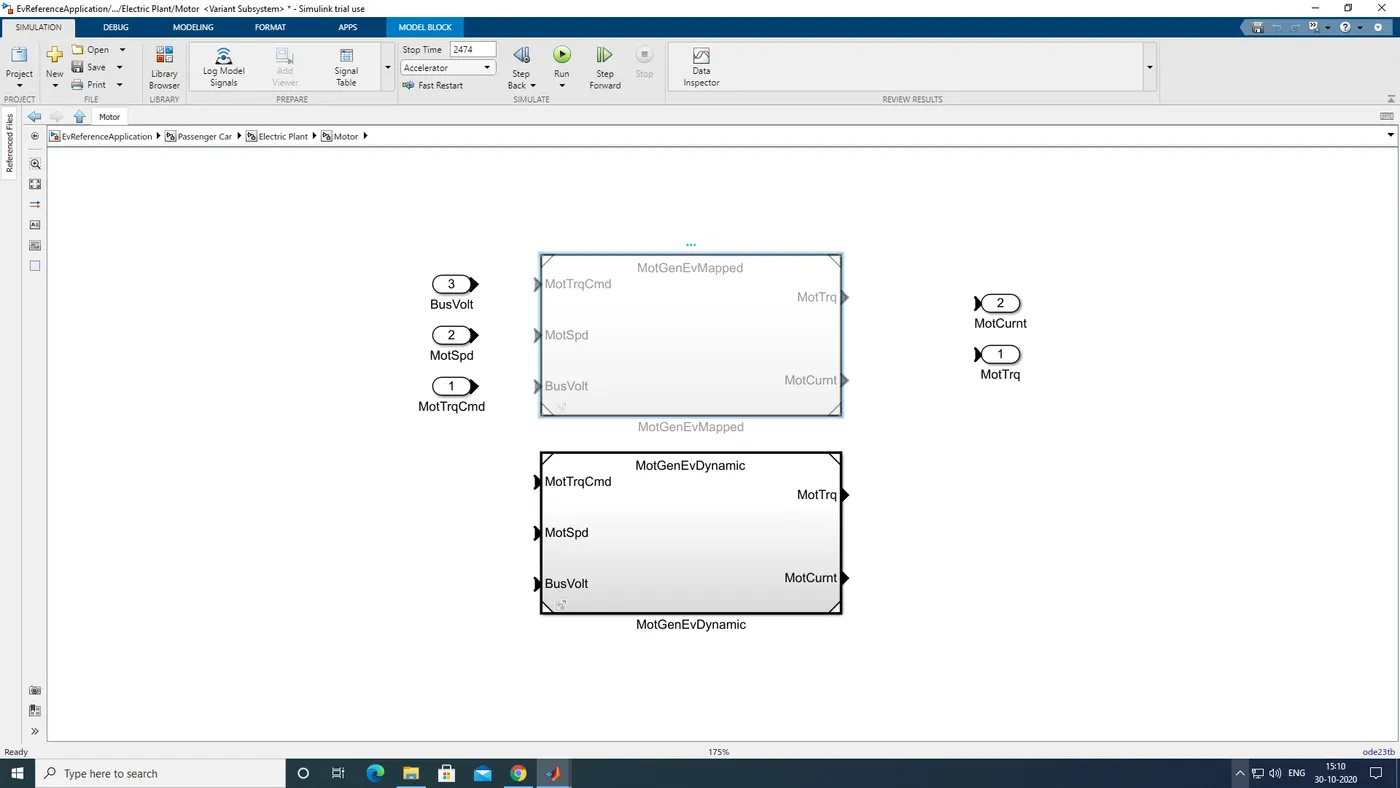
1. Dynamic engines decompose engine behavior into individual component models that account for engine dynamics, most notably intake airflow and turbocharger dynamics.
2. Dynamics engine models are suitable for designing control, estimator, and diagnostic, algorithms that depend on dynamic subsystem states, for example in closed loop AFR (air-fuel ratio) control algorithm development.
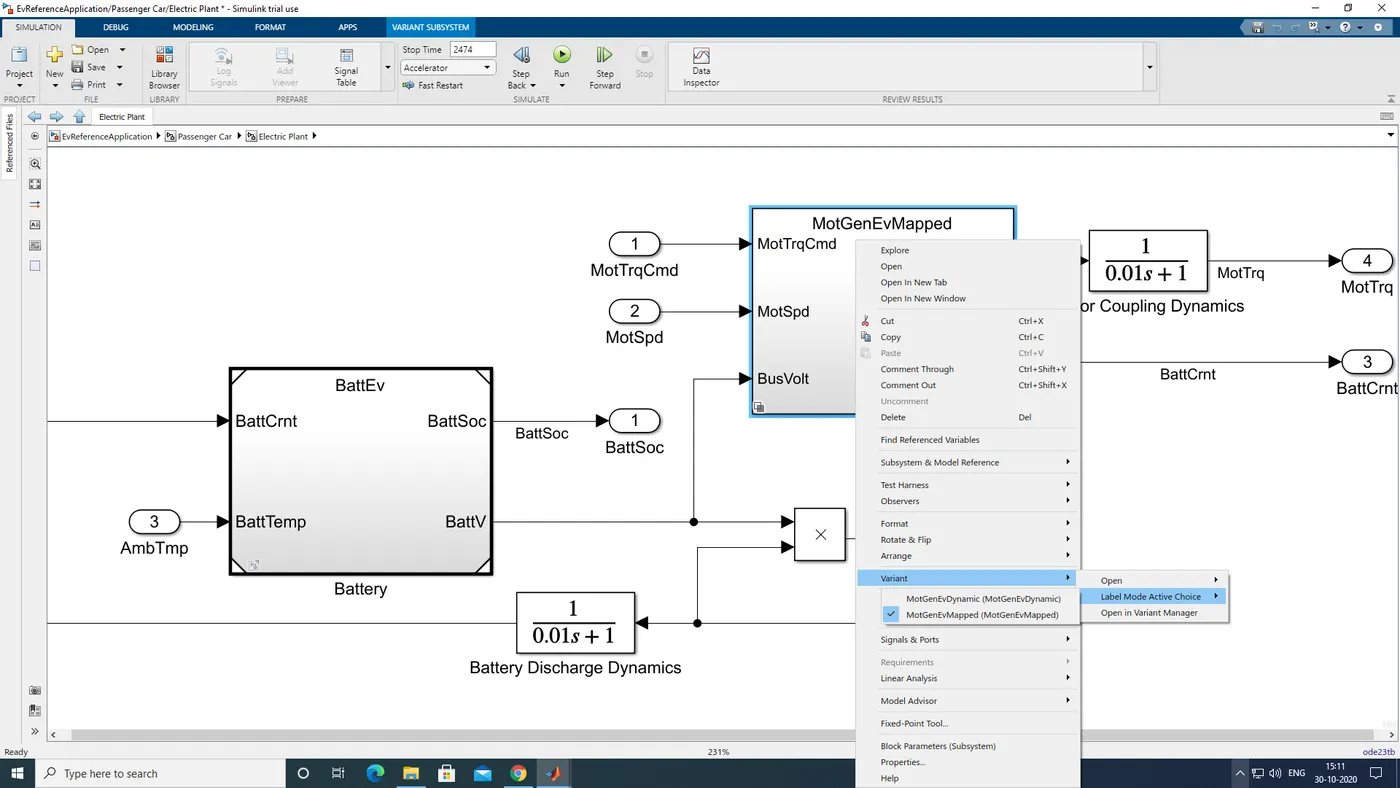
We can switch between mapped and dynamic engines by following below procedures:
1.oepn the ev model in simulink.
2. Enter the passenger car block by double-clicking it.
3. Then go to the electric plant block.
4. Inside the motor block right click to find the variant option.
2.How does the model calculate miles per gallon? Which factors are considered to model fuel flow?
The miles per gallon (MPG) of a vehicle is calculated by dividing the distance traveled by the amount of fuel consumed. The fuel flow rate is typically modeled as a function of the engine speed and load, air-fuel ratio, and other factors that affect the combustion process. The fuel consumption can be estimated using either a physical model or an empirical model that relates the fuel flow rate to the engine operating conditions.
Ans: Miles per gallon (mpg) & miles per gallon equivalent (mpg):
for a conventional gasoline vehicle, the fuel efficiency is calculated via miles per gallon (mpg). however fuel efficiency for hybrid electric vehicles is calculated via miles per gallon equivalent(pge).mpg is the number of miles your car can drive per gallon of gas. figuring out an mpg rating is a little more complicated. since engines that can use an alternative source of fuel cant be measured by liquid gallons of fuel,the mpg rating is calculated by figuring out the number of miles a vehicle can go using the same energy content as gallon of gas.the epa calculated that 33.7 kilowatt hours of electriccity is equivalent to one gallon of gas.
We should go inside ev reference block that is performance calculations:
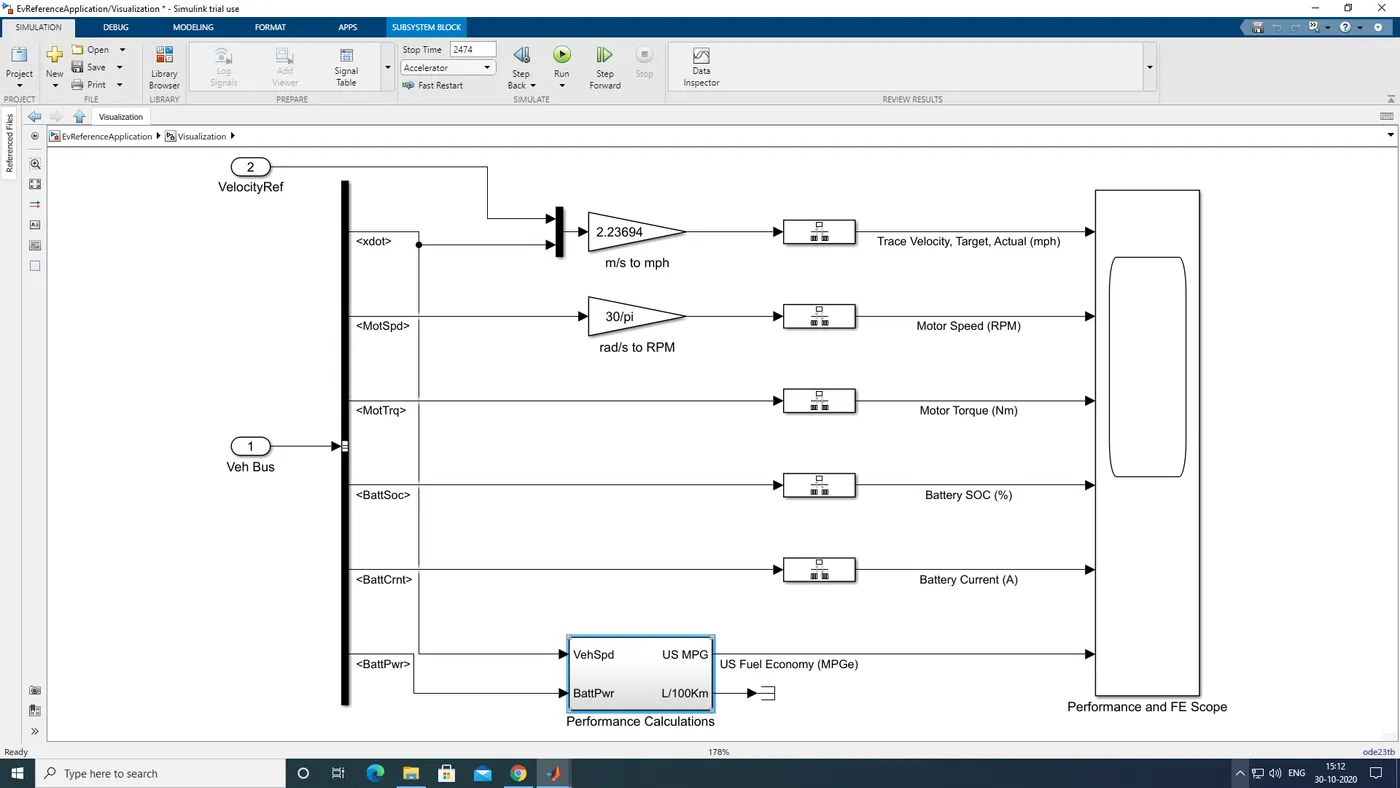
inside this block will get actual mpg calculations:
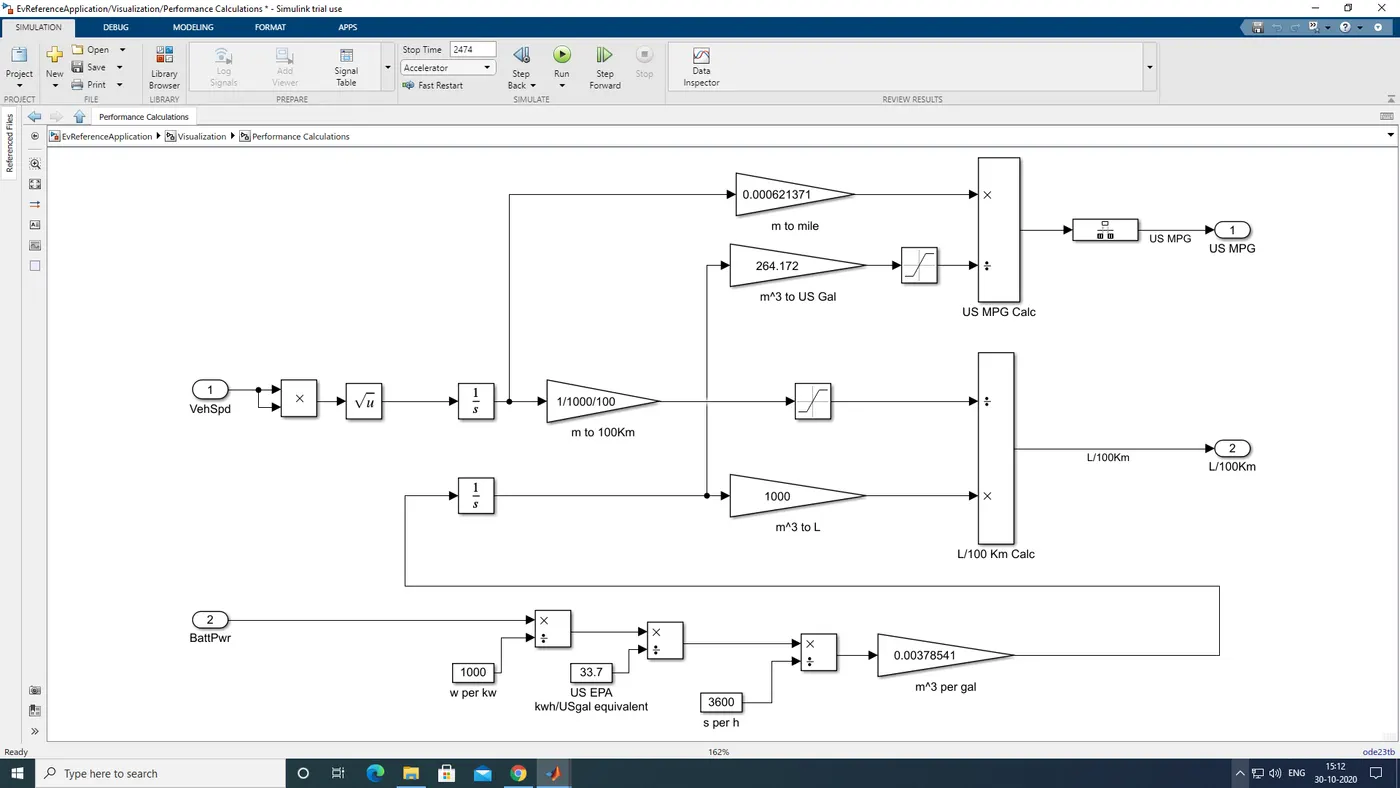
Here,three different inputs are taken into considerations:
1.vehicle speed.
2.fuel flow.
3.battery power.
The vehicle speed inputs is in m/s which is converted into miles by multiplying with 0.000621371.
similarly the kilogram of fuel is converted into cubic meter by multiplying by1/(1000*0.739)
this cubic meter value is then converted into gallons by multiplying it with 264.172.the mile value and gallon value is used to find mpg of the vehicle.
now the battery value is initially converted from watts to kwh by dividing with 1000 and then to gallon equivalent by again dividing it with 33.7(sincw 33.7 kwh=1 gallon)
then divide the value by 3600 to get in per seconds and multiply by 0.00378541nto get the value in cubic meter per gallons.
3.Run the HEV ReferenceApplication with WOT drive cycle. Change the grade and wind velocity in the environment block. Comment on the results.
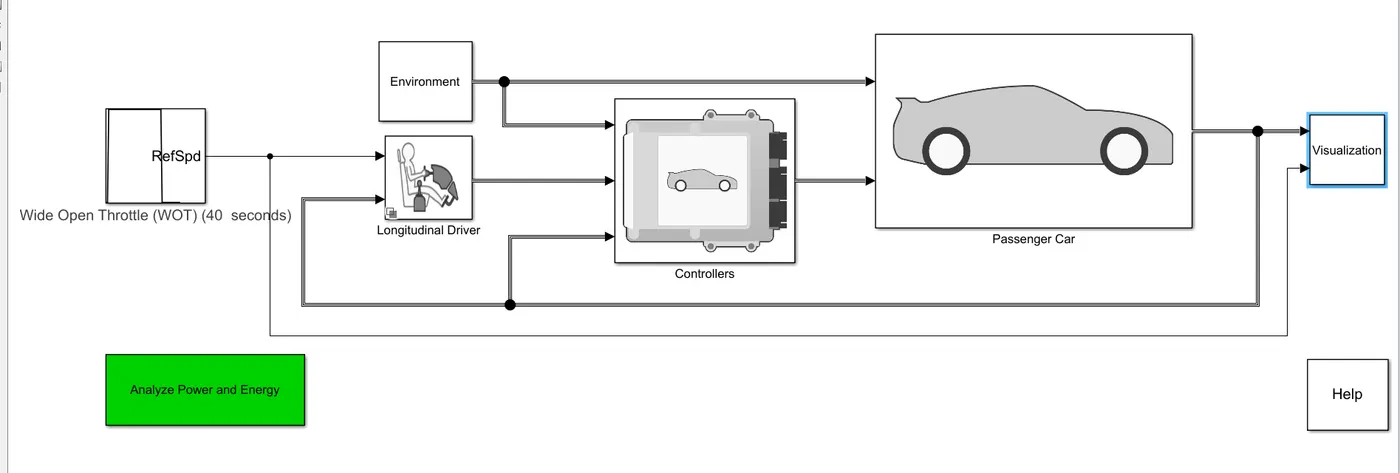
here we have changed drive cycle to wot with a sample time 40 seconds.
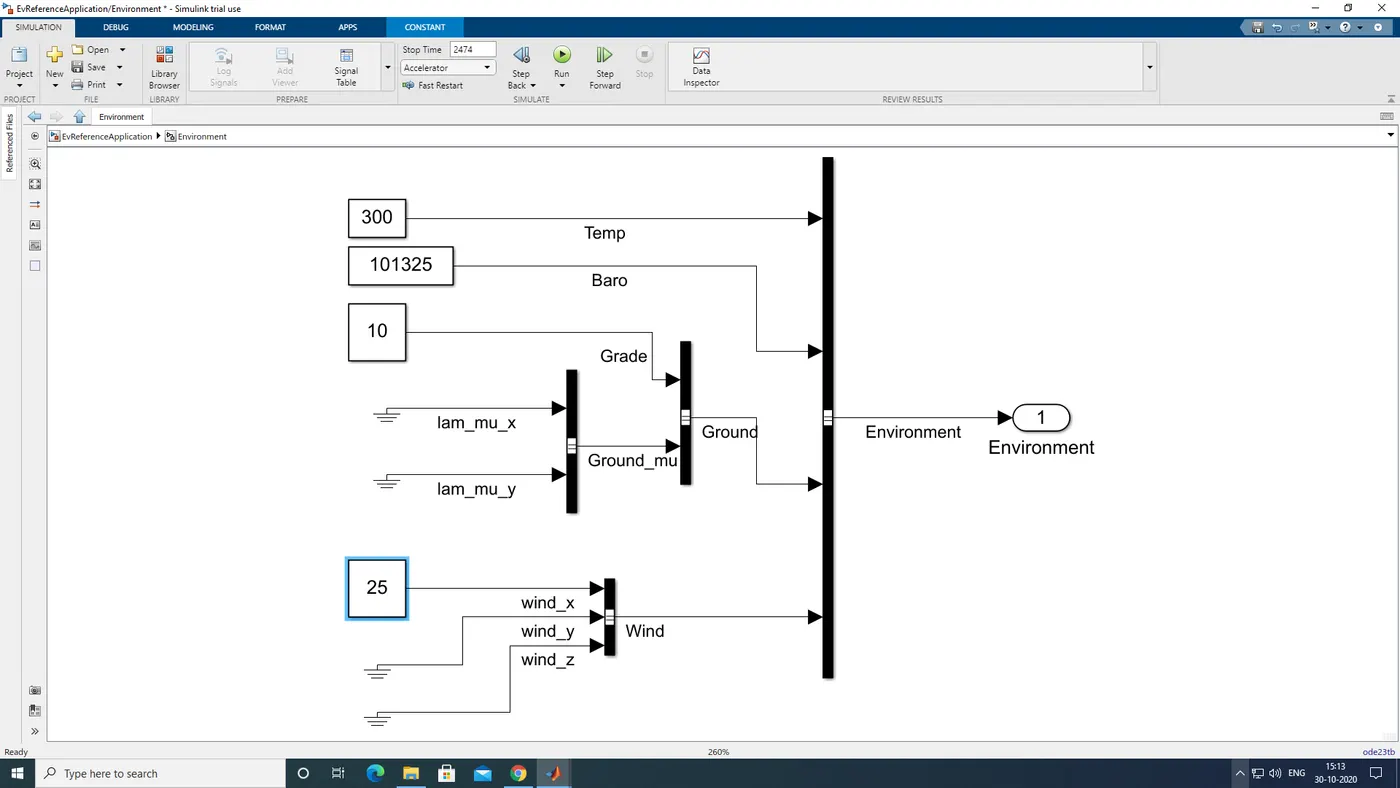
we have also altered environment block and changed wind speed to 25 m/s & grade to 10.
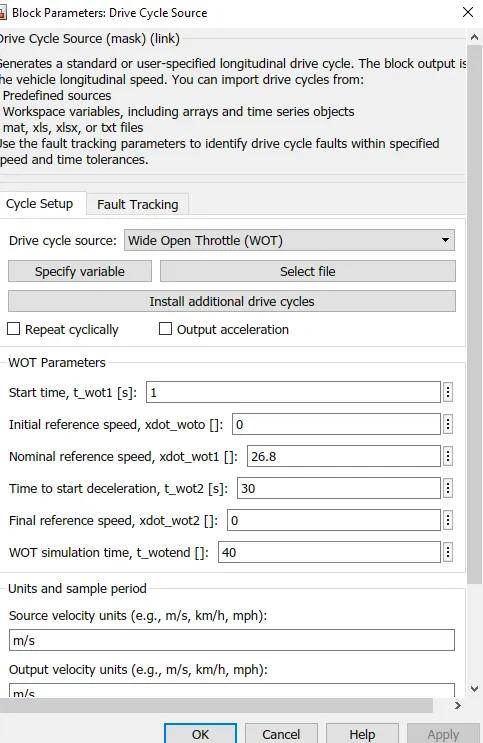
environment block:
Results:
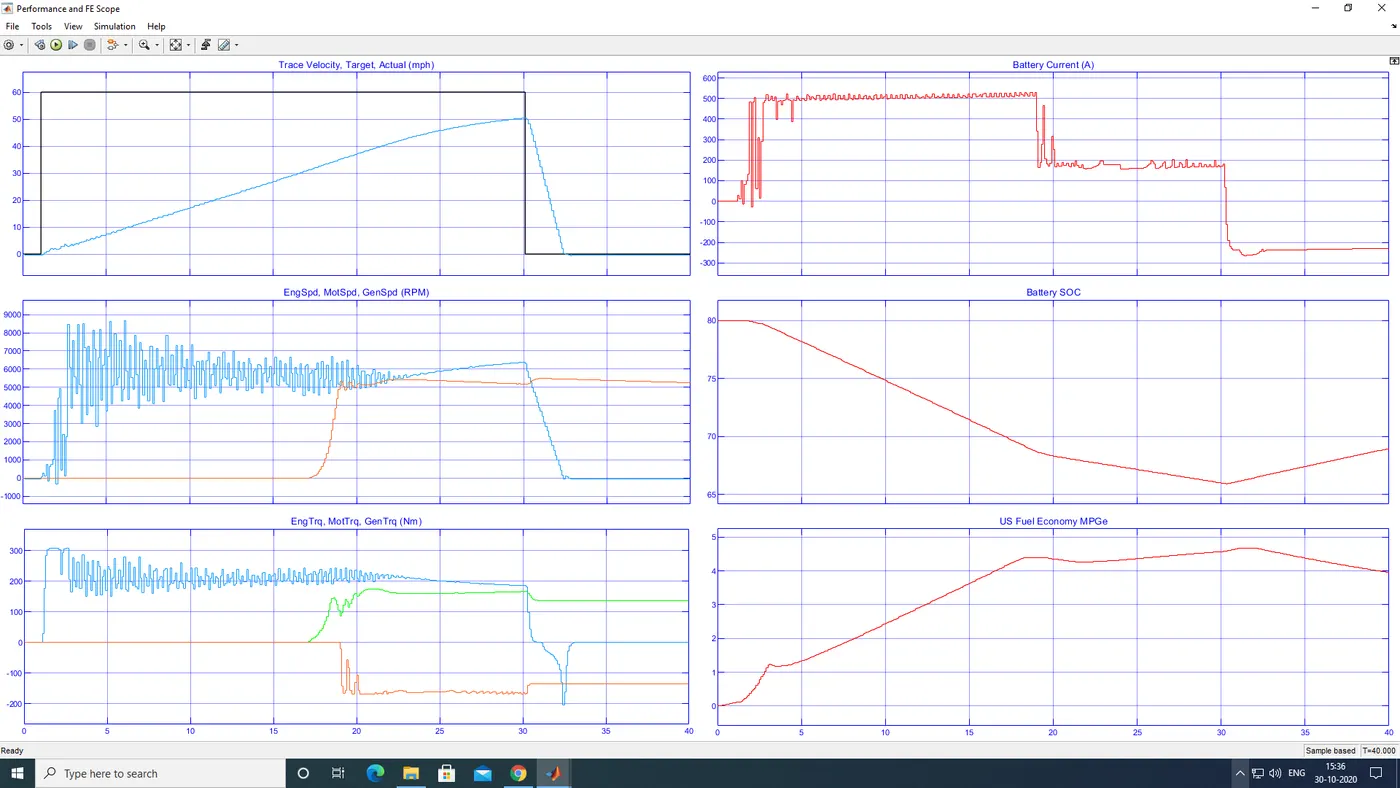
Conclusion:
plot 1:trace velocity,target,actual:
top velocity achieved =50.1 mph.
time taken to accelerate = 29.034 sec.
time taken to deaccelerate = 2.471 sec.
plot 2: motor&engine rpm:
top motor rpm=5712 rpm.
top engine rpm = 5451 rpm.
plot 3:motor& engine torque:
maximum motor torque = 306.6 N-m.
maximum engine torque = 174.7 N-m.
plot 4:battery current:
the battery supply current is at its maximum value of 167 ampere when full throttle is applied by the user it reduces drastically to the value of negative 150 during deaccelaration of the vehicle.
plot 5:battery soc:
the battery soc will falls from 80 to 65 % during accelaration of vehicle and it increases slightly to 65 to 70 % during de accelaration due to regenerative braking.
plot 6:fuel economy:
maximum fuel economy achieved = 4.675 .
4. keeping all the parameters same,compare the simulated results of pure and hybird electric powertrains.
Ans:
simulated results of hev:
simulated results of ev:
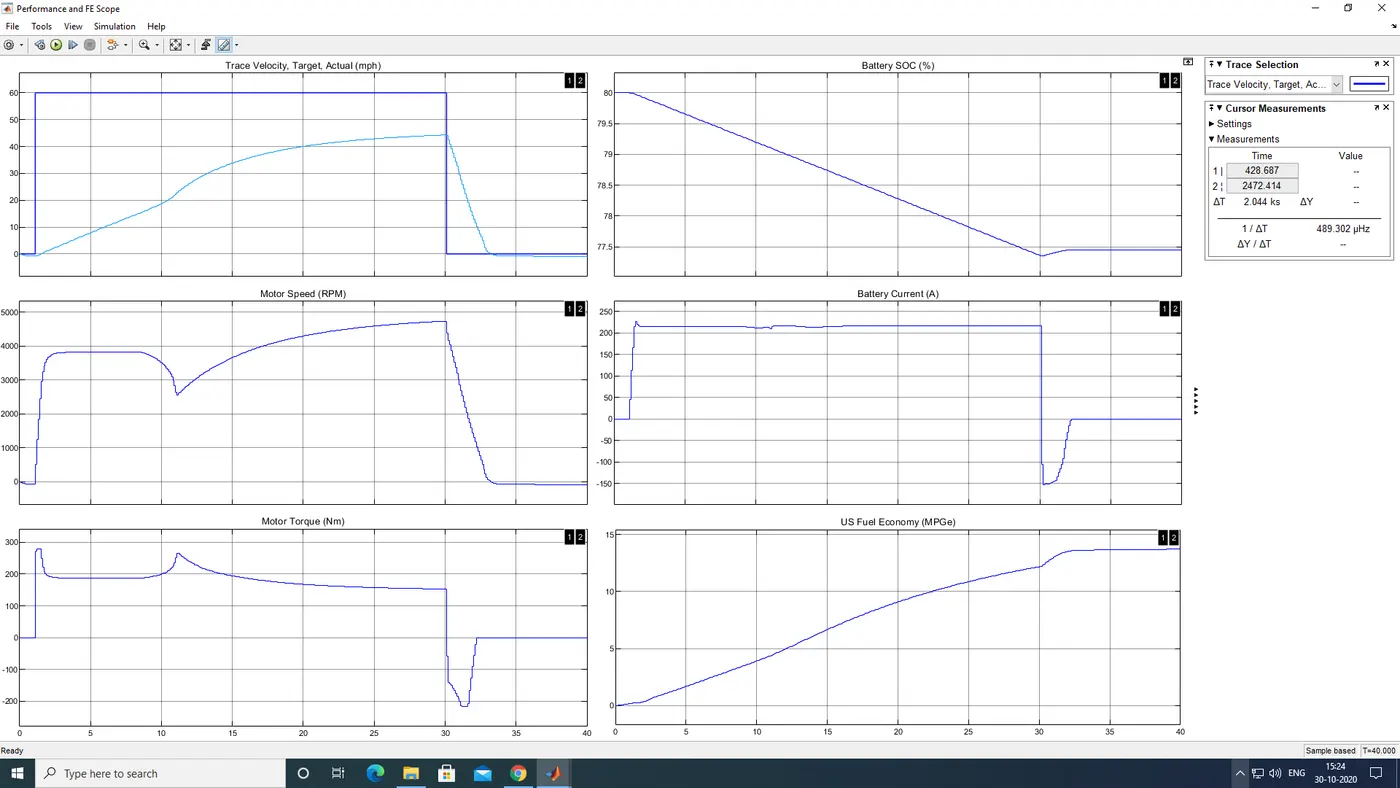
Conclusion:
1.The top speed is achieved by hybrid electric vehicle is more than that of EV.
2.The battery current capacity of pure EV is much higher compared to that of HEV since in EV battery is the only driving unit.
3.Higher fuel economy is achieved in case of pure EV.