Week-4 Challenge WOT Condition Part-2
1. ANSWER
Mapped model
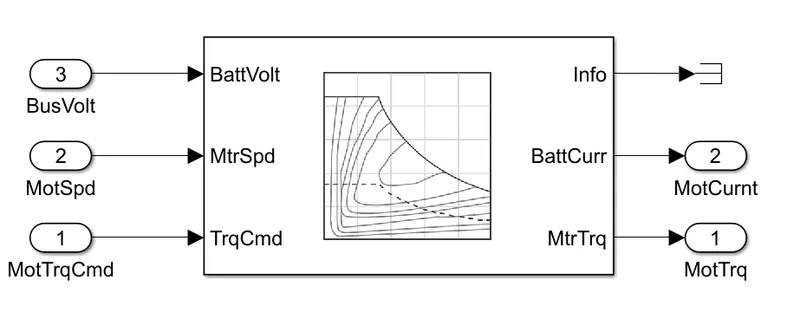
This type of model uses a set of steady-state lookup tables to characterize engine,motor and generator performance. The tables provide complete engine ,motor and generator characteristics. For example for an engine, actual torque, fuel flow rate, and engine-out exhaust emissions. It is used when we have experimental data already available.
Dynamic model
This type of model is used when time dependent simulations are performed and results are required. It is used when we have component level data available. It decomposes the behavior into characteristics that are separated into lower level components and by combining components in this way, the models capture the dynamic effects.
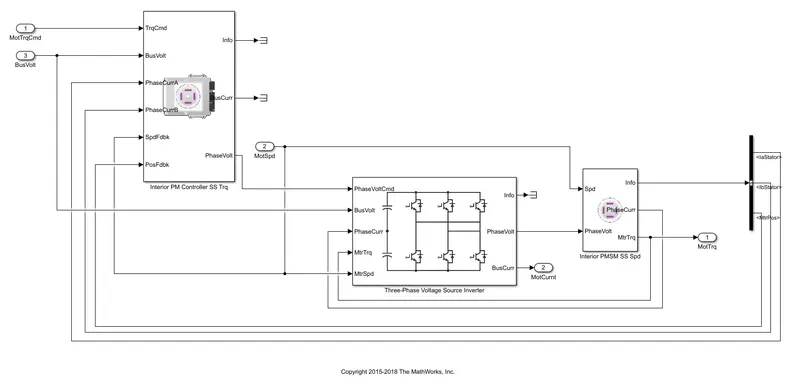
How to change model type: Go to the engine plant of the passenger car block,then go to the parameter of choice (ex:motor), then right click and go to variant and choose label mode active choice. Finally choode between dynamic and Mapped configuration.
2. ANSWER
The fuel economy of an automobile relates distance traveled by a vehicle and the amount of fuel consumed. Consumption can be expressed in terms of volume of fuel to travel a distance, or the distance traveled per unit volume of fuel consumed.
Fuel economy is the relationship between the distance traveled and fuel consumed.
Fuel economy can be expressed in two ways:
1. Units of fuel per fixed distance
A lower number means more efficient, while a higher number means less efficient.
Generally expressed as liters per 100 kilometers (L/100 km) or gallons per 100 miles(g/100 miles).
2. Units of distance per fixed fuel unit
A higher number means more efficient, while a lower number means less efficient.
Generally expressed as Miles per gallon (mpg) or Kilometers per liter (km/L).
Miles per gallon gasoline equivalent
Miles per gallon gasoline-equivalent (MPGe or MPGge) is a measure of the average distance traveled per unit of energy consumed. MPGe is used by the United States Environmental Protection Agency (EPA) to compare the energy consumption of alternative fuel vehicles, plug-in electric vehicles, and other advanced technology vehicles with the energy consumption of conventional internal combustion vehicles rated in miles per U.S. gallon.
The unit of energy consumed is 33.7 Kilowatt-hours without regard to the efficiency of conversion of heat energy into electrical energy, also measured in Kilowatt-hours. The equivalence of this unit to energy in a gallon of gasoline is true if and only if the heat engine, generating equipment, and power delivery to the car battery are 100% efficient. Actual heat engines differ vastly from this assumption.
33.7 Kilowatt-hours= 1-gallon gasoline energy
FORMULA:

MPGe Model:
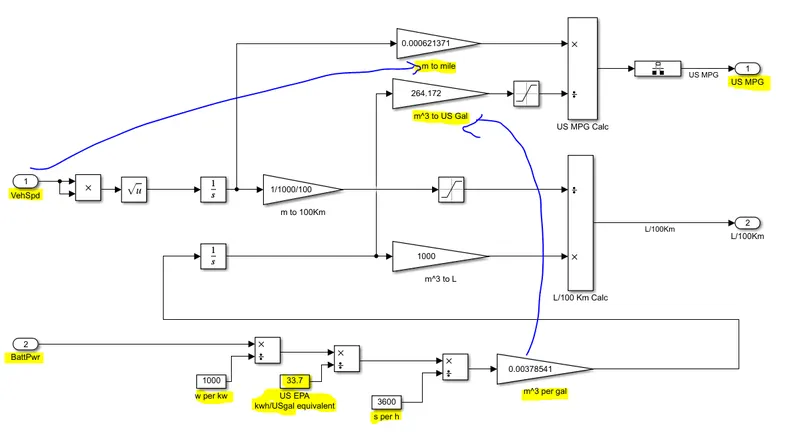
Explanation for the MPGe Model:
Input required for the MPGe model are:-
1. Instantaneous Speed
2. Instantaneous Fuel Flow
3. Instantaneous Battery Power
Working of the Model
The instantaneous speed is used to calculate the total distance traveled using an integrator block and the distance is covered to miles.
The instantaneous battery power is converted into kilowatt and then power is converted to equivalent energy in gallons, from gallons it is converted to m3 using the gain block and is merged with the fuel using the addition block.
The instantaneous fuel flow from the engine and equivalent from the battery pack is used to calculate the total fuel consumed using an integrator block and the fuel is converted from m^3 to liters.
Using the distance and the fuel flow the Miles per Galon (MPG) and Litre per 100km are found.
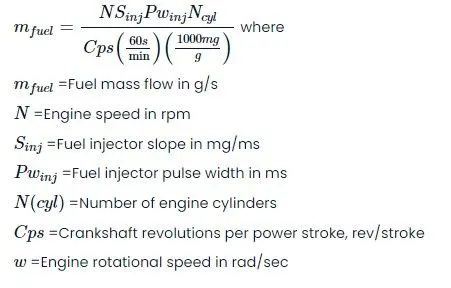
Fuel Flow
To calculate the fuel flow, the SI Core Engine block uses fuel injector characteristics and fuel injector pulse-width.
Factors effecting the fuel flow are Engine Speed, No. of Cylinders, Fuel Injector pulse width and the Fuel Injector Slope.
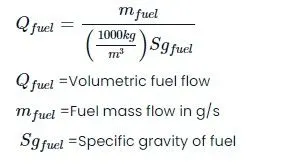
To calculate the fuel economy for high-fidelity models, the block uses the volumetric fuel flow.
3. ANSWER
Go to help and write Powertrain blockset. Go to Get start with powertrain blockset and choose Explore hybrid electric vehicle multimode reference application. Load the simulink model.
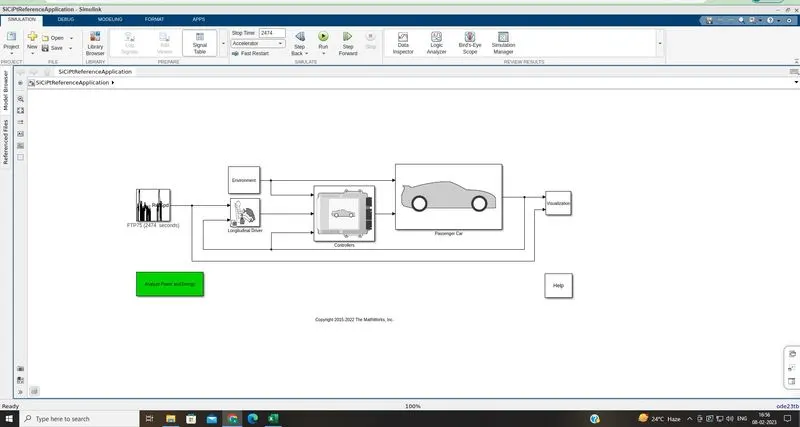
Change the drive cycle to WOT and change the parametrs accordingly.
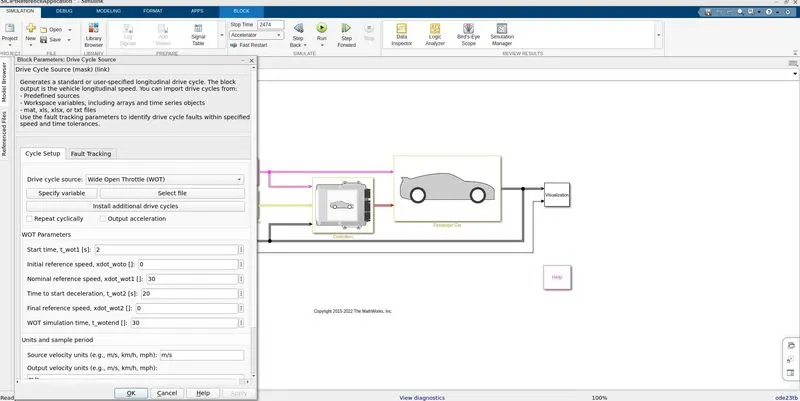
Inside this window, we can change our drive cycle from default to wide-open throttle and also can change
speed, time, acceleration, and simulation time.
Now we need to change the Grade and Wind velocity in the Environment block and comment on the results therefore go to environment block and change the parameters.
GRADE = 5
WIND = 10
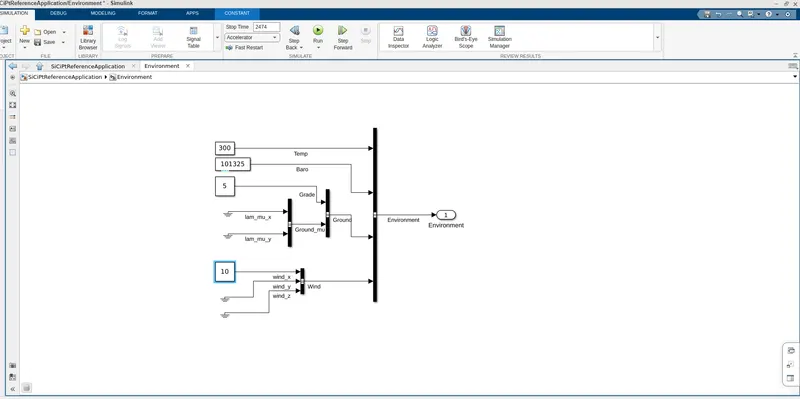
and keeping all condition the same as above and running simulation one more time
we got these graph
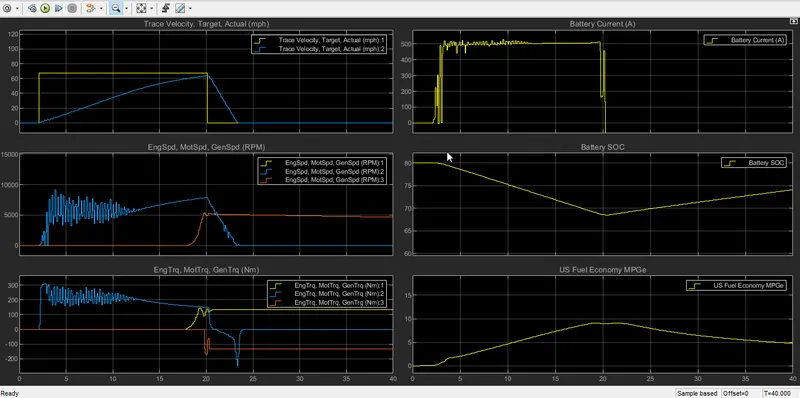
GRAPH 1:-Trace velocity vs Actual velocity
The yellow line indicates the trace velocity and the blue line indicates the actual velocity. by referring actual velocity line here we can see that vehicle requires from 2 sec to 20 sec time to achieve the maximum speed towards the targeted path by using battery power on. after that vehicle starts to deaccelerate.
GRAPH 2:- Engine motor Generator speed
As the battery is fully charged, at initial condition, only the motor speed (blue line indicate) is used which high at starting because of resistance due to slope and wind velocity. the engine speed (yellow line indication) is overlapped with generator speed(orange indication line)indicating both running on the same rpm. initial there is no need for the engine and generator speed as the motor is fulfilling the requirement to achieve the maximum speed of the vehicle. Therefore they are at 0 pm. but when the battery will discharging or when the state of charge(SOC)becomes below 70% then the only engine will start to rotate to provide and maintain the speed of the vehicle and so far generator will also start to charge the battery at the same time hence their rpm are the same.
GRAPH 3:- Engine torque, motor torque, and generator torque
As the battery is being used at the start, so torque will also maximum for the motor in this case until case until the vehicle acquires its maximum speed. once the vehicle reached at constant speed. the torque requirement will reduce. here also when there is deacceleration, the torque value becomes negative indicating no need of torque. Also it becomes constant once the battery goes into the charging state cause now. here engine torque is being used due below 70% SOC, Also,generator torque will be negative indicating that electric motor is charging and in this period engine has to overcome the torque requirement of vehicle successfully
GRAPH 4:- Battery current
when a vehicle uses an electric motor then only it is used to generate the power of the motor, when the vehicle accelerates, then no current is extracted to produce power for the motor. from the graph you also can see, the current requirement becomes stable when the battery charging mode is activated.
GRAPH 5:- SOC(state of charge)
state of charge(soc) is very important for battery-driven vehicles, from the graph it can be seen that the battery is used below 80%, the state of charges goes down and the battery goes on charging mode through generator once the the battery gets charged then its state of charge also increases and it won't fall down until battery is subjected to another operation
GRAPH 6:- MPGE
the graph show miles per gallon equivalent to run the vehicle during the higher speed the fuel need is high as the vehicle deaccelrate the the fuel requirement is less
these are the observation we studied from the graph
4.ANSWER
HYBRID ELECTRICAL VEHICLE: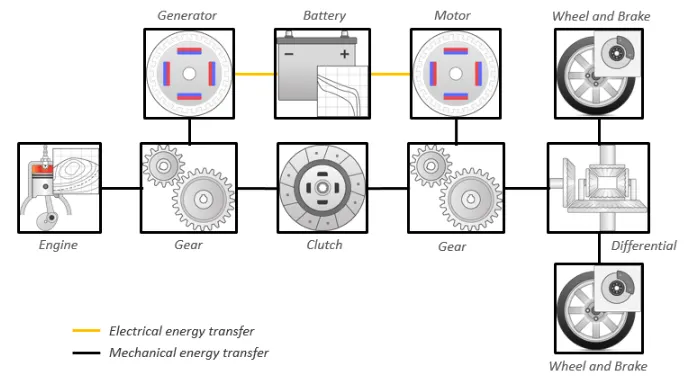
The Hybrid Electric vehicle the initial torque is obtained from the battery for the certain speed limit and it will interchange into IC engine after attains the limited speed.
In hybrid vehicle velocity reaches the maximum level in short duration of time. By increasing the torque using the battery, the recharging process of battery is done during de-accleration.
This model shows that parallel conditions is applied in hybrid vehicle and the transformation of power is acted by battery. During the IC engine power generation process to vehicle the motor acts as a generator for battery.
RESULT:
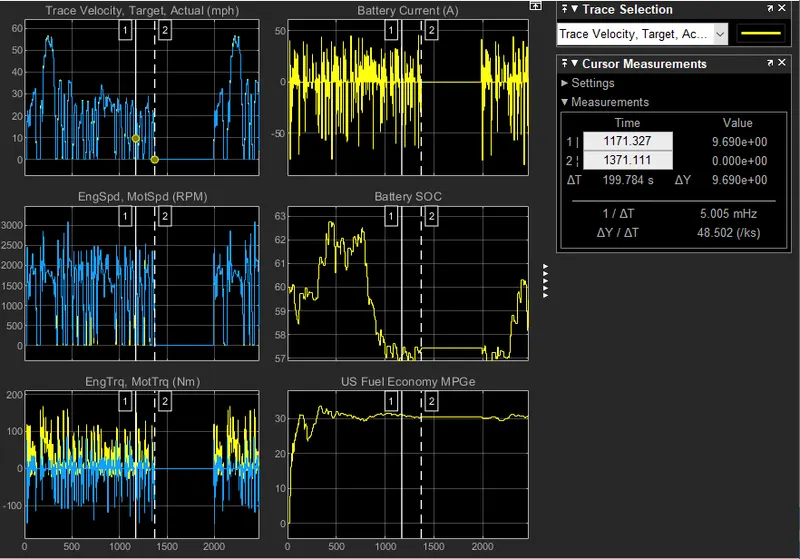
PURE ELECTRIC POWERTRAIN:
The electric vehicle reference application represents a full electric vehicle model with a motor-generator, battery, direct-drive transmission, and associated powertrain control algorithms. Use the electric vehicle reference application for powertrain matching analysis and component selection, control and diagnostic algorithm design, and hardware-in-the-loop (HIL) testing.
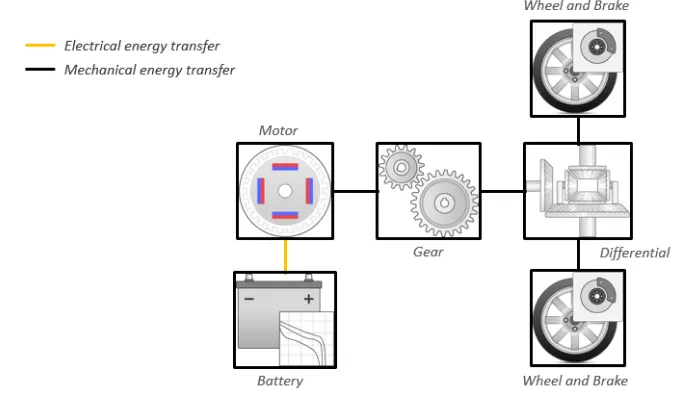
RESULT:
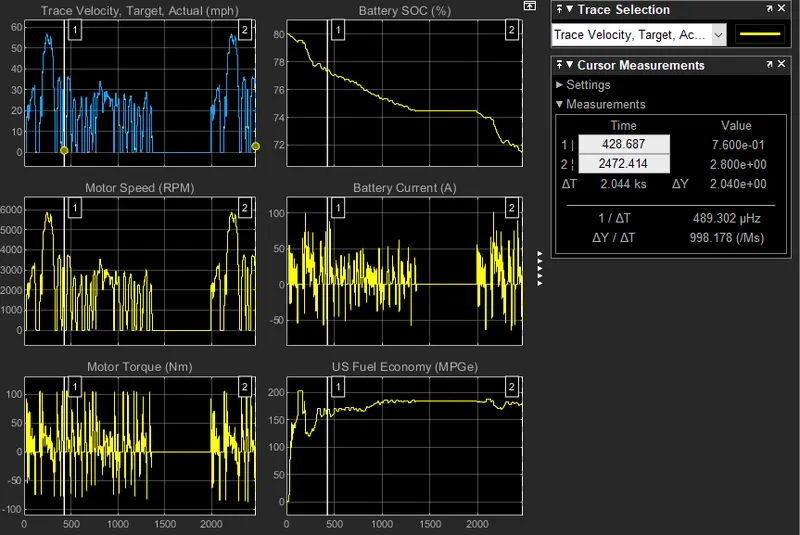
COMPARISON OF HYBRID WITH PURE ELECTRIC POWERTRAIN:
- The drivetrain loss for EV vehicle is more than the HEV vehicle. Whereas the power loss in EV vehicle is less than that of HEV vehicle.
- Therefore the EV vehicle is more efficient than the HEV vehicle because an battery used for Electric vehicle is Lithium ion which has low discharge rate than the battery used for HEV Nickel metal hybrid battery
- In hybrid vehicle the emission is obtained and the fuel consumption rate is high. whereas the Electric Vehicle release the 0% of emission this will grade as suitable for environmental condition.
- Therefore all simulations are done and models are extracted for comparing the HEV and EV.