Week-3 Challenge: ADVISOR Tool
ANSWER 1
(A)
In the ADVISOR Vehicle Input GUI, first select Load File as 'EV_defaults_in file' from the drop down menu. And change the Cargo mass to 500 kg in the bottom right corner of the interface.
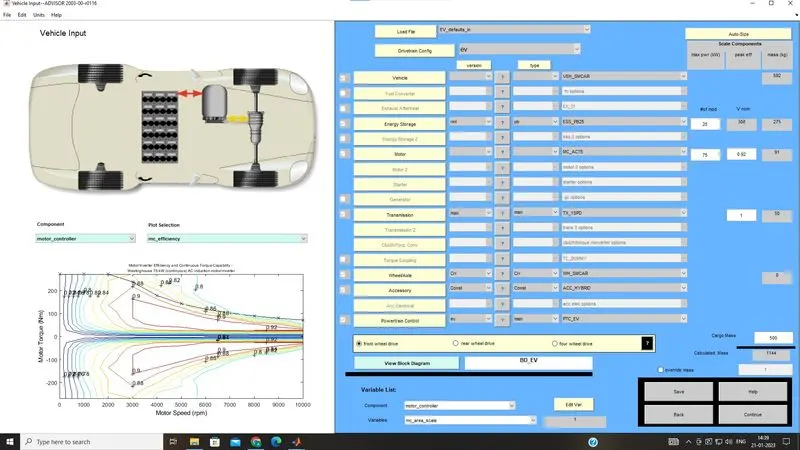
Figure 1. Vehicle input ADVISOR window
Then select 'continue'. Here from the drop down menu of the Drive Cycle select 'CYC_FTP' driving cycle.
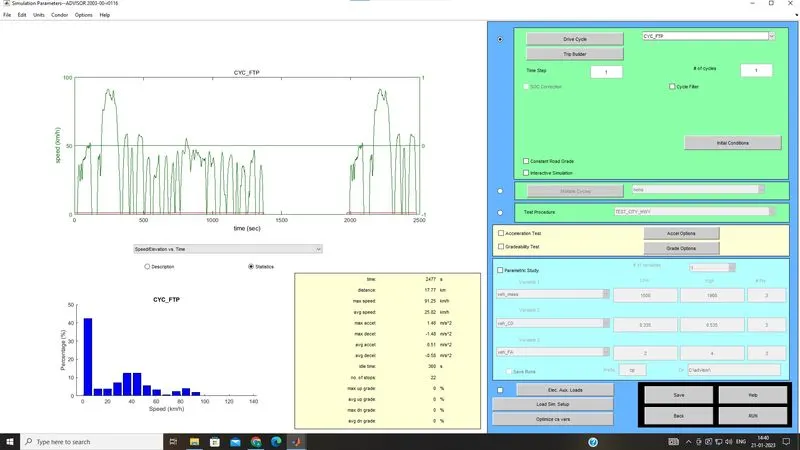
Figure 2. Simulation Parameters ADVISOR Window
Then keeping all the parameters as default, select 'RUN' in the bottom right corner of the interface.
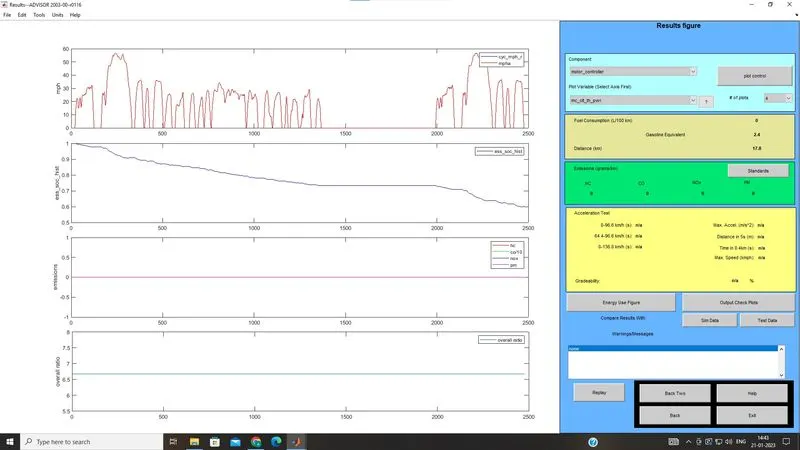
Figure 3. Results ADVISOR Window
In the above results we can see that, Distance (km) is 17.8 km. So, the vehicle can't travel a distance of 45 km in a single recharge.
(B)
Changing the Energy Storage to 'ESS_PB65_FocusEV' and keeping the other parameters similar to the last case.
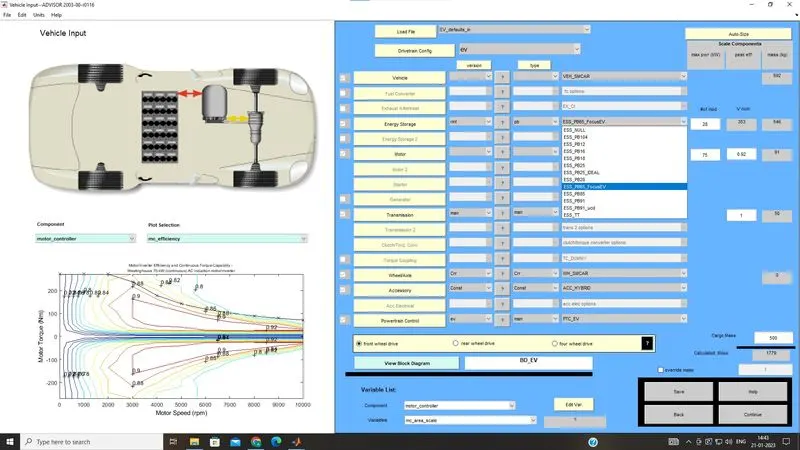
Figure 4. Vehicle input ADVISOR window
Then keeping the driving cycle same we RUN the simulation.
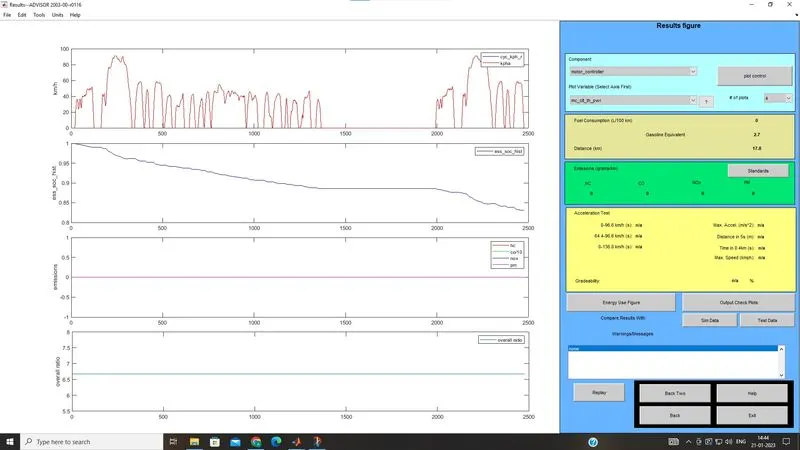
Figure 5. Results ADVISOR Window
From the results we can see that, Distance (km) is 17.8 km and the figure hasn't changed but, SOC % at end of 2500 seconds is 0.83 approximately and not zero. So in one FTP cycle it covered 17.8 km and charge is still remaining in the battery. So to get how much distance the vehicle will travel in a single charge we need to increase the number of drive cycles for which the simulation is performed. We will perform the simulation for 6 drive cycles.
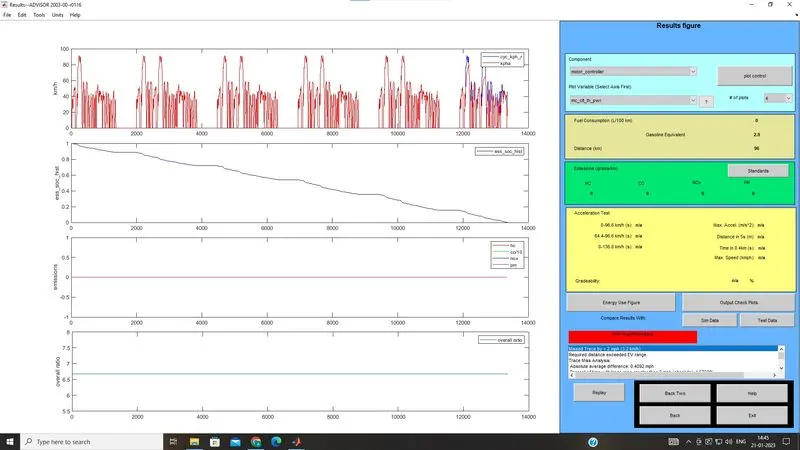
Figure 6. Results ADVISOR Window
From the above results we can see that, Distance (km) is 96 km and also the % of SOC as indicated by second plot is 0% by 13500 seconds approximately. So in a single charge the vehicle with this configurations can travel a distance of 96 km in a single charge.
Answer two
In the Load File drop down menu select 'PRIUS_Jpn_defaults_in' and rest of the parameters are kept default.
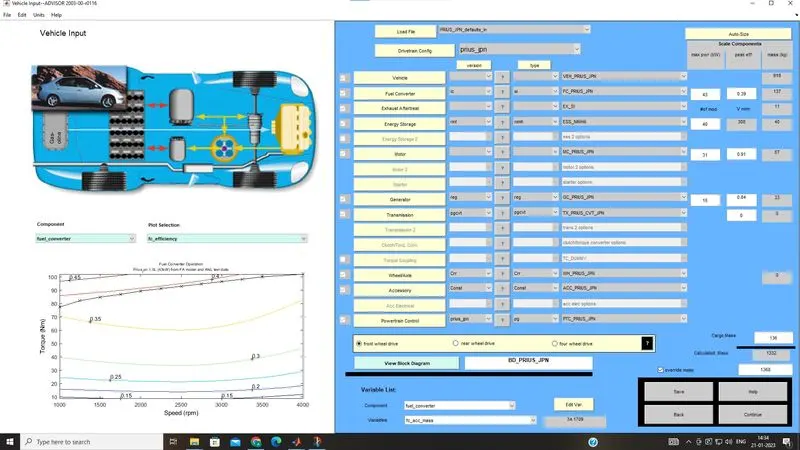
Figure 7. Vehicle input ADVISOR window
Then select 'continue' in the bottom right corner of the window. Then select Gradeability checkbox and then select Grade Options.
Kept the speed as 55 mph.
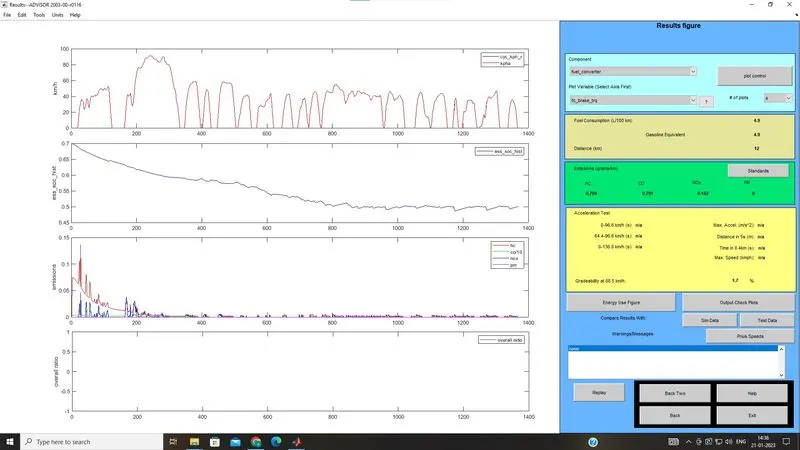
Figure 8. Results ADVISOR Window
Then gradeability is 1.7%.
Nowchange the spped to 35 mph.
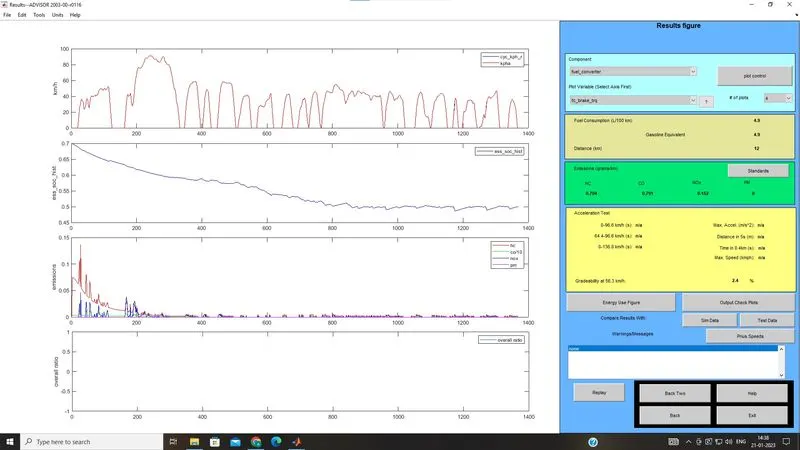
Figure 9. Results ADVISOR Window
The gradeability at 35 mph has increased to 2.2 %.
So we can conclude by saying that, as speed increases the gradeability decreases.
| A | B | C | |
| 1 | PARAMETERS | VEHICLE 1 | VEHICLE 2 |
| 2 | SPEED (mph) | 45 | 35 |
| 3 | GRADE | 1.7 | 2.2 |