Week-4 Challenge WOT Condition Part-2
- What is the difference between mapped and dynamic model of engine, motor and generator? How can you change model type?
--> Mapped Engines represents macro engines behaviors as a set of lookup tables such as Torque produce, Fuel flow, Airflow, Engine temperature, Emission flow, Engine speed, etc.
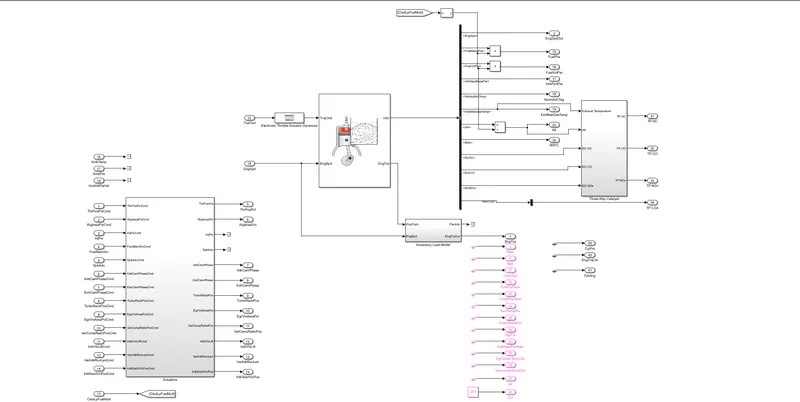
--> Dynamic Engines represents with individual components subsystem model in a dynamic state that account for engine dynamics.
--> Maped Motor represents as a lookup tables such as Battery voltage, Speed torque, in certain condition. This mapped motor is used when when the user doesn't have aware about any values or parameters values of input
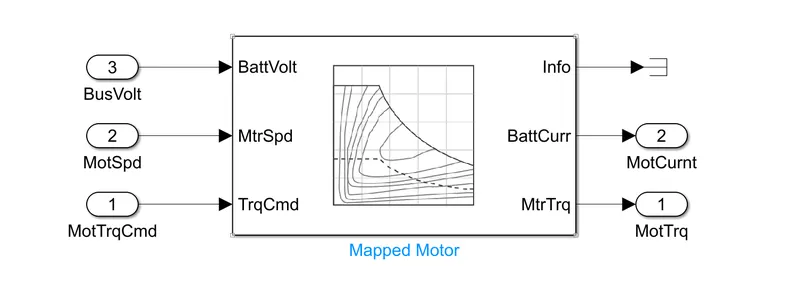
--> Dynamic Motor have the knowledge of parameters input values.. Mapped motor gives result quickly but the results wrer not accurate whereas Dynamic motor gives true values compared to Mapped.
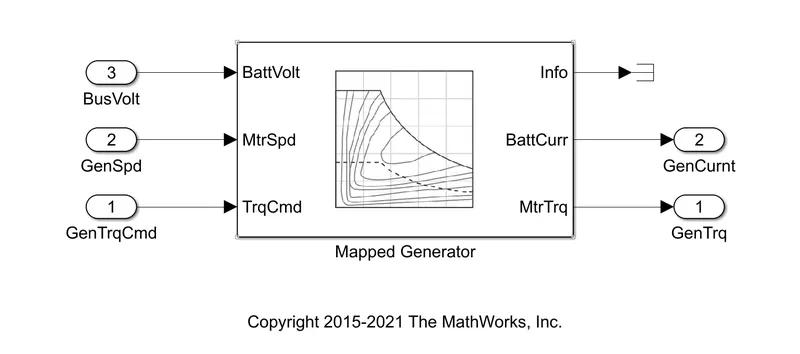
--> Mapped generator in this operation is same as like mapped engine and motor but Genertor speed and torque is different form that
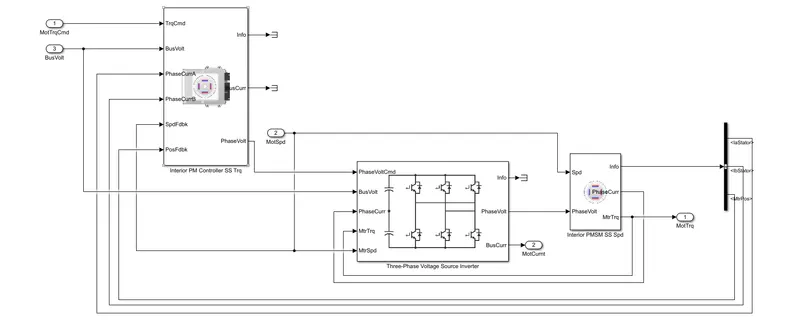
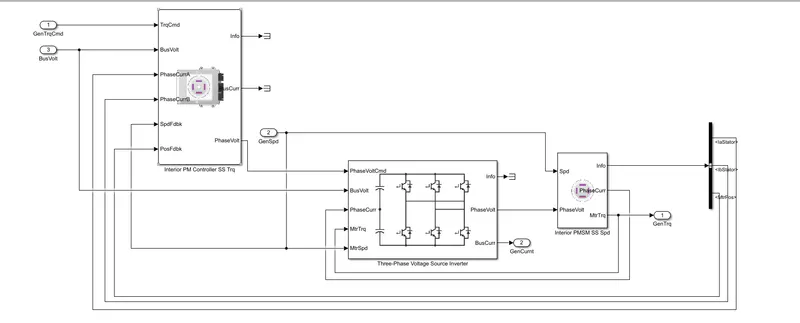
--> Dynamic Generator it includes electronics equipments such as PM controller , 3- phase Voltage Source invertor (VSI), PMSM is used..
How can you change model type
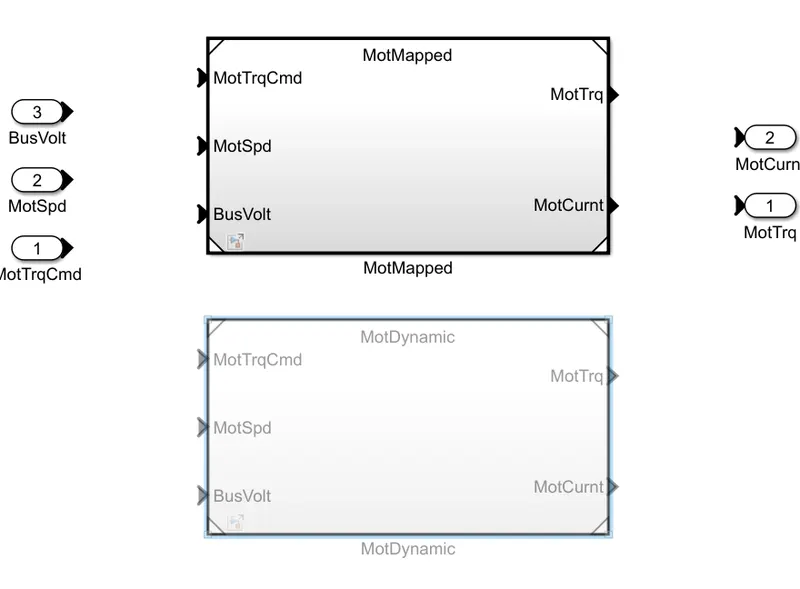
Open the particular block where as motor or generator it shows two blocks one is mapped and another is dynamic
Now click the modelling bar menu and then click on modeling explorer
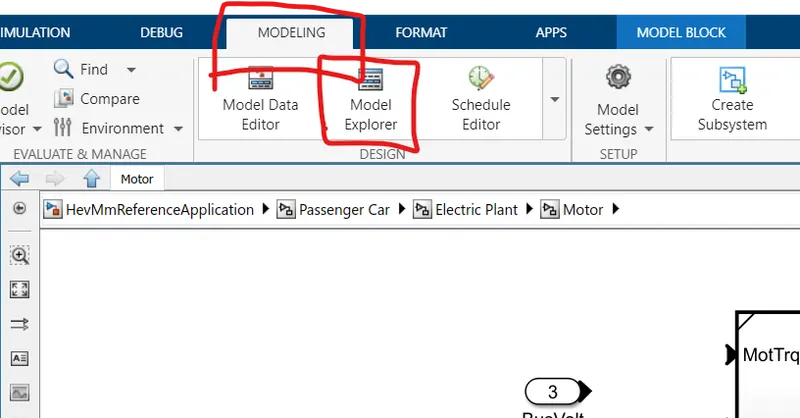
then change the model you want

2. How does the model calculate miles per gallon? Which factors are considered to model fuel flow?
MPG - it stands for Miles per gallons
In HEV the energy used by battery power and fuel. but to add it they both should be same in same unit, that is m^3/gal.
So, we need to convert KW in W by dividing battery output by 1000. As the power used by battery is in MPGe, we need to divide it by factor of 33.7, and finally to convert Wh into Ws, we divide by 3600. We multiply the output of that using Gain Block by factor of 0.00378541. Now the unit of Fuel energy and bettery energy used is same. This values are first added using addition block. And then integrated using integrator block for its demanded power at any respective second. We also take vehicle speed. First we square it, then use the square root. Using inegrator block we find the vehicle speed for every second. This value is then multiplied by factor of 0.000621371. This converts metres to miles. The output of fuel volume is multiplied by factor of 264.172. This converts m^3 to gallon. The total miles travelled will be divided by total gallon of fuel used. In this way the miles per gallon is calculated.
Fators are considered to model fuel flow
- Fuel volume used
- Vehicle speed
- Vehicle load
- Battery power required
- Drive cycle
- Angle of climb
- Weather/environment condition
3. Run the HEV ReferenceApplication with WOT drive cycle. Change the grade and wind velocity in the environment block. Comment on the results.
We will open the model and the model is as follow:
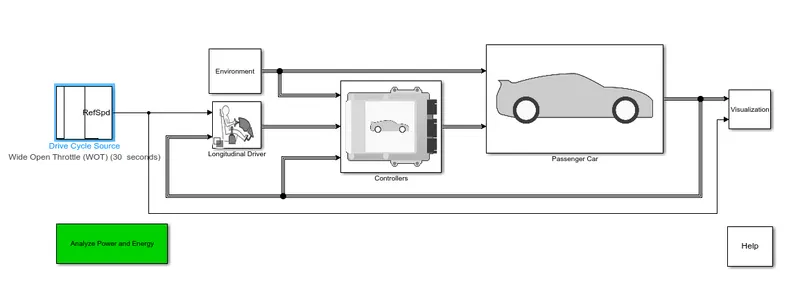
Fig: Model of HEV Powertrain
Here the driving cycle is selected as WOT. Now running it the result is as follow:
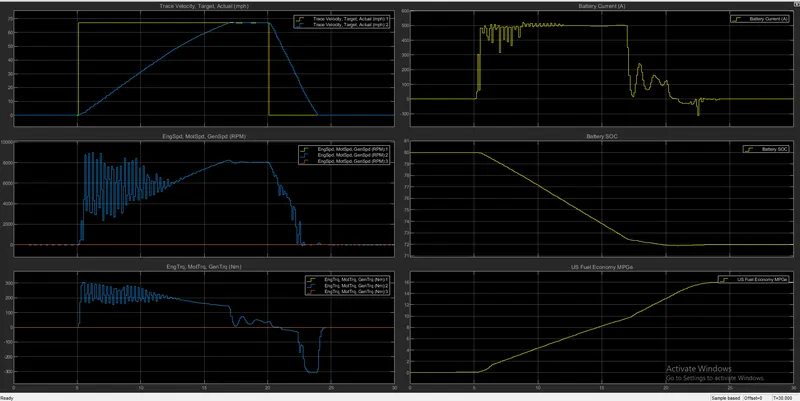
Fig: Simulated result of HEV Powertrain in WOT condition
From the above graph it is seen that the battery as a pure source of power is used to meet the demands required. The engine was not needed. In the seond graph. The top speed of motor was nearly 9000 rpm was reached in approximately in 7 seconds. As engine is not running, the generator rpm is also at 0. The engine torque clocked at 300 Nm in that time. During decelaration the engine torque goes negative, due to braking and the charging of the battery due to Regenerative Braking. In the fourth graph it can be seen that the current needed is high during acceleration and maintaining the speed. And reduces during decelaration. The value also goes below 0 due to regenerative braking. The current requirement goes to as high as 500 A for nearly 12 seconds time span. As the vehicle is at rest at first the SOC remains stable at 80 percent for 6 seconds. After 6 seconds due to acceleration and power demand the SOC declines. It does increase somewhat due regenrative braking. The Miles per Gallon equivalence that is fuel economy recorded is 14 MPGE during the drive.
Now, we will change the WOT condition and grade as well as wind velocity in the environment block.
The grade is set as 10 and the wind speed is set as 6 mph.
We have made the WOT condition as following
Start time = 2 sec
Top speed = 70 kmph
Time to start decelaration = 60 sec
Stop time = 120 sec
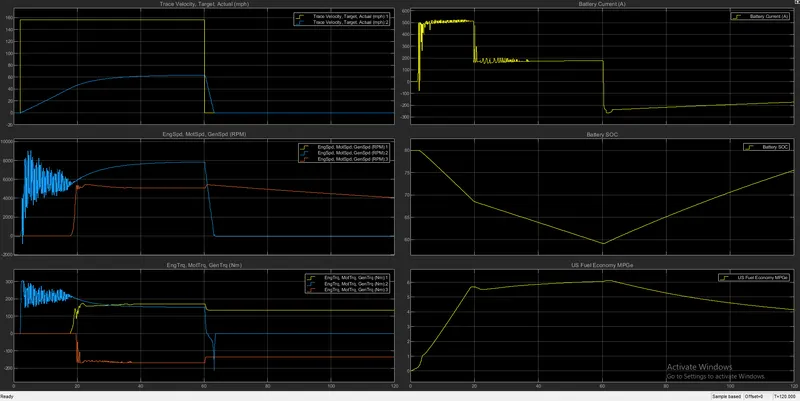
Fig: Simulated result of HEV Powertrain in changed WOT and Environmental Condition.
Due to higher power demand both the engine and motor is functioning. The top speed of the motor of 9085 rpm is achieved at approximately 5 sec. Here due to high power demand the engine got started at 18.24 sec. It reached the top speed of 5656 rpm within 3 sec of its start. The speed of the engine will be reciprocated by the speed of the generator, as engine runs the generator. At 60 sec when SOC of battery is at 60 percent , the motor stops providing power and due to regenrative braking the SOC of the battery goes on increasing after that point. The motor torque reaches 300 Nm in 2.720 sec. It declines after 20 sec, when SOC is below 60 percent the motor decelarate, resulting in decline in torque to negative as the motor work as generator during braking. Once regenerative braking is achived completely the motor torque reaches to 0. The engine torque is 172 Nm at 21.52 sec and there after it increases slightly. During braking it decreases and the ramins stable at 135 Nm for rest of the cycle. The generator mirrors the engine torque but in negative direction as generator rotates inthe opposite direction of the engine. The battery current requirement is around 500 A for nearly 20 sec timespan. But as soon as engine steps in the propulsion of the vehicle is shared by the engine as well as motor. Due to this the current goes down after that to around 200 A for 40 sec timespan. The effect of deceleration reduces the current requirement significantly, and it reaches below 0 due to regenrative braking. It does increases after that. The SOC keeps on decreasing until 60 sec to 60 percent. But due to regenerative braking the battery is charged and the SOC is increased gradually. The fuel economy is 6.1 MPGe at time 62.55 sec, but decreases after that as battery is charged and engine takes over.
4. Keeping all other parameters same, compare the simulated results of hybrid and pure electric powertrains.
The block diagram for the Electric powertrain is as follow:
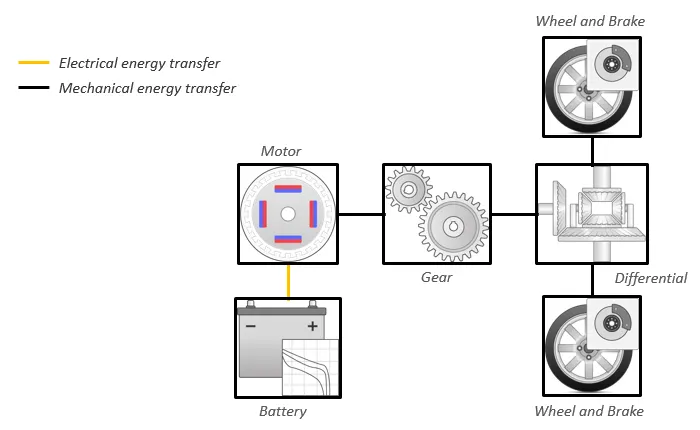
Fig: Block Diagram of EV Powertrain
Here the battery powers the motor to propel the vehicle.
The model of the electric powertrain is as follow:
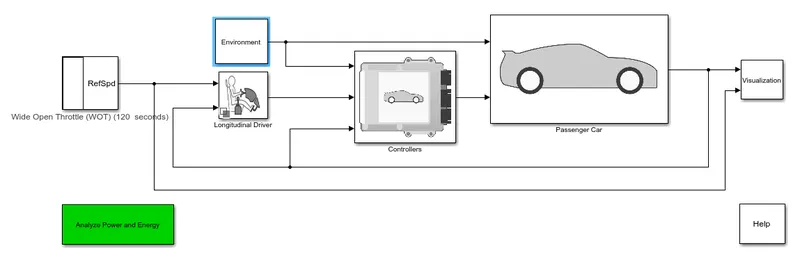
Fig: Model of EV Powertrain
Keeping the parameter of last used WOT condition and environment condition as same as used in hybrid powertrain, the result are as follow for electric powertrain.
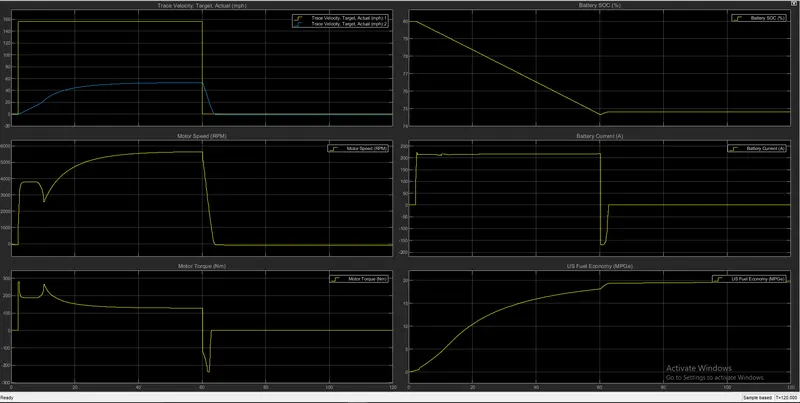
Fig: Simulated result of EV Powertrain using same parameter as HEV Powertrain in WOT condition.
The motor touches 5648 rpm in 60 sec. The torque of 280 Nm is reached in 2.394 sec after 60 sec it goes down significantly due to decelaration. it goes to negative value to to regenerative braking. The battery SOC decreases till 60 sec and increases slightly after that due to regnerative braking. The current drawn out here is 200 A for roughly 57 sec and goes down after that due to decelaration and goes to negative value due to regenerative braking. The fuel economy is 19.69 MPGe after the ride.
Comparision
a. The Trace Velocity graph for HEV and EV powertrain is similar
b. The peak RPM of motor in EV is less than HEV. There is huge fluctuation in the values of RPM of motor in HEV at the onset, but the graph smoothens after that. Incase of EV the RPM magnitude is smooth from the moment go.
c. The same is true for torque. The peak torque of motor in EV is less than HEV. There is huge fluctuation in the values of torque of motor in HEV at the onset, but the graph smoothens after that. Incase of EV the torque magnitude is smooth from the beginning.
d. The SOC at the end of HEV ride is increased by 26 percent where it increases just slightly in EV. So regenrative braking leading to increase in SOC is better in HEV then EV.
e. The current requirement is HEV reaches nearly 500 A whereeas it is 200 A for EV. The current is negative for more time in HEV than in EV powertrain, this atttributes to more SOC because of better regenerative braking