Week-4 Challenge WOT Condition Part-2
- What is the difference between mapped and dynamic model of engine, motor and generator? How can you change model type?
Mapped model :- This Model uses a set of Data’s to calculate Engine performance. The Data’s include mostly ‘Lookup tables’ for calculation of all the parameters inside the engine. For example the Mapped CI Engine block implements a mapped compression-ignition (CI) engine model using power, air mass flow, fuel flow, exhaust temperature, efficiency, and emission performance lookup tables. The tables provide overall engine characteristics, including actual torque, fuel flow rate, BSFC, and engine-out exhaust emissions.
Dynamic model:- The dynamic model doesn’t uses any predefined data’s for its calculation, instead it uses the data’s that are fed by the user. This type of model is more accurate than a mapped model. Model decomposes the engine behaviour into engine characteristics that are separated into lower-level components. By combining components in this way, the models capture the dynamic effects.
To switch between Mapped and dynamic model of any given vehicle, follow the following steps
Open the model of the desired vehicle
Click on the ‘Passenger Car’ block
Under ‘Passenger Car’ block click the ‘Electric Plant’/’Engine Plant’ block
Under that block you will see a ‘Motor’ block (in case of Electric vehicle model), Right click on that block
After that click on ‘Variant’ and select ‘Label mode Active choice’ option and select whether the ‘Mapped model’ or the ‘Dynamic Model’.
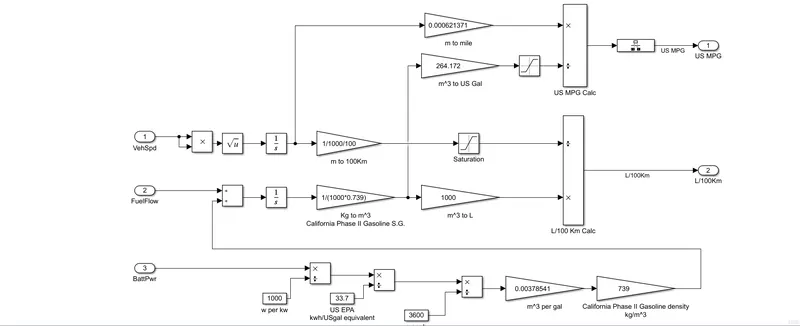
2. How does the model calculate miles per gallon? Which factors are considered to model fuel flow?
We can see this calculation in the ‘Visualization’ block. This block calculates that how much the vehicle will travel per gallon of fuel and in the case of a purely electric vehicle it calculates the distance travelled by the vehicle per unit electrical energy consumed.
Below is the image of the block that calculates the vehicle performance
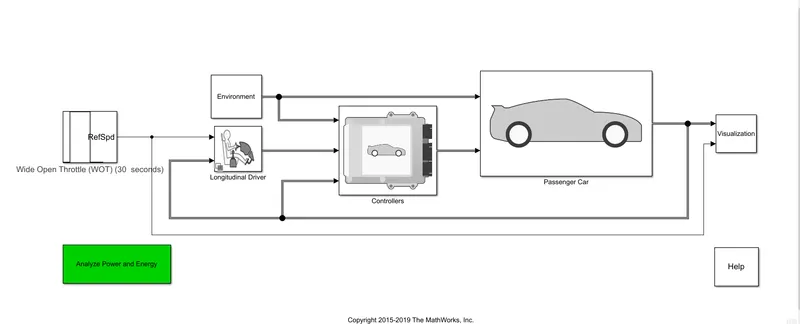
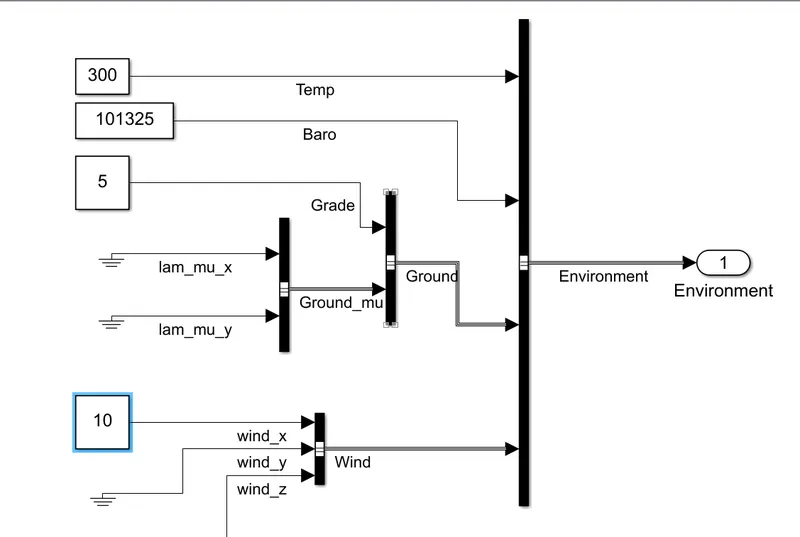
3. Run the HEV Reference Application with WOT drive cycle. Change the grade and wind velocity in the environment block. Comment on the results.
I have changed the Grade and Wind velocity to 5 and 10 respectively and have run the simulation for about 50 seconds
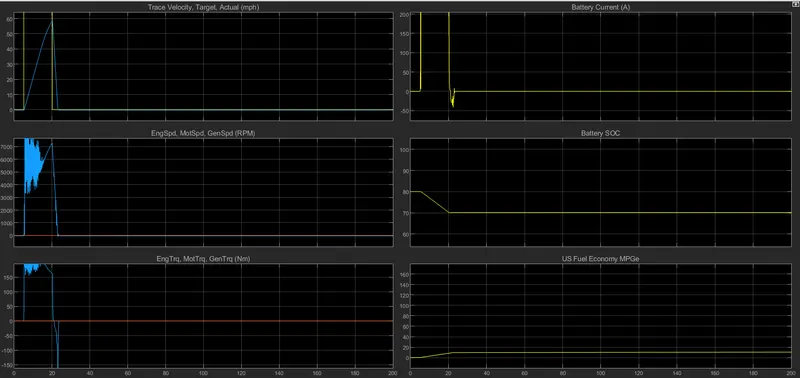
Below are the observations:-
- The top speed is almost 67.1 mph
- The current supply increases from 0 to a maximum of around 524.1 A
- The motor achieves a maximum speed of 8893 RPM
- The battery State of Charge (SOC) decreases from 80-70% during the cycle.
- The torque produced by the motor is around 303.9 Nm
4. Keeping all other parameters same, compare the simulated results of hybrid and pure electric powertrains.
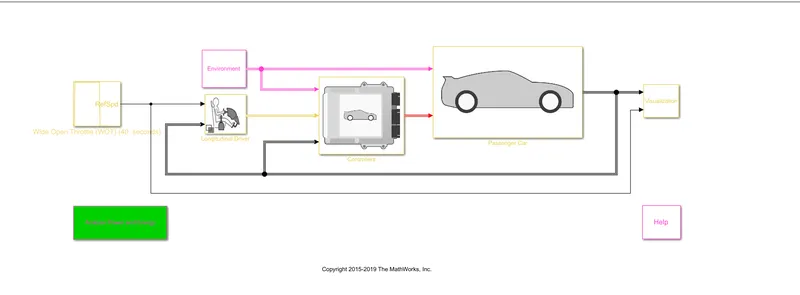
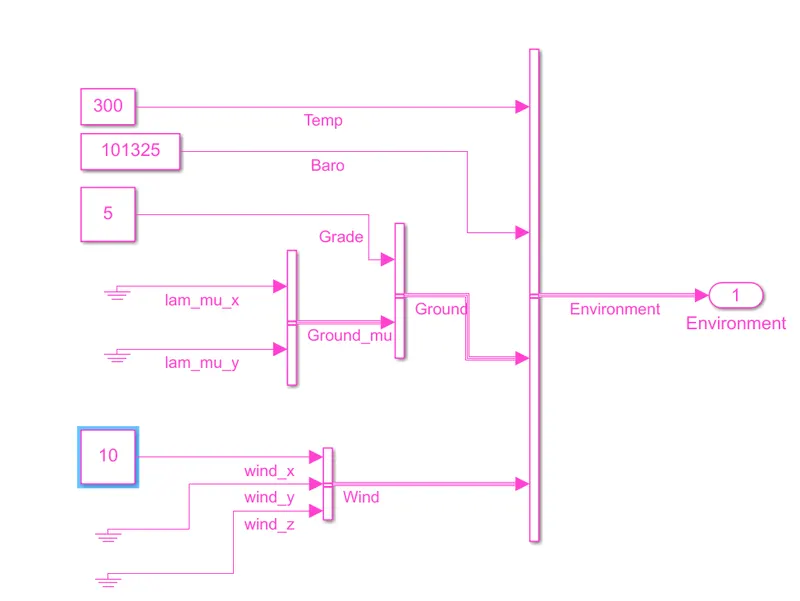
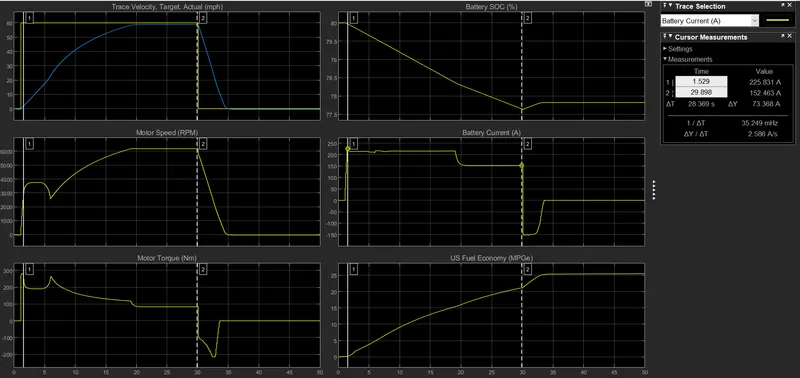
The observations made during the simulation of a pure electric vehicle keeping all the parameters same as above
- The top speed is almost 59.95 mph
- The current supply increases from 0 to a maximum of around 225.831 A. After 30 sec the battery gets charged.
- The motor achieves a maximum speed of 6182 RPM
- The battery State of Charge (SOC) decreases from 80-77.64% during the cycle.
- The torque produced by the motor is around 279.953 Nm
CONCLUSIONS:- The following conclusions are made
PARAMETERS HEV PURE ELECTRIC
Top speed (mph) 67.1 59.95
Current (A) 524.1 225.831
Motor (RPM) 8893 6182
SOC 80-70% 80-77.64%
Motor Torque (Nm) 303.9 279.953
For the same conditions i.e same value of Grade and Wind velocity the HEV achieves a top speed of 67 mph whereas the EV achieves a speed of 59 mph
The torque produced by the HEV is greater than that of an EV.
The current required by the motor in an HEV is greater than that of an EV.