Week-4 Challenge WOT Condition Part-2
1.What is the difference between mapped and dynamic model of engine, motor and generator? How can you change model type?
Mapped and Dynamic model of Motor, Engine and Generator:
Powertrain Blockset provides two types of combustion engine models: mapped and dynamic. You can switch between engine model types based on your application.
| Mapped/Static | Dynamic |
|
Mapped engines represent macro engine behaviour as a set of lookup tables as functions of commanded load and measured engine speed. |
Dynamic engines decompose engine behaviour into individual component models based on their characteristics. By combining this way, the model captures the dynamic effect. |
| Mapped engine models are more rigid and it is a time independent view of a system i.e, cannot be changed in real time | Dynamic modelling is flexible as it can change with time as it shows what an object does with many possibilities that might arise in time. |
| It acts as a structural model which are at equilibrium of in a steady state | It acts as a behavioural model which keeps changing with reference to time and their differential equations are conspicuous by their absence in static model. |
| The tables provide overall engine characteristics, including actual torque, fuel flow rate, BSFC, and engine-out exhaust emissions for brake torque, fuel flow, air mass flow, exhaust temperature, efficiency, and emissions | Dynamic models are used for engine dynamics, most notably intake airflow and turbocharger dynamics. |
| Mapped engine models are suitable for analysis and design activities that do not require engine subsystem dynamic characteristics | Dynamic engine models are suitable for designing control, estimator, and diagnostic algorithms that depend on dynamic subsystem states |
| For example, in engine and transmission powertrain matching analysis for fuel economy, emissions, and performance trade-offs. | For example, in closed-loop AFR control algorithm development. |
|
|
How can you change model type?
STEPS:
- To install powertrain blockset and set the path. To select the powertrain blockset type - pure electric vehicle, hybrid or IC engine reference type.
- To type the command in the command window to open the module. This can be done even by taking reference module from help documentation.
- The simulink model is to be opened in the new window and the work flow and path directory are opened in another window.
- In the simulation window, by clicking on the blocks present it shows their type in the pane placed above the tool strip. On clicking the passenger car block the pane shows variant subsystem. Right click on the block and choose variant option. There are three options in variant : Open , Label mode active choice , open in Variant Manager.
- From the options above choose variant manager. In this window you can see all the main blocks and their subsystems.
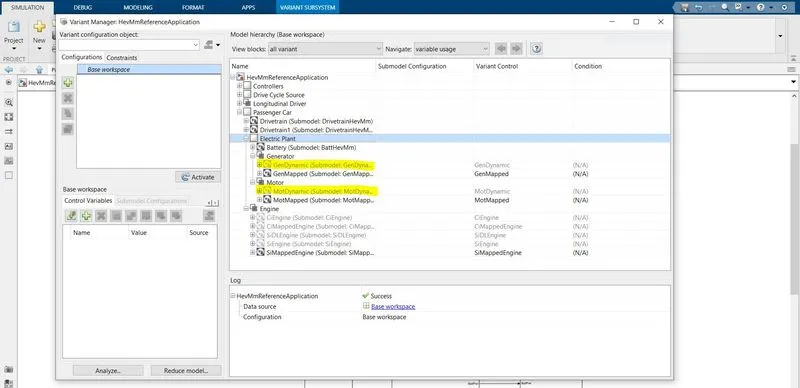
Each model has different subsystems and components in it based on powertrain (IC engine, Electric vehicle, hybrid) used. So it is easy to find out the components in variant manager to find whether they are mapped or dynamic models of motor, engine or generator.
- From their subsystems we can find whether the engine, motor or generator is used and in which type (mapped or dynamic) is used. From here we can change from mapped to dynamic or vice-versa based on the requirement by clicking on the + button and activating it. The dark fonts represent the used models and the light fonts represent the alternatives which can be activated based on the requirement.
2. How does the model calculate miles per gallon? Which factors are considered to model fuel flow?
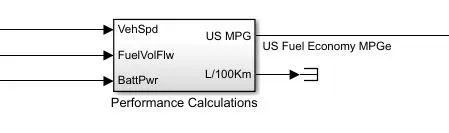
Typical calculations are made based on the requirement of the model chosen for the calculation. The calculator is shown inside the performance calculations block shown below. The inputs required for the calculation of MPG(Miles Per Gallon) are vehicle Speed, Fuel flow and Battery power.
When to use MPG AND MPGe:
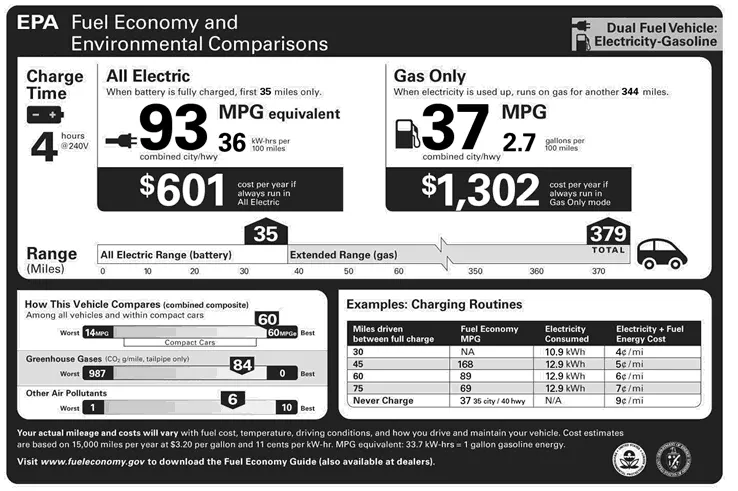
MPGe stands for “Miles Per Gallon Equivalent”. Traditional MPG measures how many miles your vehicle is able to travel using one gallon of gasoline. Since hybrid and fully-electric vehicles don’t always need gasoline to operate, “MPGe” is more useful metric for comparing energy consumption for electric vehicles.
According to Environmental Protection Agency (EPA) 1 gallon of gasoline generates the same ‘heat energy’ as 33.7 kilowatt-hours of electricity. If an electric vehicle is able to travel 100 miles on 33.7 kWh of electricity (the energy equivalent of 1 gallon of gasoline), it would be rated with an MPG equivalency of 100 MPGe. Let’s say a different electric car can travel that same 100 miles while using lesser kWh (say 32 kWh), slightly less than the previous case. This second electric car would receive a higher rating (of 105 MPGe)since it’s more efficient. Just like traditional MPG ratings for a gasoline-powered vehicle, the EPA rates MPGe across city, highway, and combined fuel economy.
Performance Calculation block:
The speed of the vehicle is taken from the drive cycle, the fuel flow is taken from the engine to calculate the efficiency and the battery power is taken from the SOC (battery) and the output for fuel economy is obtained as MPG in case of conventional vehicle and MPGe(Miles Per Gallon equivalent) in case of hybrid and pure EV. Further looking under the mask can give us the exact method of how the model calculates it MPG AND MPGe.
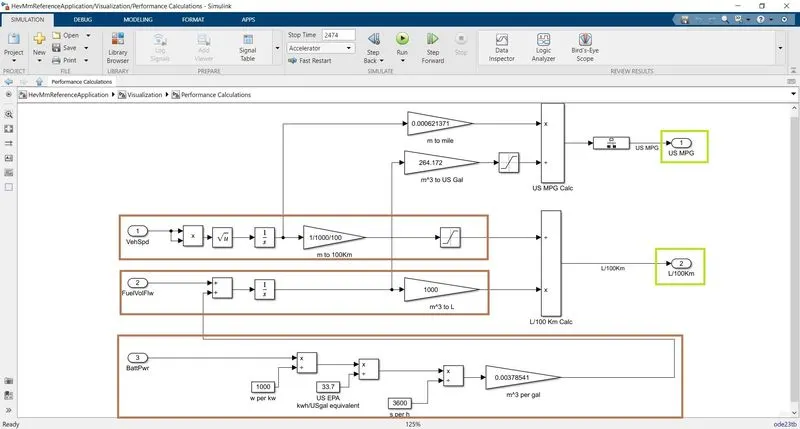
To the right side of the block diagram (in brown color) are the inputs, from the three blocks as said earlier. The output to is the fuel flow in MPG and L/100 km.
Block-1: Vehicle speed : The root mean square of the vehicle speed is taken and then the distance(average) is calculated by intergrating over the time domain. And then using gain we can convert from m to km by dividing by 1000 and further to calculated for 100km it is divided again by 100.
Block-2: Fuelvolume flow: The two inputs, one from the fuel flow and other from the battery power (through a sequence conversion) converted to m^3 per gallon which is fed as the input to the adder. The addition of these two inputs are intergrated over the time domain to obtain the fuel flow volume. Further a gain of 1000 is multiplied to converter volume to liters(m^3 to L).
Block-3: Battery Power: The power in watts is converted into KW by dividing it by 1000 and then divided by 33.7 to obtain the US equvialent of gallon (1 US gallon = 33.7KWh). Since the equivalent value is in kilo-watt hours it is further divided by 3600 to convert seconds into hours. This battery power input is given to the gain to convert it to Fuel volume flow(m^3 per gallon) which is given to block-2 as input.
The fuel economy is calculated by dividing the output of the 1st block over the 2nd. The fuel flow rate (in liters) is divided by the distance per 100 km to obtain the fuel economy L/100km. (refer the 2nd green output block on the right side of the block diagram).
Similarly, to obtain the fuel economy value in US MPG the unit conversions of certain values are done by using gain block. The distance(m) is converted into miles by a gain of 0.000621371 and the volume(m^3) is converted to US gallons by a gain value of 264.172. Further the distance(in miles) is divided by Fuel rate(US gal) to get the fuel economy. (refer 1st green output block to the right of the block diagram).
Factors considered for modelling fuel flow:
- Type of engine,
- fuel injection rate and pulse-width,
- Specific gravity of fuel,
- engine speed and number of cylinders etc.
3. Run the HEV ReferenceApplication with WOT drive cycle. Change the grade and wind velocity in the environment block. Comment on the results.
The HEV reference application is an pre-built hybrid model of electric vehicle available by typing the command given below in the matlab command window. This model helps us to analyze the power and energy and provide detailed output results of various performance parameters of the vehicle. Helps engineers to get a good insight about vehicle and their fuel economy during different environmental conditions.
Matlab command - autoblkHevStart
This is a HEV full multimode reference model consisting of powertrain and vehicle dynamics blocks. The main systems looks like the picture shown below.
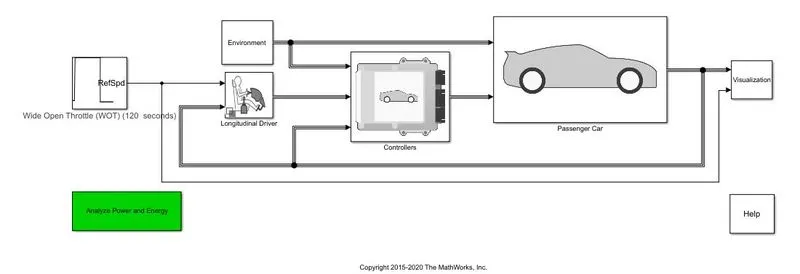
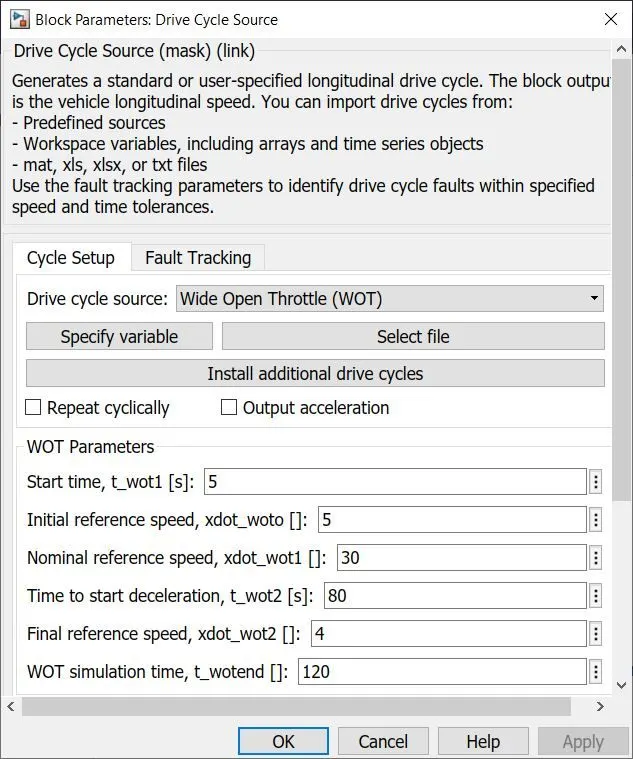
By default the model opens with the FTP75 drive cycle, we can change the drive cycle to WOT by choosing it from the drop down from the block parameters.
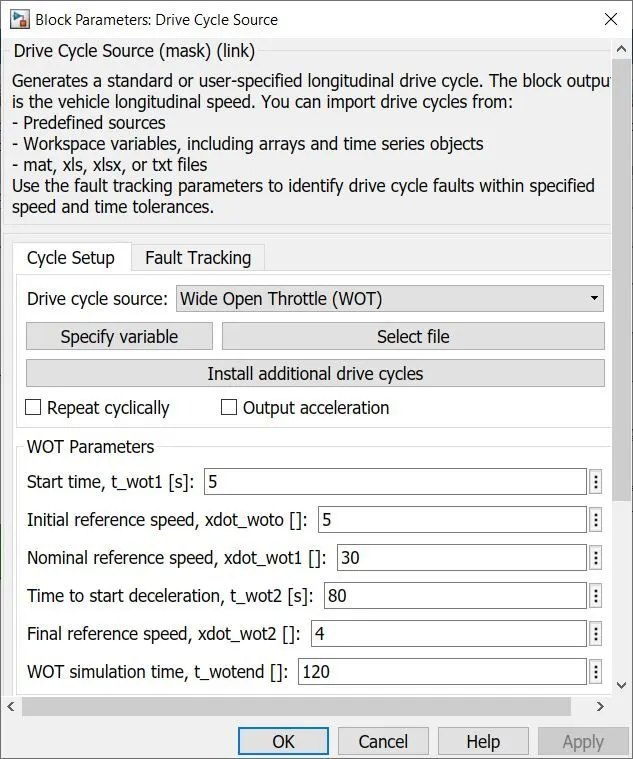
The initial conditions are set as shown in the figure above and the simulation time is set to 120 seconds.
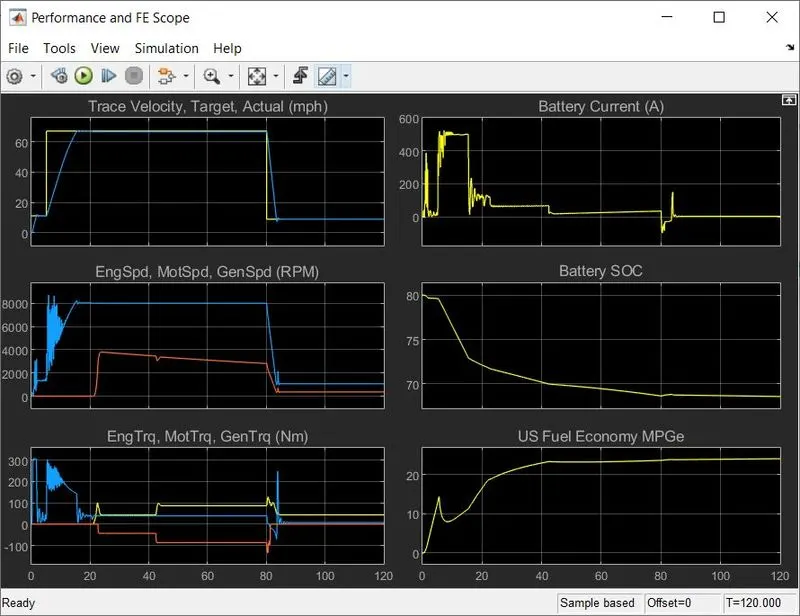
At first the simulation is carried out without affecting the environmental block. The results of WOT without changes are shown below. Unchanged: (Graph-1)
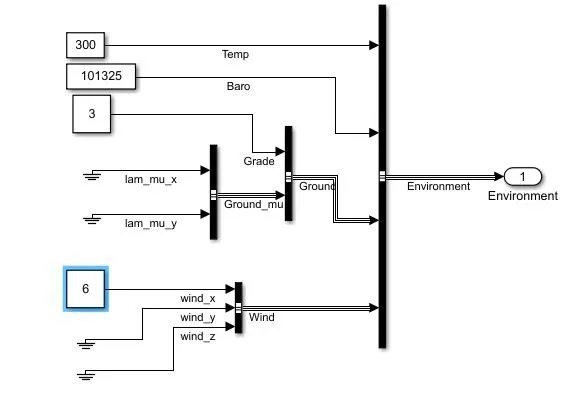
Now, by changing the values of environmental blocks as stated, the grade value is changed from 0 to 3 m/s and the wind value is increased from 0 to 6.
Results of the graph with changes refelected in the output is shown below. With both these graphs we can compare the results.
Changed: Graph-2
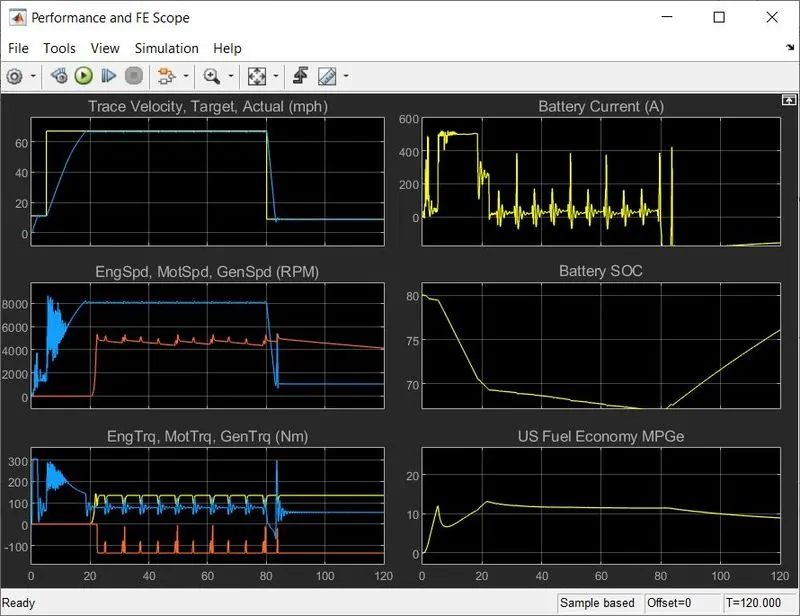
For comparison we consider graph-1 without environmental changes and graph-2 with environmental changes.
- For the vehicle to reach the nominal speed it takes 15 to 16 seconds in case of graph-1, whereas in graph-2 it takes a little longer than the previous case (say 18 to 20 secs) due to the increase in grade and wind values.
- The battery current deviations are in accordance with the vehicle movement i.e., when the vehicle accelerates it consumes more current and when there is constant speed the drawn current limit also remains same and when it decelerates the current goes negative, in this case it indicates the battery charging due to regeneration from deceleration.
- from grah-1 it shows that vehicle draws much battery current until the nominal speed is achieved and later the usage was minimum. In case of graph-2 the battery current fluctuations was repeated relefecting the torque characteristics until deceleration took place.
- The battery SOC dropped below 70 in case of graph-1 and hardly a little recharging took place due to regeneration, whereas, in graph-2 the SOC dropped below 70 and after deceleration it was restored to 77% SOC where the down grade causes more regeneration.
- The fuel economy for the graph-1 was maintained in the range of 10-20 MPGe. In graph-2 it fell aroud 8 to 12 MPGe.
4.Keeping all other parameters same, compare the simulated results of hybrid and pure electric powertrains.
The main system model looks the exact same model as the hybrid.
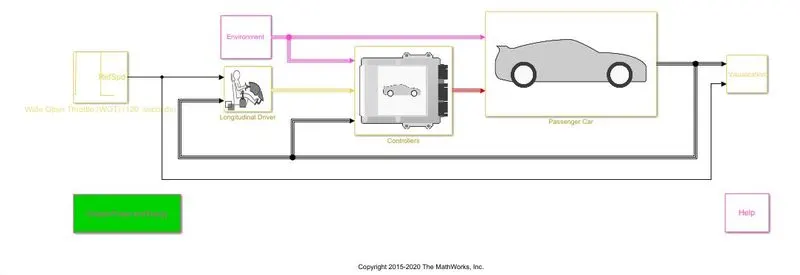
Keeping all the conditions same, we are choosing the WOT for the drive cycle and plotting the conditons same as hybrid model.
Changing the environment parameters, grade from 0 to 3 m/s and wind from 0 to 6.
Results of the pure EV vehicle based on the input WOT condition and the changes in grade and wind is shown below.
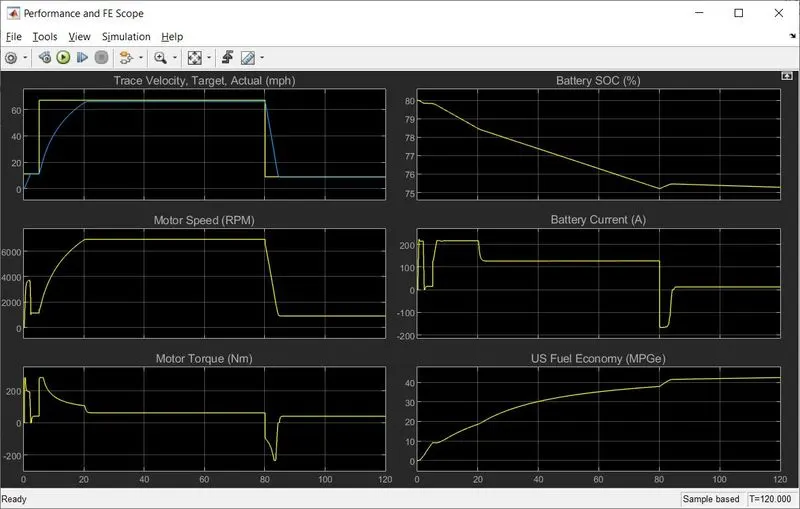
To reach the nominal speed it took much more time 22 seconds than the HEV. From the graph we can infer that the maximum speed achieved by the EV is lesser than the HEV. The fuel economy is much better than HEV. Not much difference in regenerative charging is seen as it is pure EV and uses battery as source for acceleration. Motor rpm is decrease in EV and it as as generator in case of deceleration shown in plot 3 graph.
Conclusion:
These pre-built models along with different variants for subsystems give us much insight about the vehicle parameters and what to be chosen. By altering the models based on our requirement we are able to analyze the vehicle and to decide if motor, generator can be chosen. Power and energy requirement can be easily calculated in these models and gives a better clarity for comparison and to find the better choice.
References:
https://in.mathworks.com/help/autoblks/ug/hev-multimode-reference-application.html
https://in.mathworks.com/help/autoblks/ug/electric-vehicle-reference-application.html