Week - 4
Introduction:
Stateflow can be best explained as a graphical representation of a machine consisting of states, transitions, and conditions. A Stateflow chart can be created to define how a MATLAB or a SIMULINK model reacts to external input signals, events, and time-based conditions.
#Objective A:
A washing machine has several processes to run, step by step. For instance:
- Checking if the power is on
- Checking if there is a sufficient supply of water for the entire wash
- If the above two are true, soak the clothes in water to prepare for washing
- Wash for a certain period
- Rinse for a certain period
- Dry the clothes for a certain period
Although many more complicated conditions are there in running the washing machine, the above is a very simple representation to give insight into the logical flow of the machine.
Below is a Stateflow chart to indicate the procedures:
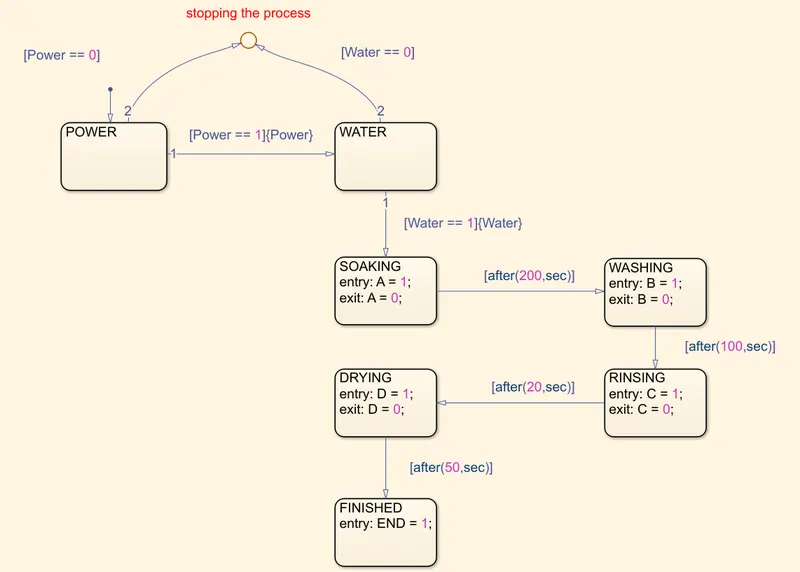
- The boxes represent the different states the machine goes through
- If given conditions are met (if any), the machine moves on to the next state. For instance, only if power and water are both on, the machine will move on to the remaining procedures.
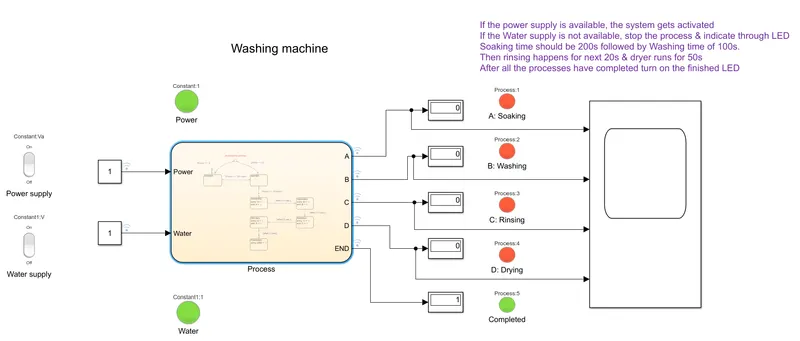
The entire setup looks like this:
Output when the power supply is on and water supply is also on:
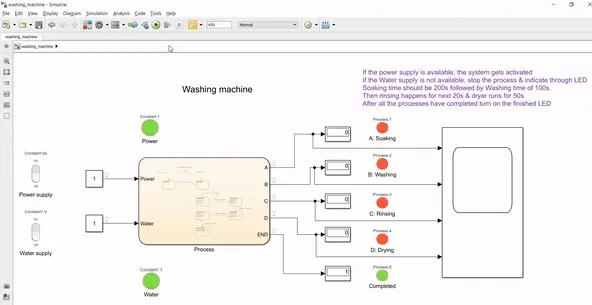
- In the live media above, it is evident how the machine moves from one process to the next once the simulation is run.
- It is indicated by a green LED as soon as one process is complete, while a red LED indicates that the process is not active at that moment.
- The Stateflow chart in yellow is designed according to the problem statement in purple.
Output:
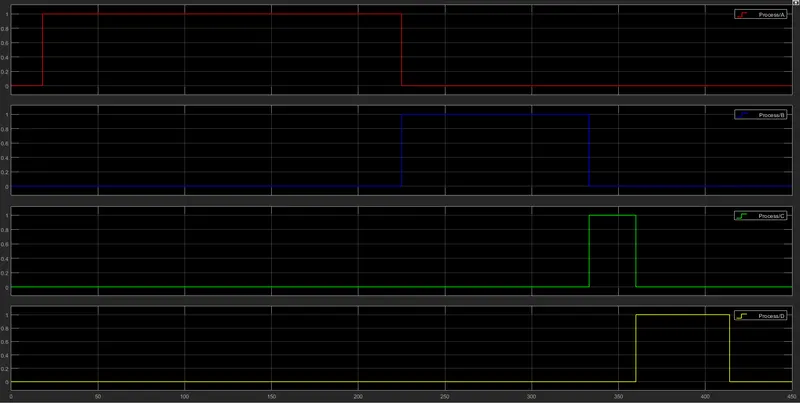
- Process A, B, C, D represent soaking, washing, rinsing, and drying, respectively.
- When the output line is at 0, it means that specific process has either not been activated yet or has been completed already. While the output line is at 1, it means the process is in motion
- According to the problem statement, the clothes needed to be soaked for 200 seconds, washed for 100 seconds, etc, which is what is seen in the output. As soon as soaking is completed (red line goes from 1 to 0), washing is activated (blue line goes from 0 to 1), and so on.
Output when the power supply is on but water supply is off:
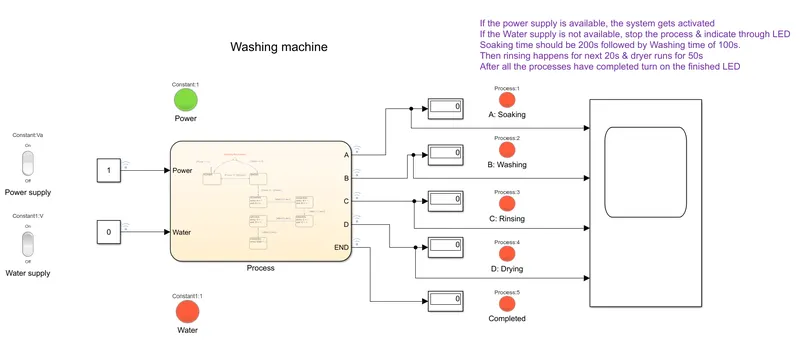
- No processes will run
Output when the water supply is on but power supply is off:
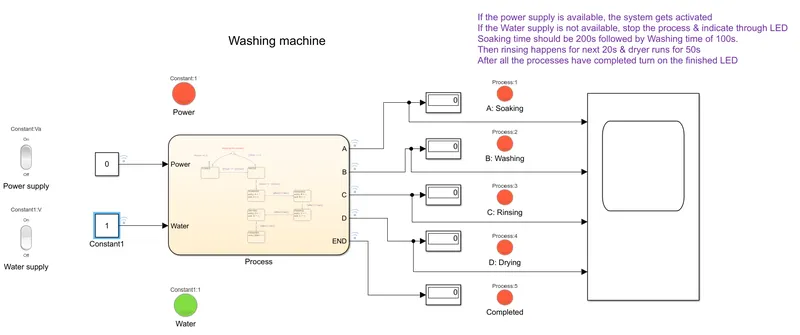
- No processes will run either, since both need to be turned on.
#Objective B:
The gear shifting mechanism in an automatic transmission uses sensors to determine when the gears need to be shifted. As the gas pedal is pressed to increase speed, the surface area of the throttle increases to allow more fluid to flow, hence generating more power through the transmission.
The entire setup looks like this:
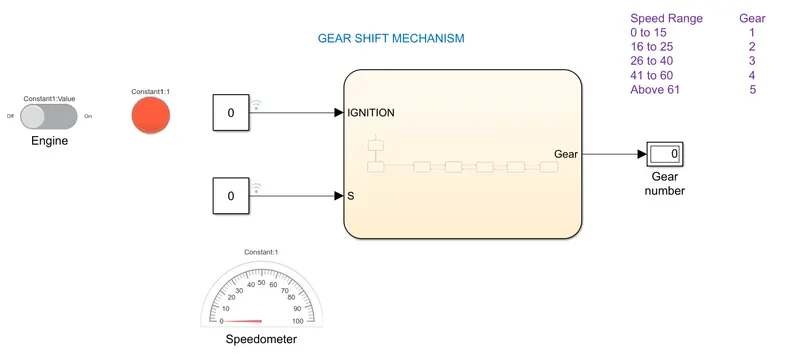
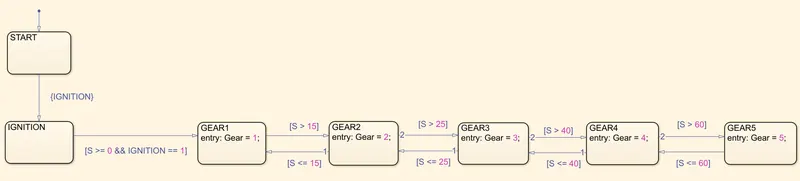
Stateflow chart for the gear shift criteria indicated in purple in the figure above:
Output when engine is turned off i.e. no ignition:
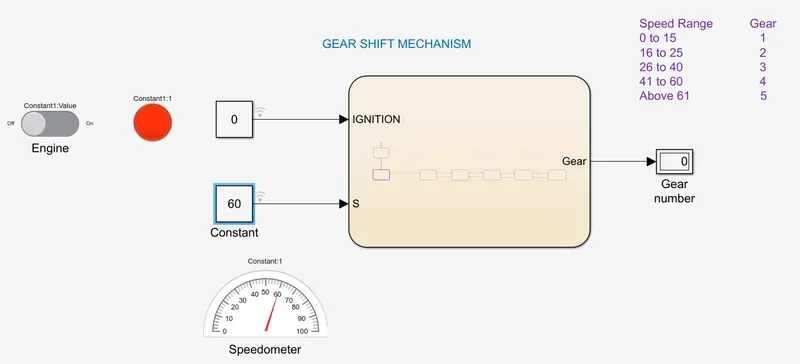
- In this case, even if there is an input speed of 60 as is evident, the gear won't change, since the engine isn't turned on yet
- Mimics the procedure of an actual car
Output when engine is turned on and speed is 15:
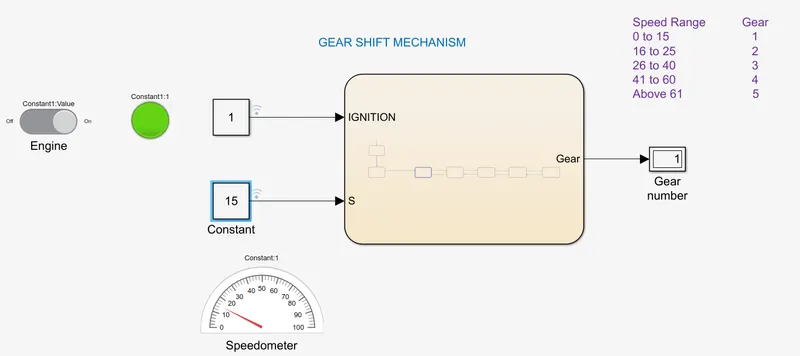
- Gear 1 in operation
Output when engine is turned on and speed is 25:
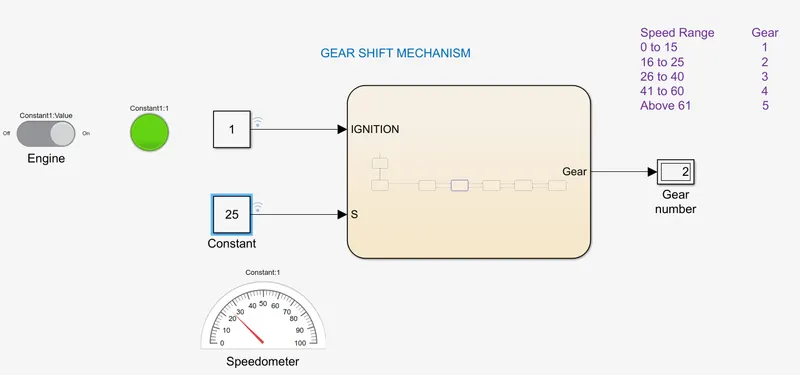
- Gear 2 in operation
Output when engine is turned on and speed is 40:
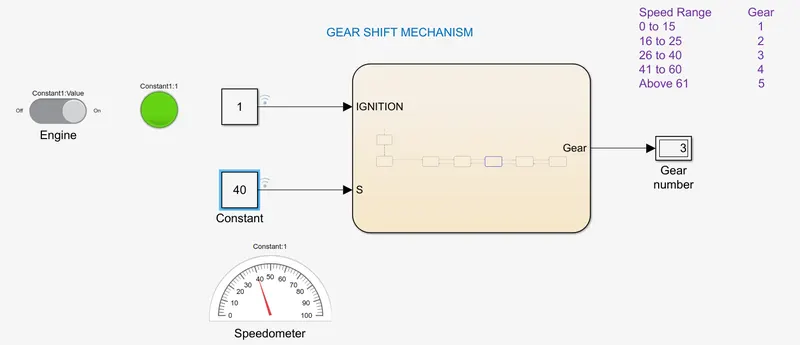
- Gear 3 in operation
Output when engine is turned on and speed is 60:
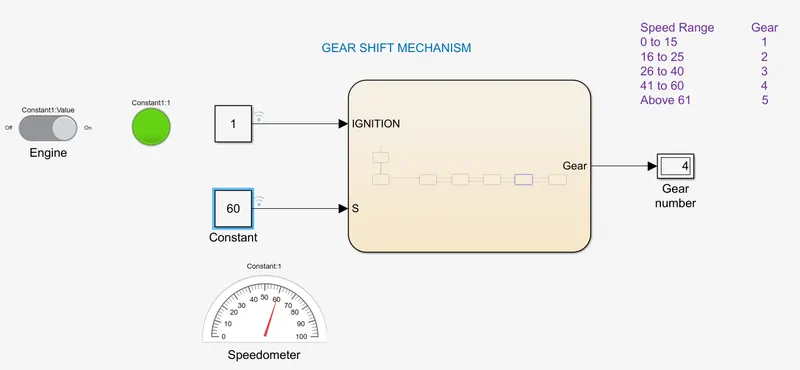
- Gear 4 in operation
Output when engine is turned on and speed is 100:
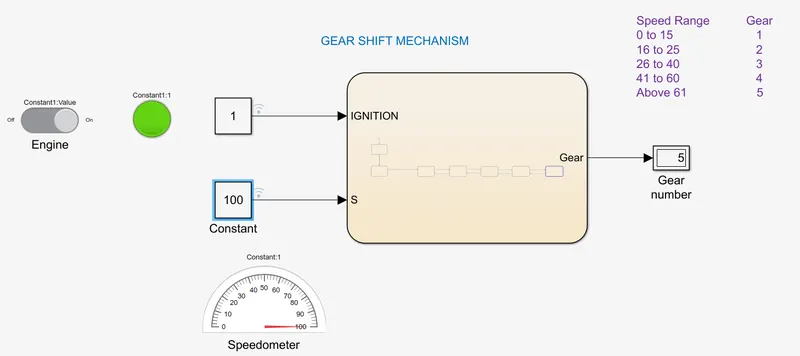
- Gear 5 in operation