Week-4 Challenge WOT Condition Part-2
AIM
- To expalin the difference between mapped and dynamic model of engine, motor and generator and to explain the steps to change model type.
- To explain the calculation of miles per gallon on the model and factors are considered to model fuel flow.
- To run the HEV Reference Application with WOT drive cycle and to change the grade and wind velocity in the environment block and to compare both the results.
- To run the EV Refrence Application by keeping all other parameters same, and to compare the simulated results of hybrid and pure electric powertrains.
POWERTRAIN BLOCKSET
Powertrain Blockset provides fully assembled reference application models of automotive powertrains, including gasoline, diesel, hybrid, and electric systems. It includes a component library for simulating engine subsystems, transmission assemblies, traction motors, battery packs, and controller models. Powertrain Blockset also includes a dynamometer model for virtual testing. MDF file support provides a standards-based interface to calibration tools for data import. Powertrain Blockset provides a standard model architecture that can be reused throughout the development process. You can use it for design tradeoff analysis and component sizing, control parameter optimization, and hardware-in-the-loop testing. You can customize models by parameterizing components in a reference application with your own data or by replacing a subsystem with your own model.
1. The difference between Mapped and Dynamic model of engine, motor and generator and the steps to change model types.
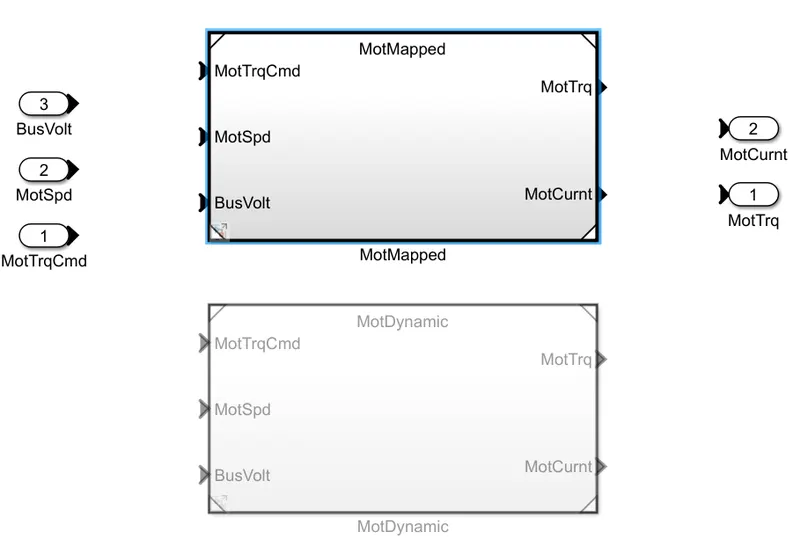
MAPPED Model type:
Mapped engines represent macro engine behavior as a set of lookup tables (brake torque, fuel flow, air mass flow, exhaust temperature, efficiency, and emissions) as functions of commanded load and measured engine speed. In short, If we have our motor data we can map the data to this particular file and run your simulation with the available data. Thus already pre-defined or verified data entered into the model to get the output.
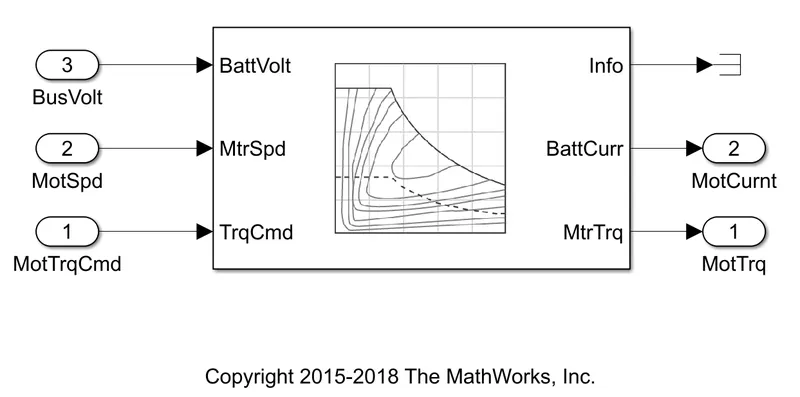
Mapped model of motor.
DYNAMIC Model type:
Dynamic engines decompose engine behavior into individual component models that account for engine dynamics, most notably intake airflow and turbocharger dynamics. Dynamic condition is used when we want to run the actual model. The dynamic model is going to represent the actual model.
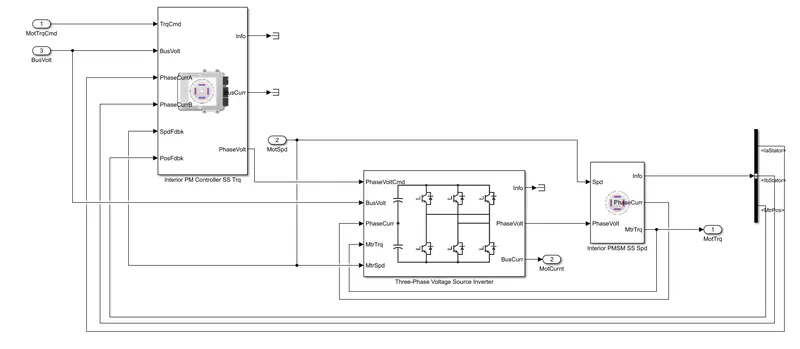
The Mapped model runs faster while comparind the dynamic as it runs with the data given in the lookup table.
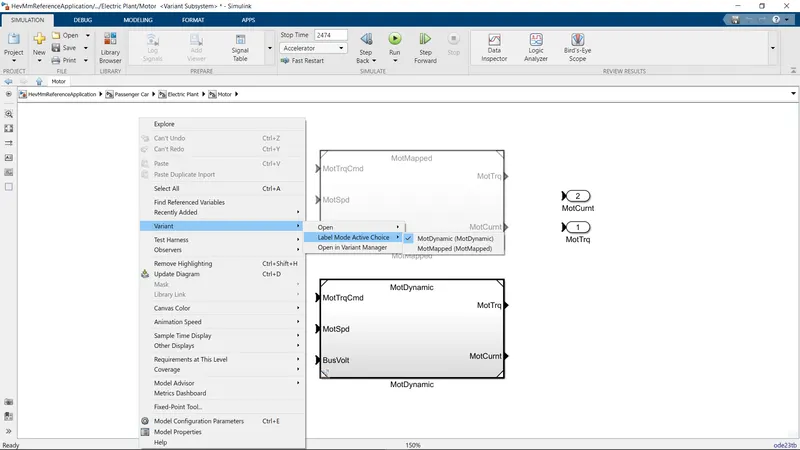
Steps to change model types :
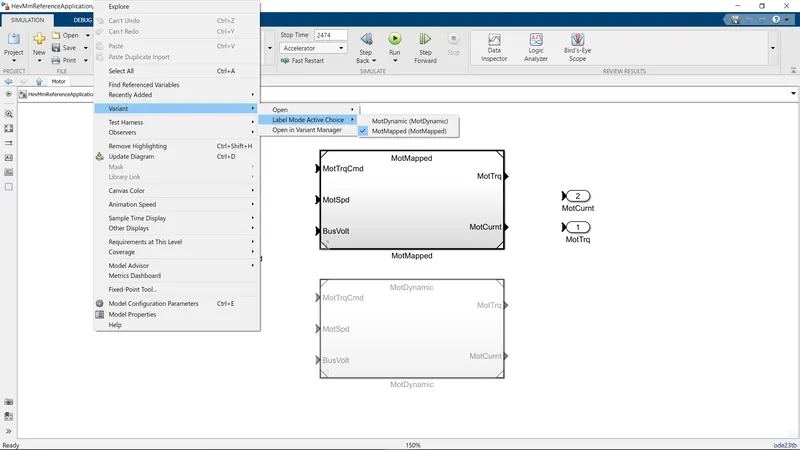
Now Mapped tyoe is enabled To enable the dynamic type.
- Right click on the screen.
- Under variant, please select Label Mode Active Choice.
- Under that just enable the model type you want to change.
- Now the dynamic type is enabled. The screenshot is attached below.
2. The calculation of miles per gallon on the model and factors are considered to model fuel flow.
Calculation of miles per gallon :
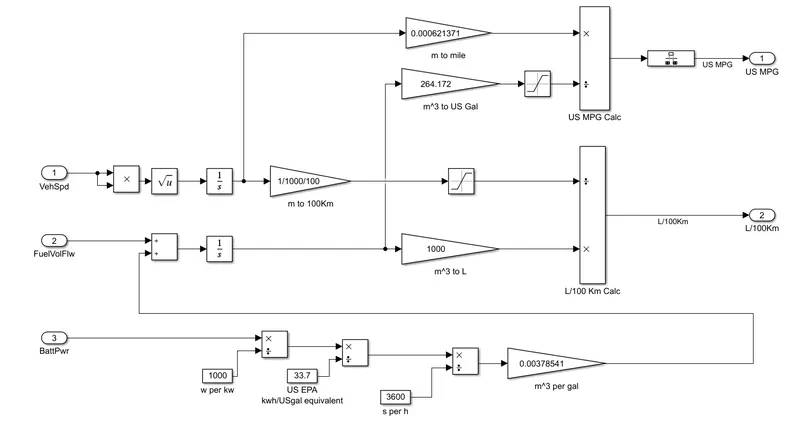
Factors that are considered to model fuel flow :
- Vehicle Speed.
- Fuel Volume Flow.
- Battery Power.
Vehicle Speed :
- Here the first input is Vehicle Speed comes with the unit m/s.
- Its the multiplied with it again using product block and the results will be in (m/s)^2 and taken square root where we will be getting the same value again in m/s.
- Then it is integrated with respect to time from which we get Distance with unit m.
- Then using Gain block, metre is converted to 100km, to which first m is converted to km so it is divided by 1000. Then it is taken for 100km so now it is again divided by 100. NOw atlast 100km=10000m.
- Then using Saturation block, the input signals is limited to the upper and lower saturation values and that value is directed to the next stage.
Fuel Volume Flow :
- Fuel volume flow comes with the unit m^3/s.
- It is integrated with respect to time so we get the m^3.
- Then using Gain block we are multiplying it with 1000 to convert the m^3 to L, then directed to the next stage.
Battery Power :
- Battery power comes with the unit of Watt, then it changed to Kilowatt by dividing it with 1000.
- The ratings are based on EPA's formula, in which 33.7 kilowatt hours of electricity is equivalent to one gallon of gasoline. So here We are converting it to US gal by dividing the value with 33.7
- The value is in seconds we are converting it to the hour basis, so we are dividing it by 3600.
- And finally we are multiplying it with the Gain block with the value 0.00378541 to get m^3/gallon.
- Thus this is Hybrid Electric Vehicle, Battery power is considered with along with the Fuel Volume Flow to convert it to the Litre.
- Now the output from the Fuel Volume Flow and Vehicle speed to directed to find the Litres per 100Km. The 100Km is divided to the Litres.
- The distance which is integrated from the velocity is directed and converted it to the miles.
- Here 1 metre = 0.000621371 miles, so here it is directed to the gain blocknby multiplying it with 0.000621371 to convert it with miles.
- Cubic metre which is intergrated from the Fuel Volume Flow is converted to US Gallon where Cubic meter is multiplied with 264.172 to get the US Gallon.
- Now miles and US gallon is subjected to divide the US Gallon from Miles, thus we get Miles per Gallon.
- Thus the calculation for Miles per Gallon is explained.
3. HEV Reference Application with WOT drive cycle and to run by changing the grade and wind velocity in the environment block and to compare both the results.
HEV REFERENCE APPLICATION
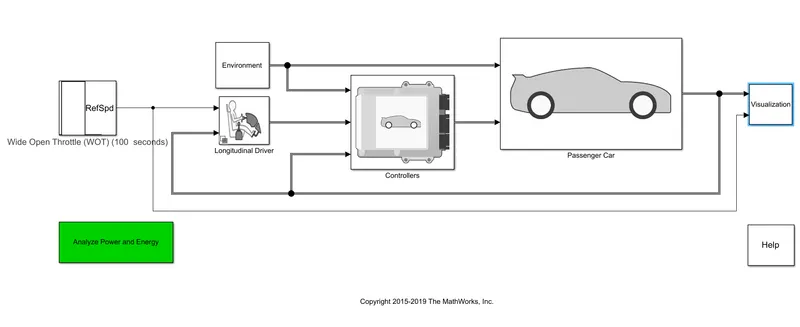
This is predefined model downloaded from the POWERTRAIN BLOCKSET applications.
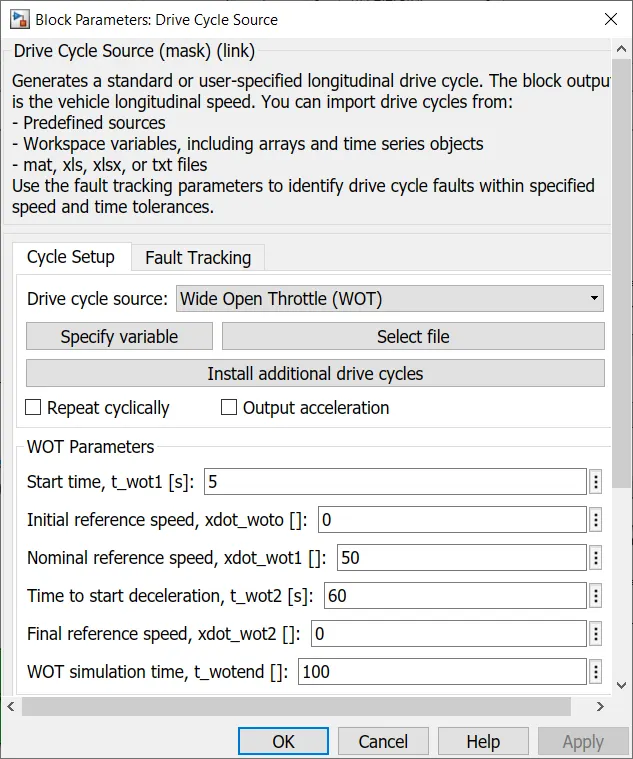
WOT Parameters: Wide Open Throttle
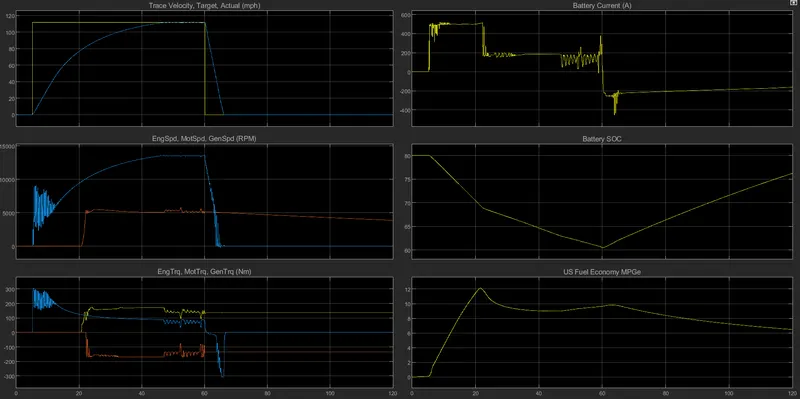
OUTPUT PERFORMANCE AND FUEL ECONOMY SCOPE :
OBSERVATION:
- Here Trace velocity,Target,Actual, Battery Current, Engine Speed, Motor Speed, Battery SOC, Engine Torque, US Fuel Economy with respect to time graphs were plotted.
Trace velocity, Actual velocity (mph) vs Time
- We applied a step command thus the full velocity is achieved with no time, this is called as Wide Open Throttle condition.
- The vehicle reaches the maximum speed at 46th second. The reason for the time delay for the vehicle to reach the maximum speed depends on the motor capacity.
- And after 60th second the vehicle starts decelarating and comes to the idle position.
- The time taken for the vehicle to decelrate is 6.45 seconds.
Battery Current (A) vs Time
- The reason for having less acceleration time is the maximum motor power. The limiting factor here is Current.
- If the current is going in negative, it indicates that the vehicle is decelarating and the brakes are applied.
Battery SOC vs Time
- The battery first loses charge since the vehicle is accelerating and when the deceleration starts the SOC is said to increase that is the battery is getting charged.
US Fuel Economy (MPG) vs Time
- The MPG have dropped after 20seconds because the engine is running and obviously the engine efficiency is lower than the motor efficiency and therefore the curve falls in the US Fuel Economy plot.
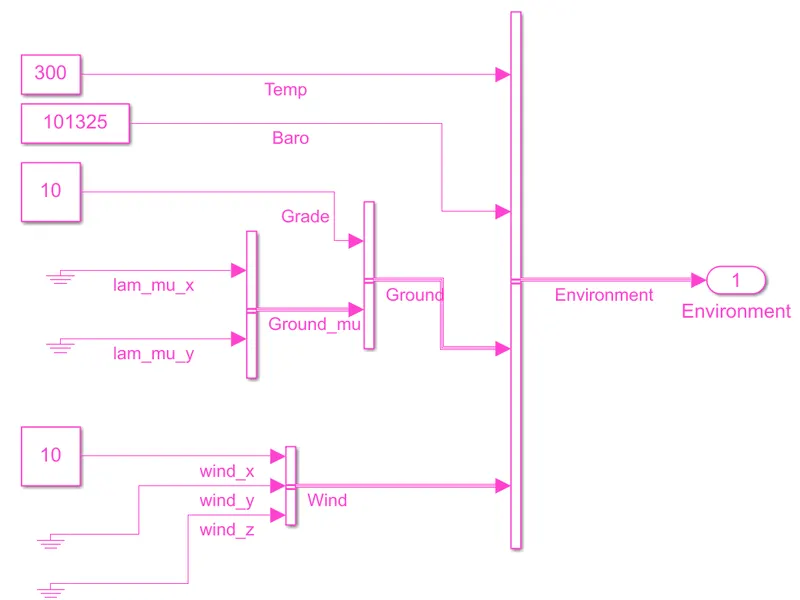
Now the grade and wind velocity in the environment block is aasigned
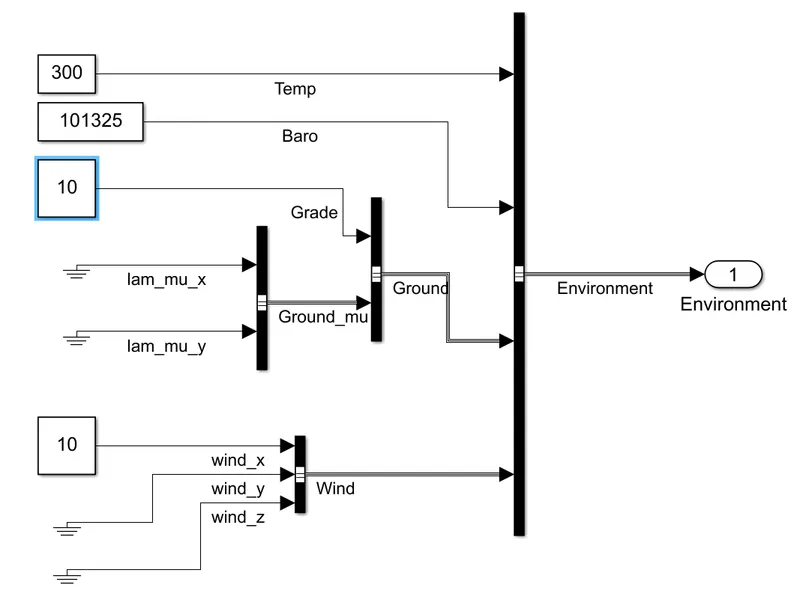
Grade is assigned as 10 and Wind velocity is given as 10.
PERFORMANCE AND FUEL ECONOMY SCOPE :
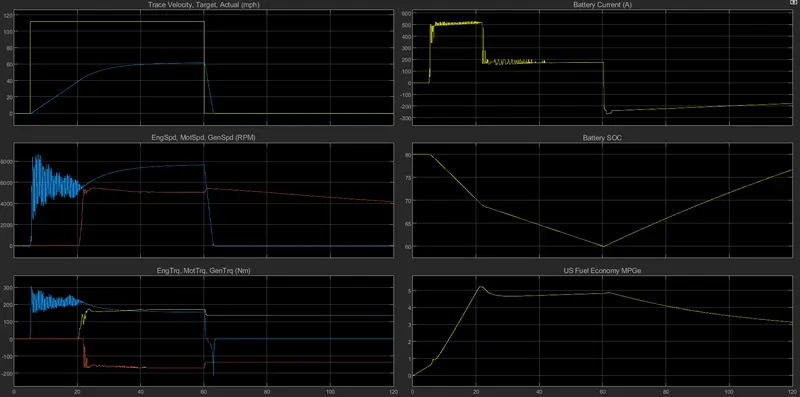
Trace velocity, Actual velocity (mph) vs Time
- Here the vehicle's maximum speed is reduced to 60miles since the grade and wind velocity have been assigned and these are the factors affecting the vehicle's maximum speed.
Battery SOC (A) vs Time
- At the 60th seconds the batery SOC comes to the atmost lower point of 60 and then while the vehicle starts decelerates the SOC increase indicating the charging mode of battery.
While comparing both the results it is clear that the gradeability and the wind velocity made an impact on the velocity to achieve its maximum speed and US Fuel Economy is muc lesser while iving grade and wind velocity than the at normal condition. Rest other factors remains the same approximately.
4. The EV Refrence Application by keeping all other parameters same, and to compare the simulated results of hybrid and pure electric powertrains.
EV Refrence Application :
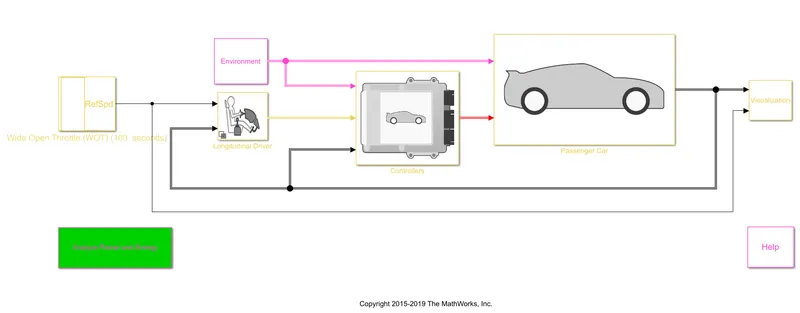
WOT Parameters were same and the same values were assigned for grade and wind velocity.
PERFORMANCE AND FUEL ECONOMY SCOPE :
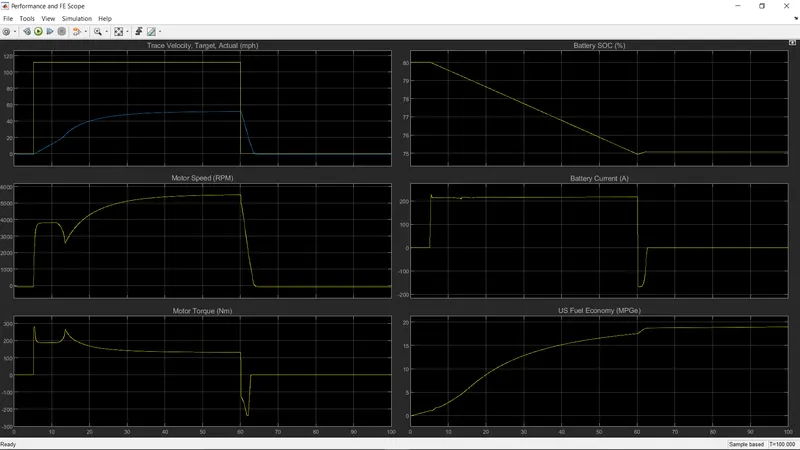
- Here the vehicle can reach upto 50miles as it maximum speed and here also the grade and wind velocity were the factores affecting the speed.
- The Battery SOC is also reduce for 75% and becomes constant as the vehicle starts decelerating.
- Naturally in EV, will not be using the fuel but this is a comparison how many miles per gallon of equivalent energy will be used. In case of Pure EV, this valuesare really really above 100 miles per gallon in normal condition.
- If the current is going in negative, it indicates that the vehicle is decelarating and the brakes are applied and the vehicle is operating in regenerative braking mode.
- It is generating torque which is negative in nature.
- And the Speed is in positive and the torque in negative, The product of thse two brings the power which is also in negative indicates that the battery is getting charged and the motor as generator.
COMPARISON
While comparing HEV and EV reference application simulation for the assigned drive cycle and input values,
- HEV achieves 60miles as the maximum speed wile the EV reaches 50miles only for the same parameters.
- Battery current used is 220 A in EV while in HEV 500A were used.
- Battery SOC in EV is upto 75% and in HEV it is upto 60% used.
- US Fuel Economy in HEV is aprrox 5 MPG is highest point and in EV 18 MPG is the highest peak.
ADVANTAGES OF EV:
Electric vehicles offer several advantages over plug-in hybrids. The main attraction is that electric vehicles benefit the environment more than plug-in hybrids, since they don’t use any fuel at all.
ADVANTAGES OF HEV:
While a plug-in hybrid can usually travel 30 or 40 miles on fully electric power and an extra 200 to 300 miles on gasoline, most electric vehicles are limited to 60 to 70 miles of total range. That means drivers with a long commute, or those who routinely travel more than 60 to 70 miles without overnight stops, would be wise to consider a plug-in hybrid instead of an EV.
CONCLUSION
- The difference between Mapped and Dynamic model of engine, motor and generator and the steps to change model types were clearly explained.
- The calculation of miles per gallon on the model and factors are considered to model fuel flow were also clearly explained.
- The HEV Reference Application with WOT drive cycle and to change the grade and wind velocity in the environment block were simulated and both the results were compared.
- The EV Refrence Application by keeping all other parameters same were simulated and the simulated results of hybrid and pure electric powertrains were comapared.