Week-4 Challenge WOT Condition Part-2
1. What is the difference between the mapped and dynamic models of engine, motor, and generator? How can you change the model type?
Mapped Models
The model uses a set of steady-state lookup tables to characterize engine performance.
The tables provide overall engine characteristics, including actual torque, fuel flow rate, BSFC, and engine-out exhaust emissions.
When to use:
If you have engine data from a dynamometer or a design tool like GT-POWER.
For quasi-steady-state engine simulations.
Dynamic Model:
The model decomposes the engine behavior into engine characteristics that are separated into lower-level components. By combining components in this way, the models capture the dynamic effects.
When to use:
If you need a more detailed dynamic model and have component-level data.
To analyze the impact of individual engine components on the overall performance.
How can you change the model type?
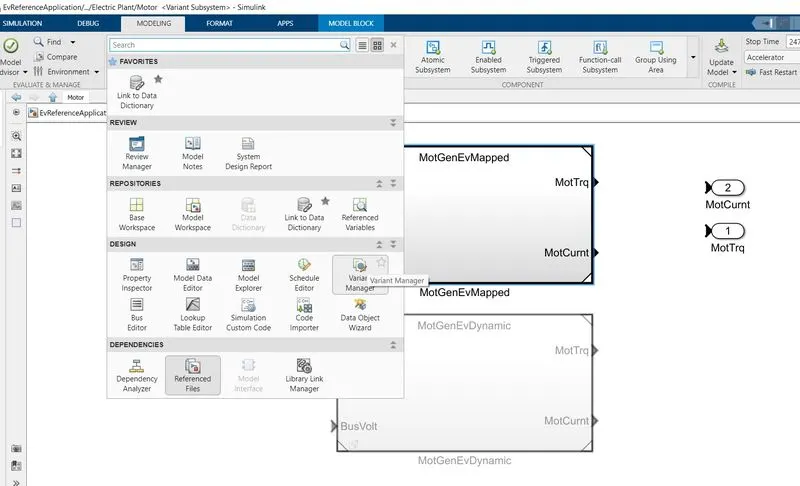
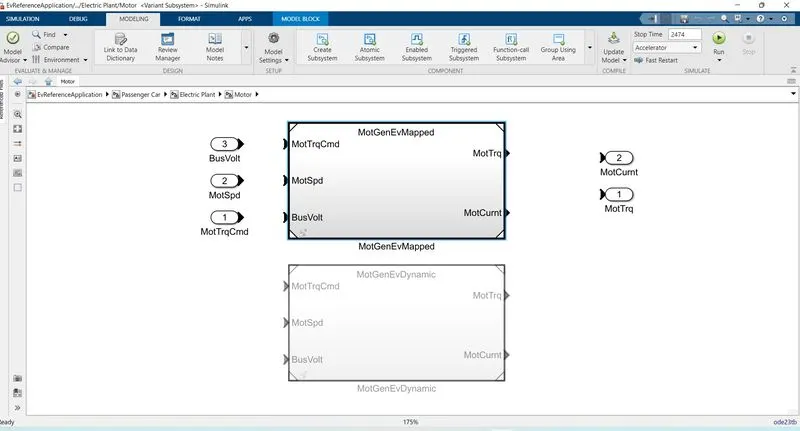
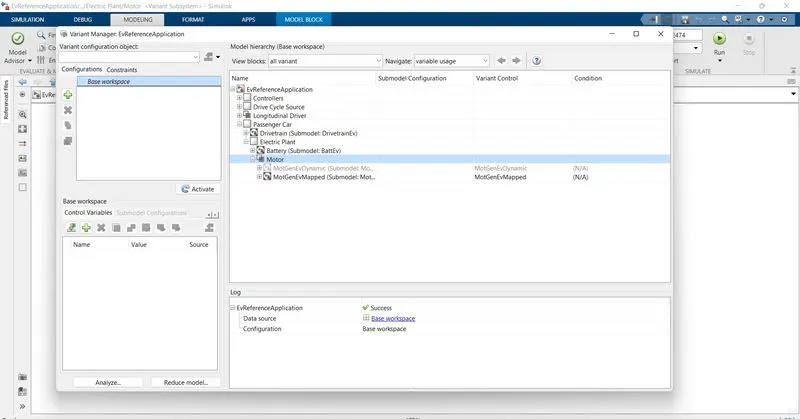
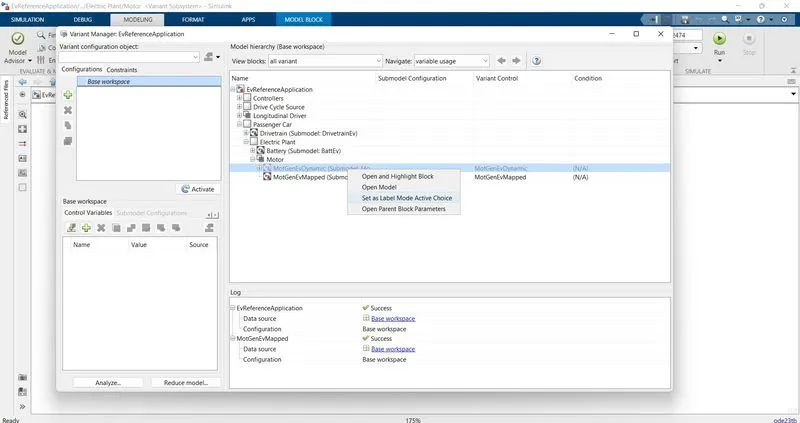
2. How does the model calculate miles per gallon? Which factors are considered to model fuel flow?
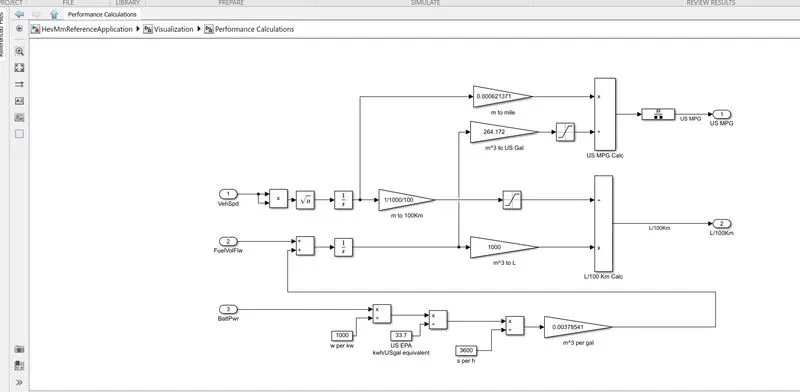
Calculate miles per 1 gallon to the same amount of energy is 33.7kwh of electricity
Battery power (x) in watts is divided by 1000 to get kilowatts and kilowatts is divided by 33.7kwh gallon which is equal to US EPU and kilowatts hours are converted to kilowatts sec by divided 3600 in kilowatts hour
The US EPU value and 3600-kilo watts second is multiplied by 0.00378 which is given as m^3/gallon and multiplied by 739 to converted m^3/gallon to kg/m^3 and fuel flow
miles per gallon = veh speed/fuel*bat power
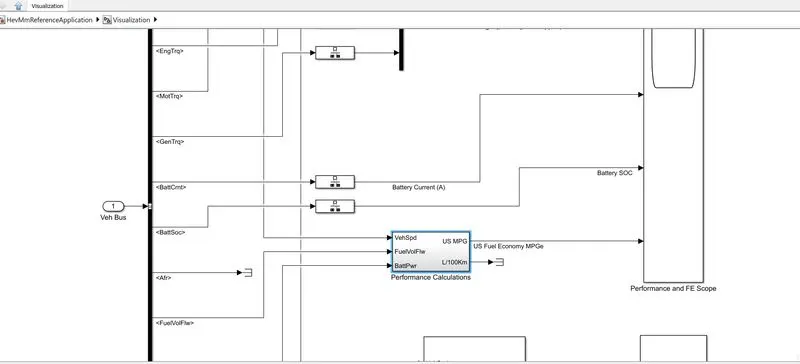
3. Run the HEV ReferenceApplication with WOT drive cycle. Change the grade and wind velocity in the environment block. Comment on the results.
Grade-0,Wind Velocity-0m/s in wide-open throttle (WOT)
Grade-5,Velocity10m/s
Grade-20,Velocity-35m/s
there are totally six plots, each plot shows a particular result and the plots are made in such a way that, there is a cursor measurement and if we change the cursor on one plot the cursor moves on the other plots too which paves way to study the result in a better way. the cursor enables us to study the behavior of other result parameters corresponding to the acceleration of the vehicle.
4. Keeping all other parameters the same, compare the simulated results of hybrid and pure electric powertrains.