Week-4 Challenge WOT Condition Part-2
- What is the difference between mapped and dynamic model of engine, motor and generator? How can you change model type?
Answer:
Powertrain:
- The Mapped engines represent macro engine behavior as a set of lookup tables (brake torque, fuel flow, air mass flow, exhaust temperature, efficiency, and emissions) as functions of commanded load and measured engine speed.
- Mapped engine models are suitable for analysis and design activities that do not require engine subsystem dynamic characteristics, for example, in engine and transmission powertrain matching analysis for fuel economy, emissions, and performance tradeoffs.
- It is based upon lookup tables and not the actual components .It is a steady state model and simulation takes less time due to simplicity.
The Dynamic Model:
- Dynamic engines decompose engine behavior into individual component models that account for engine dynamics, most notably intake airflow and turbocharger dynamics.
- Dynamic engine models are suitable for designing control, estimator, and diagnostic algorithms that depend on dynamic subsystem states, for example, in closed-loop AFR control algorithm development.
- It is based upon actual component model.Each component is modeled seperately and simulation takes more time due to complexity
Simulation Of HEV model:
How to Change the model type:
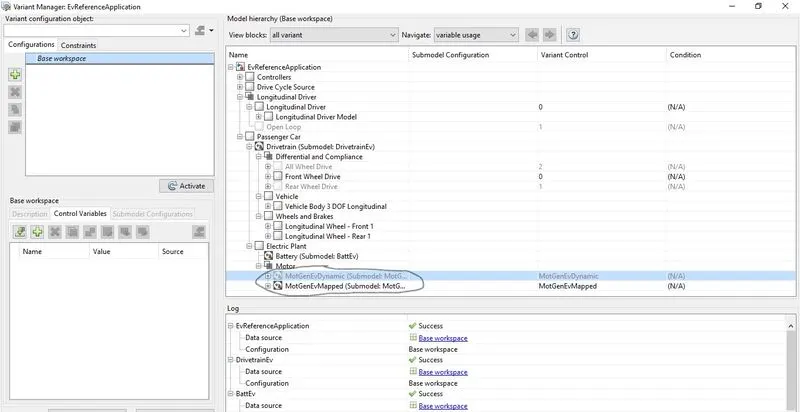
- Open the variant manager and choose electric plant ,we can change the model type..
- In this model dynamic data is not active..if we want dynamic datai s active , click it and go to the 'set as label model active choice ' ,then the dynamic data will get active..
2. How does the model calculate miles per gallon? Which factors are considered to model fuel flow?
Answer:
MPGe:
This abbreviation stands for “miles per gallon of gasoline-equivalent.” It measures the fuel efficiency of vehicles that run on non-liquid fuels, such as hybrid and electric models.. These fuels, such as compressed natural gas and electricity, are rated in MPGe as opposed to the standard miles-per-gallon. 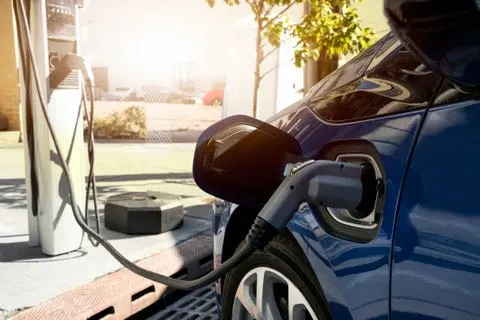
Miles per gallon gasoline equivalent is a measure of the average distance travelled per unit of energy consumed ..You do this by converting the total number of litres of fuel you've bought into gallons. Subtract the starting mileage from the final figure. Then you divide the number of miles you've covered by the gallons of fuel you've put in. This gives you miles per gallon.
Performance calculations:
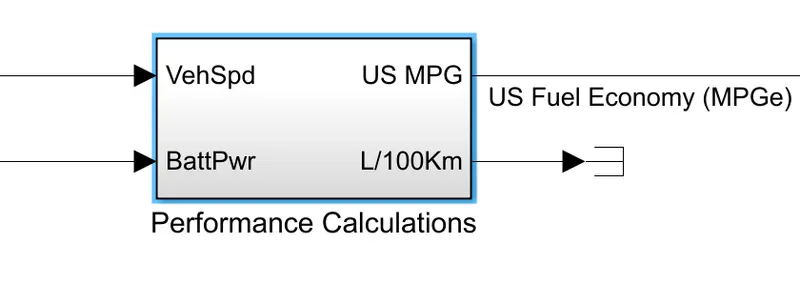
Formula :

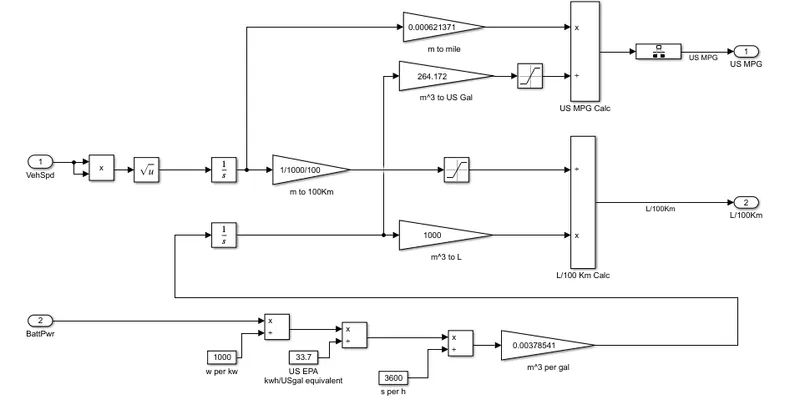
Factors in modelling A fuel flow:
The factors to consider to model the fuel flow are SI engine ,flue mass rate ,engine feed backout ,fuel low..
There are two major factors considered for the modelling of fuel flow ,they are as follows;
- Fuel Economy
- Fuel Consumption
Fuel Economy:
Fuel Consumption:
Answer:
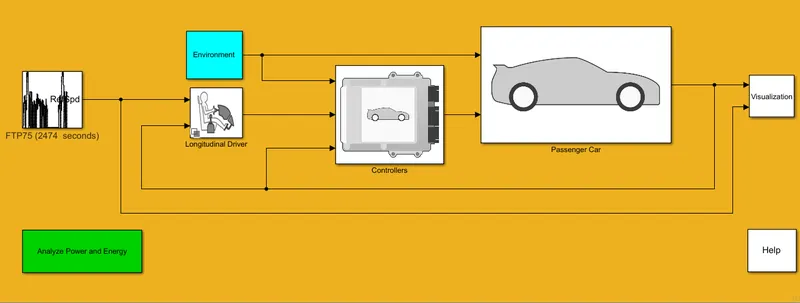
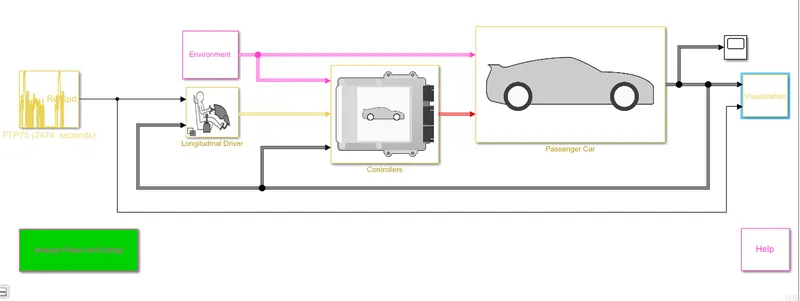
- In this case Simulation is regarding the HEV referance application with the Wide open throttle drive cycle
- It has Environment subsytem ,longidudinal drive subsytem,passenger car subsytem,controller sub system
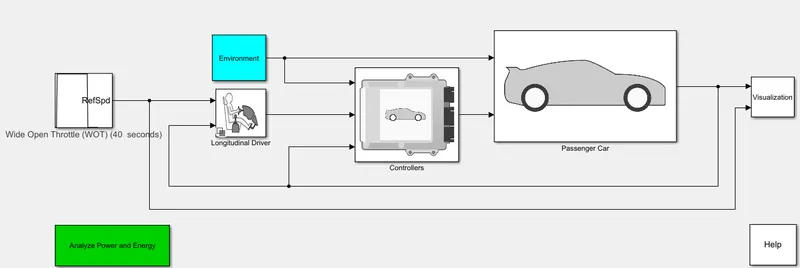
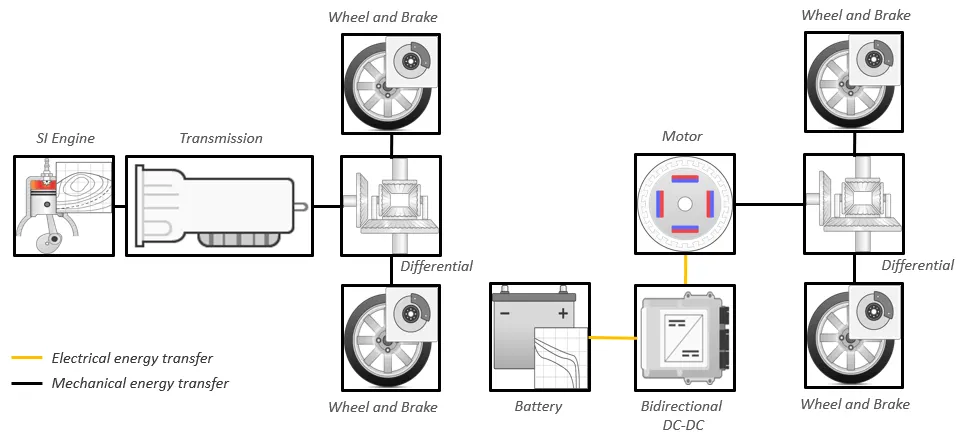
The hybrid electric vehicle (HEV) P4 reference application represents a full HEV model with an internal combustion engine, transmission, battery, motor, and associated powertrain control algorithms. Use the reference application for hardware-in-the-loop (HIL) testing, tradeoff analysis, and control parameter optimization of a HEV hybrid.
By default, the HEV reference application is configured with:
-
Lithium-ion battery pack
-
Mapped electric motor
-
Mapped spark-ignition (SI) engine
This diagram shows the powertrain configuration.
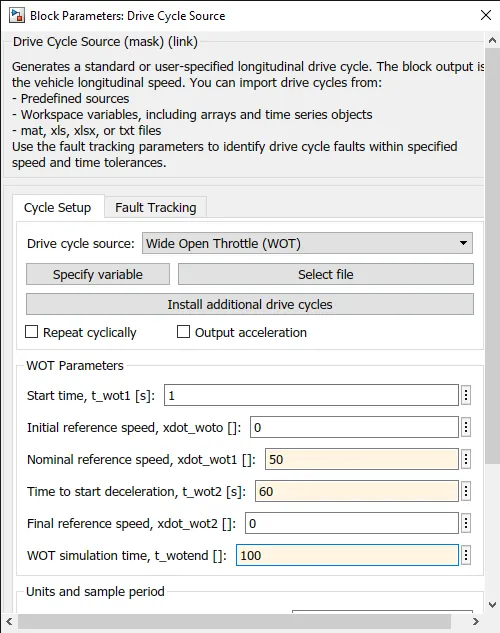
Here the drive cycle block is used to generate a specified drive cycle and we give the input as wide open throttle drive cycle ...changing parameters are given below
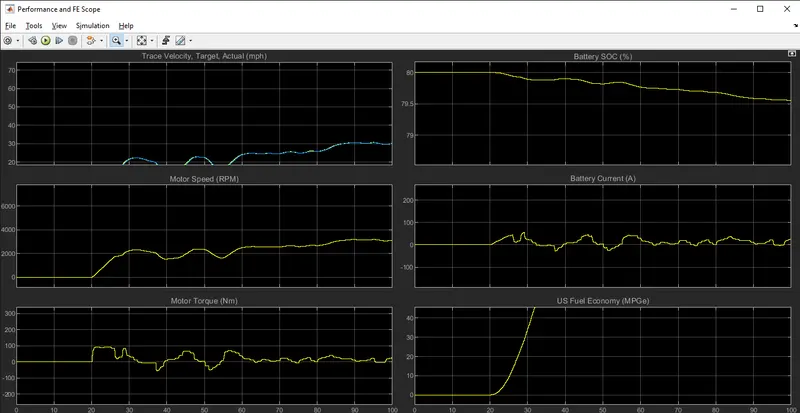
Results:
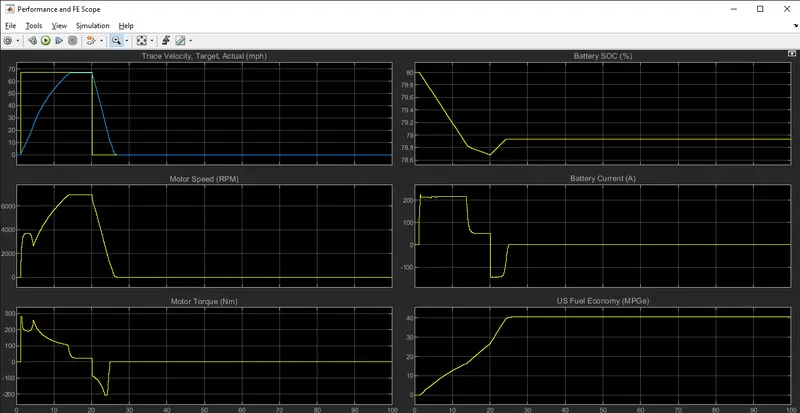
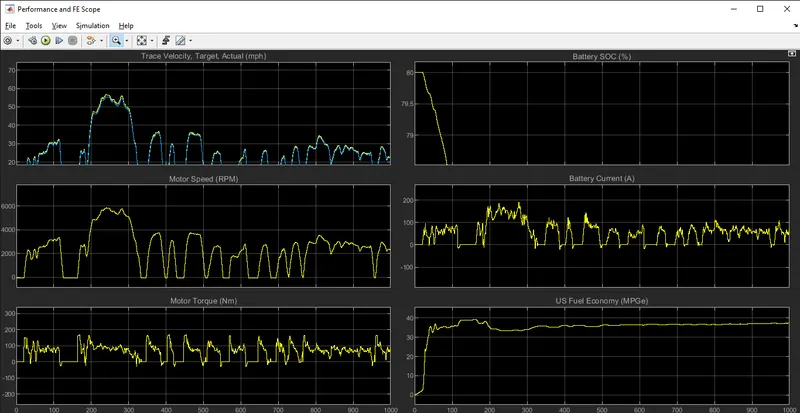
- The current increases initallly upto 200 above and decreases at 20seconds and after sometimes it gradually increases after 5 seconds.
- The battery SOC decreases from 80 to 76 seconds there is a little amount of increase when engine start works.
- The motor torque increases initially and goes negative value after 20 seconds..after it becomes to constant
- A fuel economy increases continously upto 40..
- A trace velocity is increased upto 65 and maintain constant till reach 20 sec ,after it wil be decreases and target actual(mph) is increased gradually then decreased
- The speed of the motor is increased step by step when it will be reach around 8000 rpm after it would be decreased .,.
Change the grade and wind velocity:
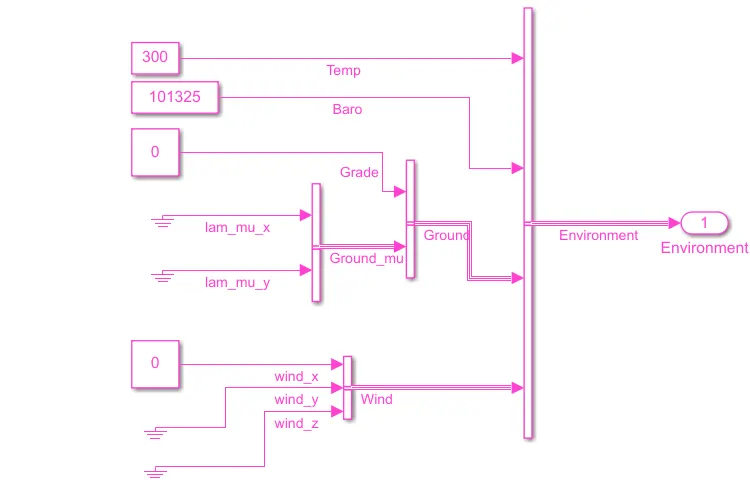
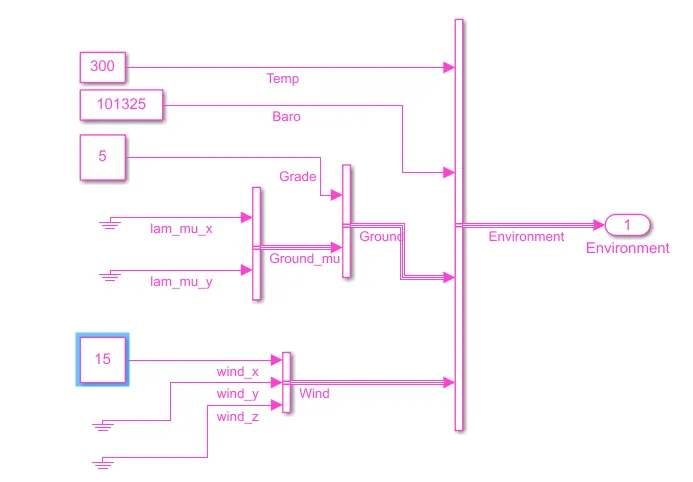
- Here I open environment susystem in the HEV reference application..
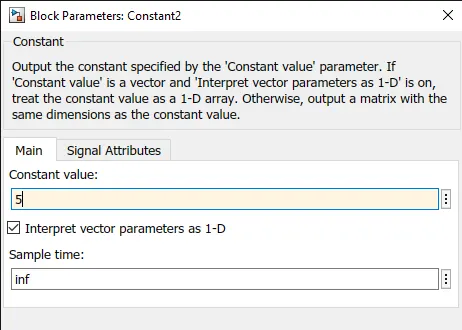
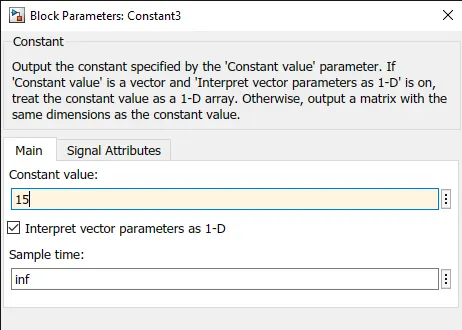
- And I change the grade is 5 and velocity is 15..
After changing the value:
Grade Value:
Wind Velocity Value:
After changing the value:
Result:
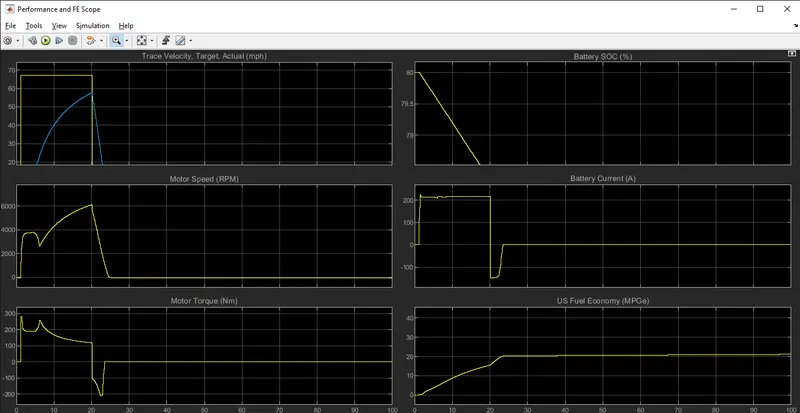
- The current increases initallly upto 200 above and decreases at 20seconds and after sometimes it gradually increases after 3 seconds.
- The battery SOC decreases from 80 to 70 seconds there is a little amount of increase when engine start works.
- The motor torque increases initially and goes negative value after 20 seconds..after it becomes to constant
- A fuel economy increases continously upto 20..
- A trace velocity is increased upto 65 and maintain constant till reach 20 sec ,after it wil be decreases and target actual(mph) is increased gradually then decreased
- The speed of the motor is increased step by step when it will be reach around 6000 rpm after it would be decreased .
4. Keeping all other parameters same, compare the simulated results of hybrid and pure electric powertrains.
Answer:
Power Train Configuration:
- In this case Simulation is regarding the HEV referance application with the Wide open throttle drive cycle
- It has Environment subsytem ,longidudinal drive subsytem,passenger car subsytem,controller sub system
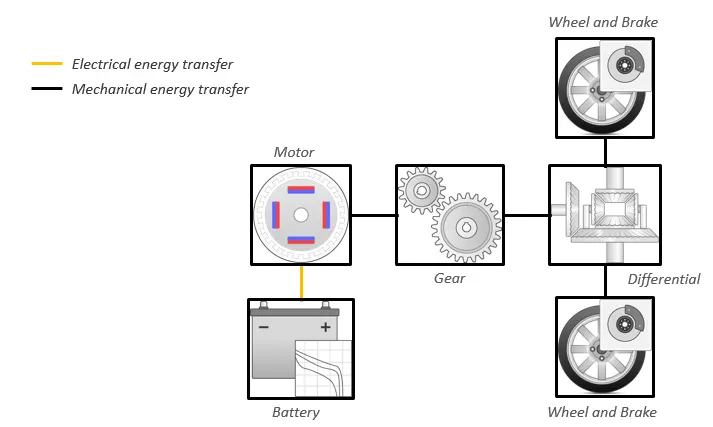
Diagram:
Before change the value:
Result:
After changing the value:
Result :