WOT Condition Part-2
Aim
To simulate hybrid and pure electric vehicle and to understand the power train block set.
Objectives
- To explain the difference between mapped and dynamic model of engine, motor and generator. how can we change model type?
- How does the model calculate miles per gallon? Which factors are considered to model fuel flow?
- Run the HEV reference application with WOT drive cycle. Change the grade and wind velocity and commend on the results.
- Keeping all the parameters same, compare the results of hybrid and pure electric power trains.
Theory & Simulations
- Explanations
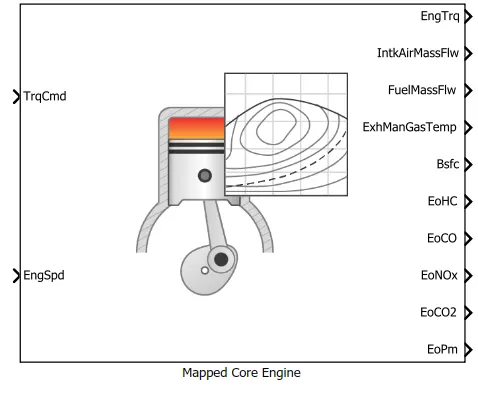
Mapped model of engine uses a set of steady state lookup tables to characterise macro engine behaviour. The table provides overall engine characteristics including actual torque, fuel flow rate, exhaust emissions and fuel consumptions. It is used for quasi steady state simulations.
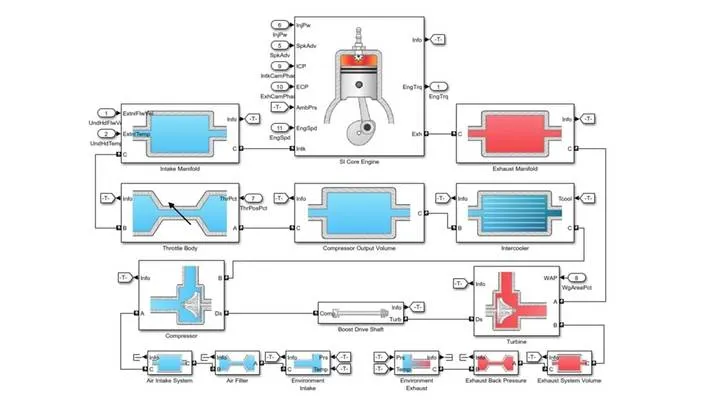
Dynamic model of engine decomposes the engine behaviour into engine characteristics that are separated into lower level components. By combining components in this way, the model captures the dynamic effects. It uses to analyze the impact of individual engine components on the overall performance.
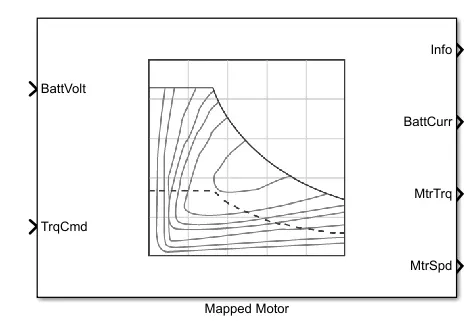
Mapped model of motor implements a drive electronics operating in torque control mode and it specifies toque range with a torque speed envelope. Output torque tracks a torque reference demand and includes a motor and drive response time constant. It specifies electrical losses as a single operating point that estimates loss across the operating range, measured loss or measured efficiency.
Dynamic model of motor takes data inputs from user. It takes three phase input voltage to regulate individual phase current. Mapped generator is also similar to above mentioned blocks. It also takes input parameters from lookup tables. In case of dynamic generator, it takes input from the user. So it is more accurate that mapped system and it will take more time to simulate.
During simulation, we can change the type of model. For that, primarily we need to select the variant manager option. The representation is given below.
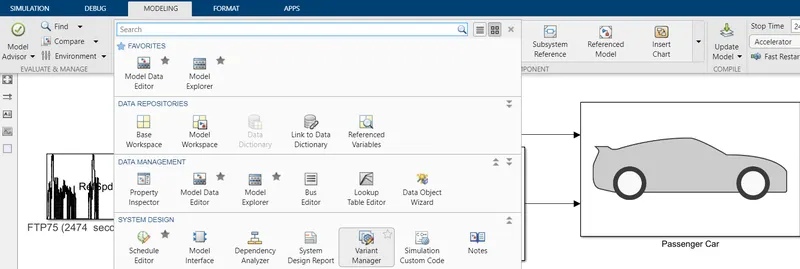
After selecting the variant manager, another window will appear and its representation is shown below.
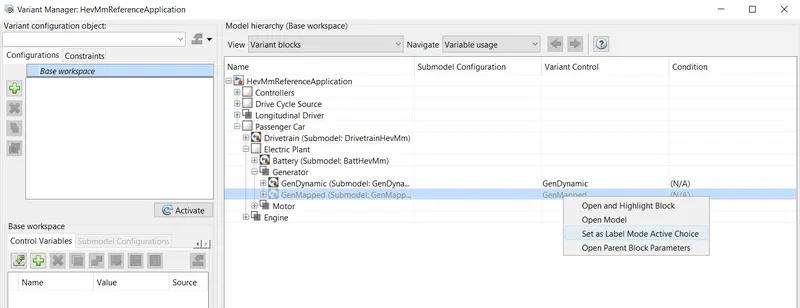
In the pop up window, select the model which we want to chane. Here, generator is assigned as dynamic model. To change that into mapped model, right click on the mapped model and select 'set as label mode active choice'. Now mapped model will be active over dynamic model.
- Calculation of miles per gallon
Miles per gallon (MPG) is the unit of measurement for cars to find out the fuel efficiency. In electric vehicle it is replaced with a unit named miles per gallon equivalent (MPGe). One gallon gas is equivalent to 33.7 kilowatt hours of electricity.
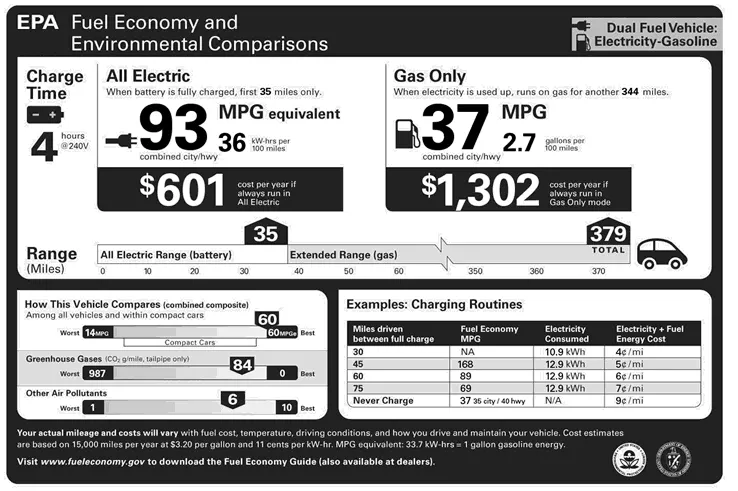
Above represented window sticker shows the MPGe of a 2011 chevrolet volt.
In HEV reference model, we can see performance calculation subsystem if we observe in visualization subsystem. It is represented below.
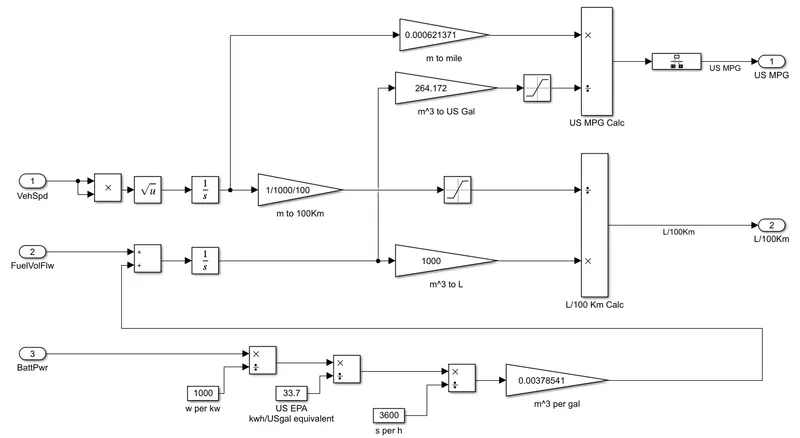
From the representation, we can see that the calculation is done by vehicle speed, fuel volume flow and battery power as inputs. Battery power is taken in kilowatt hour and it is converted to miles per gallon by dividing 33.7. So an electric or hybrid vehicle that uses 29 KWh per 100 miles would get a combined115 MPGe rating.
- HEV Reference Application
The hybrid electric vehicle (HEV) reference application represents multi model HEV with an internal combustion engine, transmission, battery, motor, generator and associated power train control algorithms. The HEV is configured with a mapped motor and battery. This diagram shows the power train configuration.
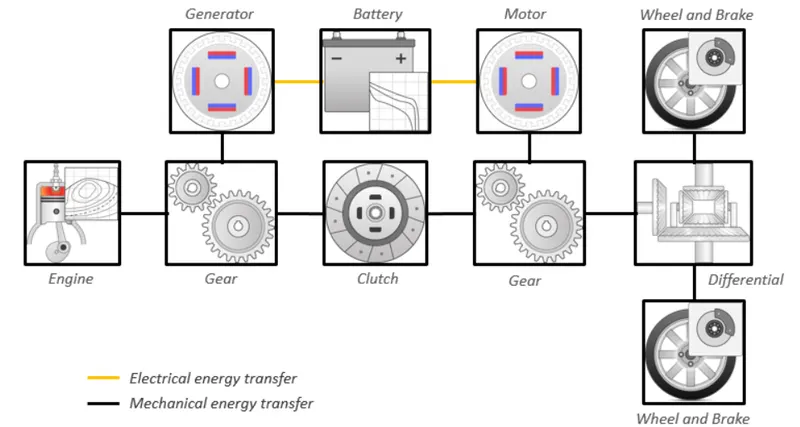
We can load the model from the mat lab documentation and the model is represented below.
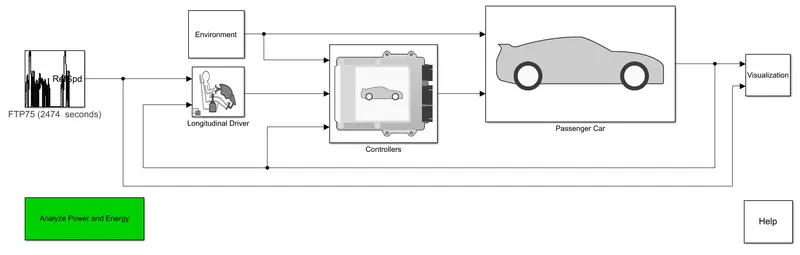
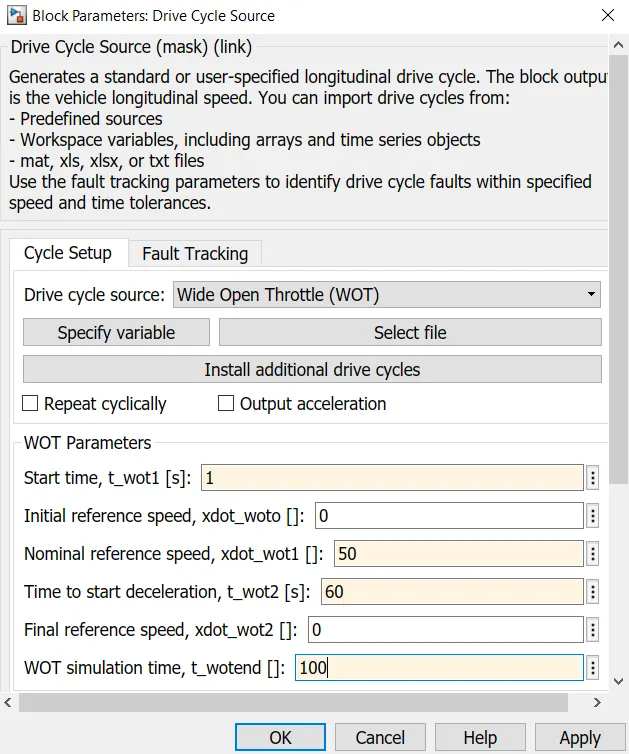
Here the drive cycle source block is used to generate a specified drive cycle and we give the input as wide open throttle (WOT) drive cycle. The representation of changing the parameters is given below.
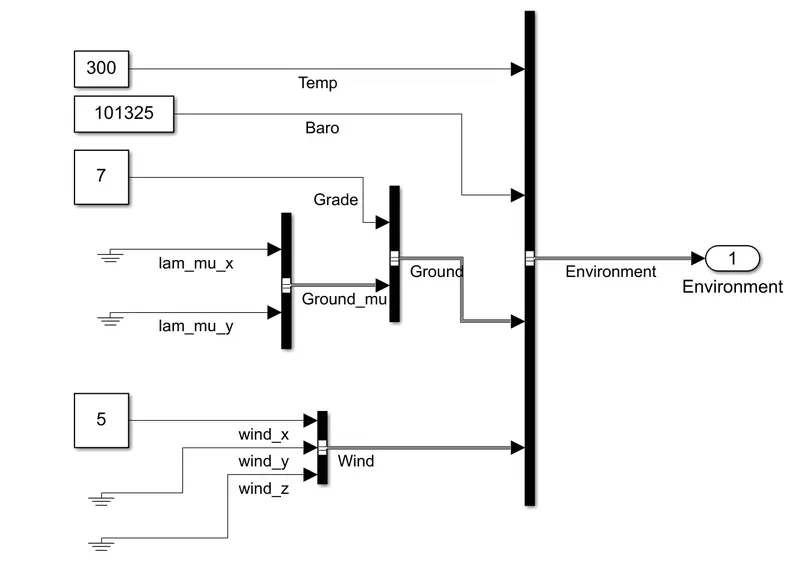
Environment subsystem creates environment variables. It includes wind velocity and grade. After changing the drive cycle, the simulation is carried out and the results are obtained in the visualization subsystem. It is represented below.
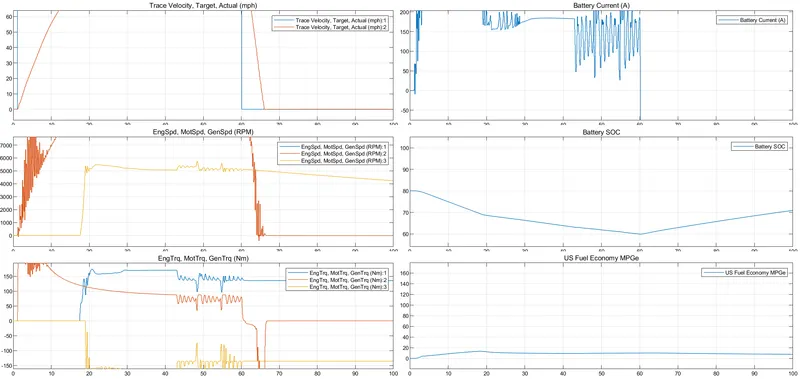
The result consist six plots and they are dependent to each other. Velocity tracing plot shows the targeted velocity and actual velocity. We can clearly see that, targeted velocity is similar to WOT drive cycle and actual velocity reacts little slower than that because of the practical conditions. Battery current plot shows that it increased while starting and when deceleration occurs it dropped to negetive value. Then the regenerative braking will start. It is clear from the SOC graph. It increases when regenerative breaking starts. Speed plot shows the speed of engine, motor and generator. Initialy the motor value is high indicating its usage and then generator value increases when SOC value start to decrease. Torque plot shows the values for engine, motor and generator torque. As we know, motor torque will be high initially and then engine value will increase. Motor torque goes to negetive value when breaking was done. In all plots lines are straight when vehicle is steady. Fuel economy plot shows a steady fuel economy rate. Engine and motor keeps the milage safe.
Now, we can change the grade and wind velocity in environment subsystem. Grade is given as 7 and wind velocity is given as 5. The representation is given below.
After changing the inputs, the simulation is carried out with keeping all other parametrs same. The result is given below.
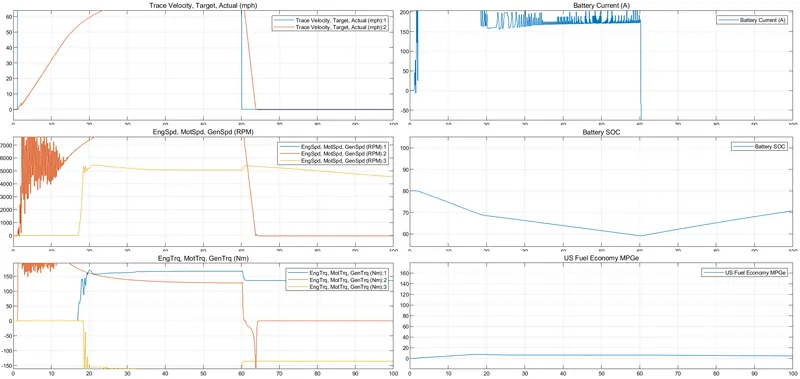
Plots are similar to the previous case. But by the application of grade and wind velocity makes the responce slow. In Actual velocity, we can see more slope than previous case because of grade and wind. Battery charge, speed and torques are also high in initial stages because of the extra inputs.
- Comparison with EV Reference Application
The electric vehicle (EV) reference application represents a fully electric vehicle model with a motor, generator, battery, direct drive transmission and associated power train control algorithms. The EV is configured with a mapped motor and battery. This diagram shows the power train configuration.
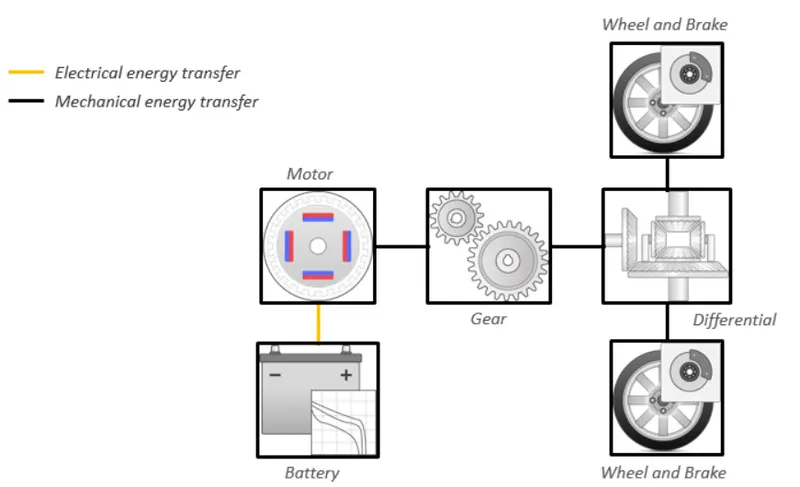
This is also loaded from the documentation files and it is run with same condition as in HEV reference application. The result is given below.
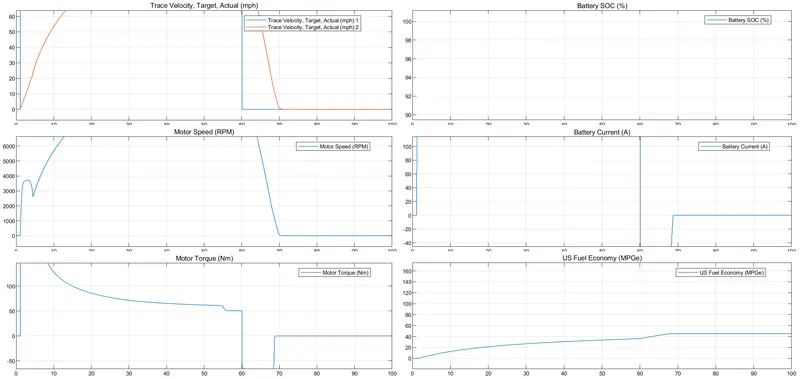
As we can see, the velocity graph is similar to HEV. Motor speed and torque is more stable than HEV. So the battery cappacity of EV is high. We can also see a better fuel efficiency in EV than HEV. But in case of regenerrative breaking HEV is better. By looking battery current plot, we can conclude that.
Now, the grade and wind velocity is changed exactly like in previous case and simulation is carried out. The result is given below.
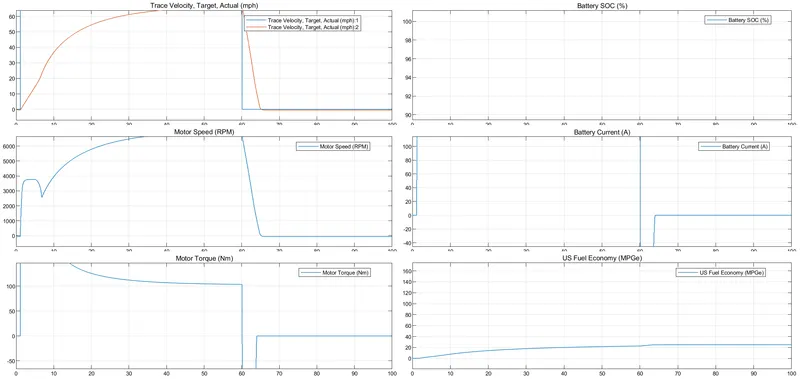
In this case also, the effect of grade and wind can be seen. But the comparison with HEV is same. Here also EV has a stable motor perfomance and higher fuel efficiency rate than HEV.
Conclusions
A study regarding power train block set was done and simulations were carried out. In simulation, we compare the performances of hybrid and pure electric vehicles.
References
[2] https://in.mathworks.com/products/powertrain.html
[4] https://www.fisherhonda.com/how-to-calculate-mpge-vs-mpg/