Week-4 Challenge WOT Condition Part-2
- What is the difference between mapped and dynamic model of engine, motor and generator? How can you change model type?
ans:
- Powertrain Blockset provides two types of combustion engine models,mapped and and dynamic
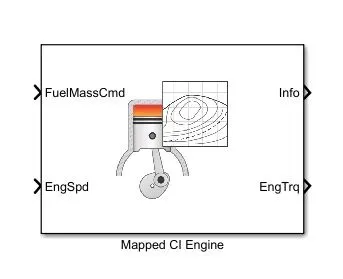
Mapped engine:
- It represence macro engine behavior as a set of lookup tables as a function of commanded load and measure engine speed
- It is suitable for analysis and design activities that do not require engine subsystem dynamic characters
- It is less accurate
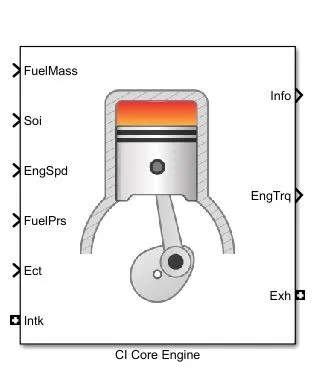
Dynamic engine:
- It decompose engine behavior into individual component models that account for engine dynamics,most notably intake airflow and turbocharger dynamics
- It is suitable for designing control,estimator,and diagnostics that depends on dynamic subsyatem state.
- It is more accurate.
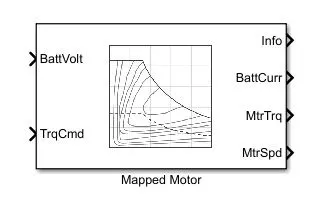
Mapped motor:
- The mapped motor is used for fast system level simulation
- Its suitable when you dont know detailed motor parameters It represence motor behavior as a set look up tables
- It work in torque control mode
Dynamic motor:
- In dynamic motor a three phase interior permanent magnet synchronous motor is used
- The block uses three phase input voltages and individual phase current
- This block used when user know all the parametres required
- This is more accurate
Mapped generator:
- It is similar to other mapped block
- Most of the data required taken from lookup table
- we used this when we dont know detailed generator parameter
Dynamic generator:
- It is more accurate
- Used when we know all the detailed parameter og generator
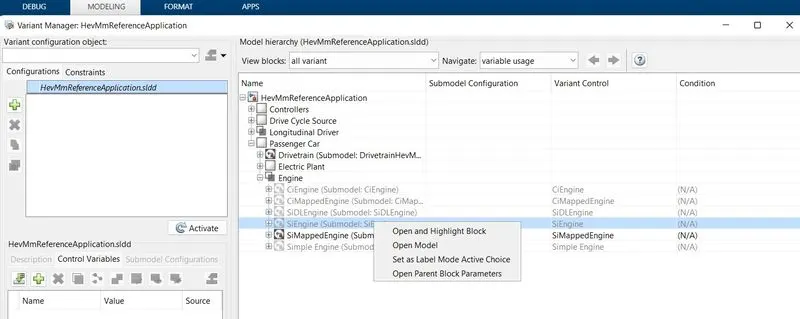
For changing model type
click on modelling-> varient manager-> right click on model to be set ->set as label mode active choice
Then te selected model get activated in simulation.
2.How does the model calculate miles per gallon? Which factors are considered to model fuel flow?
ans:
In model Performance Calculation subsystem is used to calculate miles per gallon is shown below,
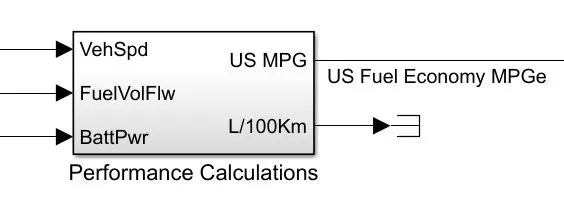
- The inputs are vehicle speed,fuelvolume flow and battery power
- Expansion of performance calculation subsystem is shown below
- Two type fuels used here electricity from battery power and fuel
- battery power is converted to kilowatt by dividing it by 1000 ,then dividing it by 33.7kwh
- then fuel from battery is added to fuel flow then m^3 value converted to US Gal
- The other input is vehicle speed ,using this value the distance traveled calculated and meter value converted to mile
- these two output given to block named US MPG calc which divide distance in mile to Us gallon value
- as an output we get USMPG
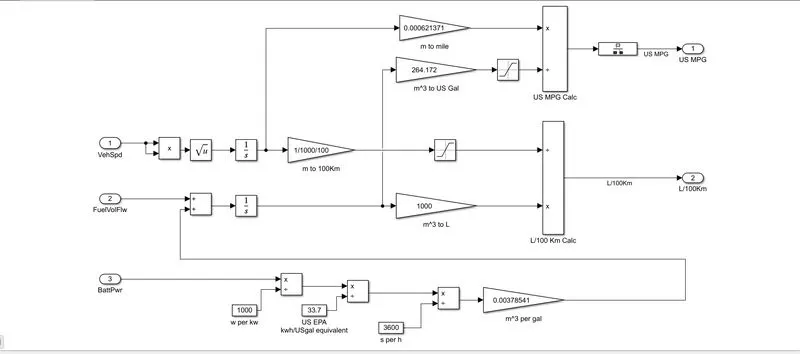
The factors considered in vehicle fuel flow is battery power and fuel input of the vehicle,battery power is converted to kilowatt by dividing it by 1000 ,then dividing it by 33.7kwh,then fuel from battery is added to fuel flow with normal fuel
3.Run the HEV ReferenceApplication with WOT drive cycle. Change the grade and wind velocity in the environment block. Comment on the results.
ans:
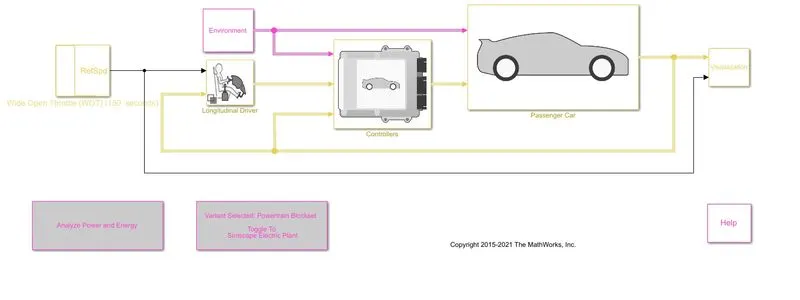
Simulation model of HEV ReferenceApplication with WOT drive cycle is shown below
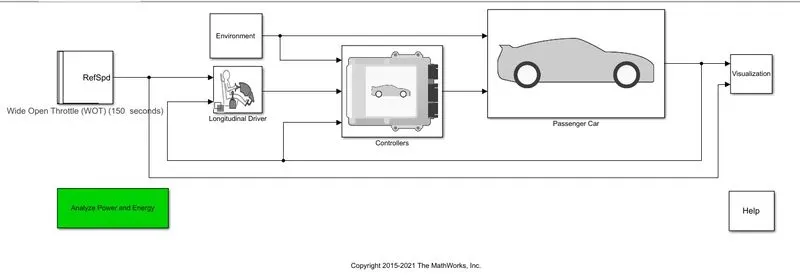
We set drive cycle to WOT and set WOT parameters as shown below
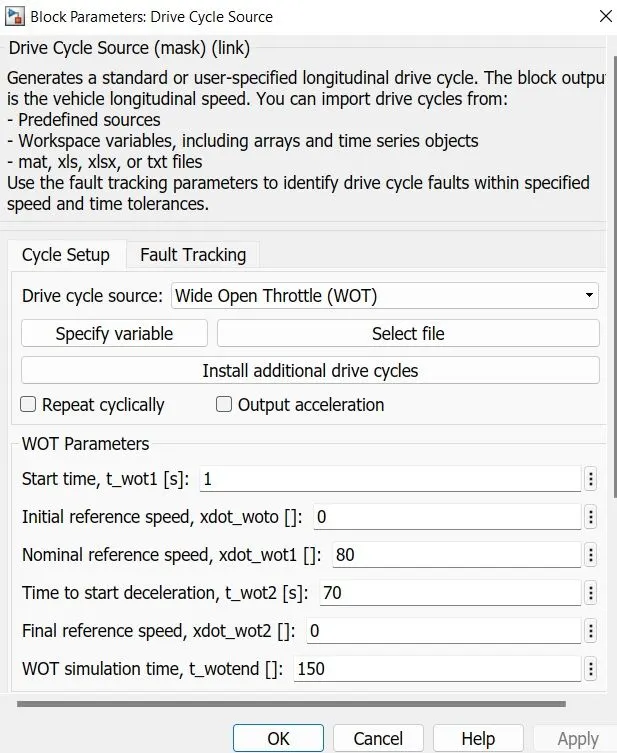
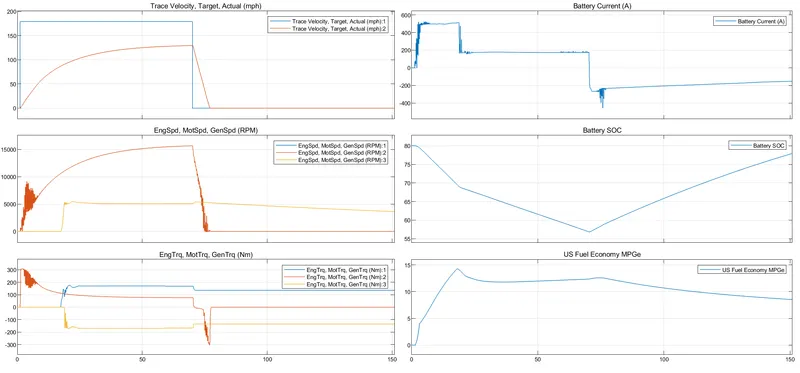
Then we run the simulation we got the result
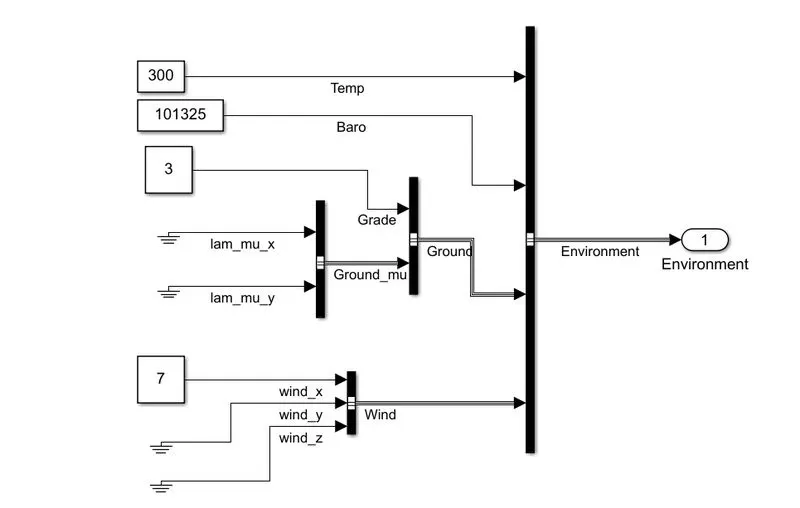
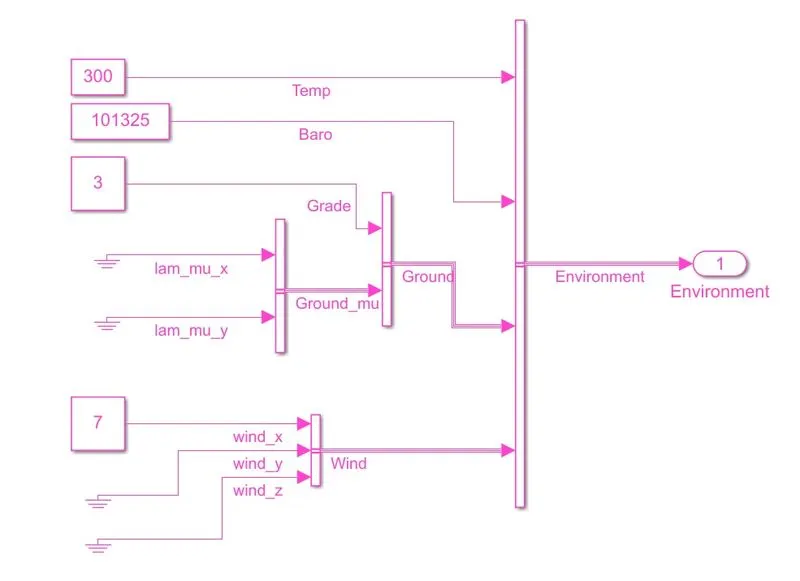
Then we changegrade=3 and wind speed =7 in environment block
Output: Plot obtained is shown below
When wind speed and grade increases overall speed reduces
Trace velocity:
- Blue plot indicate the desired path
- yellow plot indicate thebactual path
- Its seen that battery power is not enought t meet the grade and wind velocity
Battey current(A)
- When the vehicle is accelerating the battery current also increases
- When velocity become constant battery current requirement also becoming constant
- When the decceleration occurs battery current becoming negative this region indicating regenerative breaking
Engine,motor,generator speed:
- Initially motor is only in action
- later the engine starts and motor load reduces
- engine and generator graphs are overlaped
Engine,motor,generator torque:
- Motor has high torque initially
- then later engine starts
- generator torque is negative because it charges the battery
Battery SOC:
- The battery soc keep decreasing till the starting of regenerative braking then increases afterwards
US Fuel Economy
- Fuel consumption is maximum at the time of starting of engine
- later fuel reduces with time
4.Keeping all other parameters same, compare the simulated results of hybrid and pure electric powertrains.
ans:
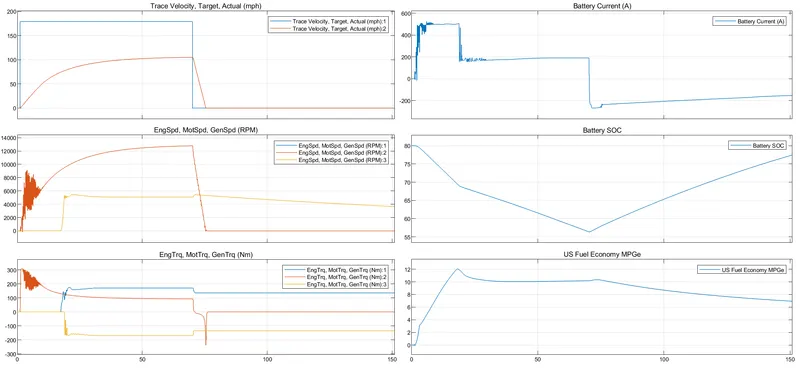
then we set WOT to EV with same parameters
In environment block grade=3 wind speed 7 is given as hevmodel
Result:Performance output is given blow
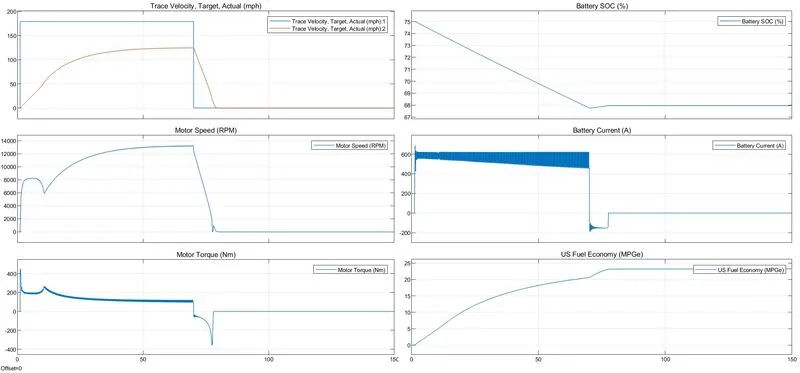
- Hev performance
comparison study:
1)Trace velocity performance is almost similar to hev
2)Motor speed and motor torque plot is stable than hev during starting and also peak rpm of motor in ev is less than hev ie, battery power is more in hev
3)SOC performance is improved in ev
4)Fuel economy is greater in ev than hev
5)In hev initial motor take all the load and later after engine starts and motor load reduced
6)at the time of regenerative braking negative current flows longer time in hev than ev