Project
Carry out a system-level simulation of an all-terrain vehicle.
Download the model from the given link:
https://www.mathworks.com/matlabcentral/fileexchange/70576-baja-all-terrain-vehicle-atv-model
Prepare a technical report explaining the model properties & comments on the results.
AIM : Carry out a system level simulation of an all terrain vehicle.Prepare a technical report explaining the model properties.
All terrain vehicle: An all terrain vehicle also known as Quad bike and light utility vehicle is defined as motorized off highway vehicle that travels on low pressure tires ,with a seat that is straddled by the operator,along with handle bars for steering .
MODEL 1:
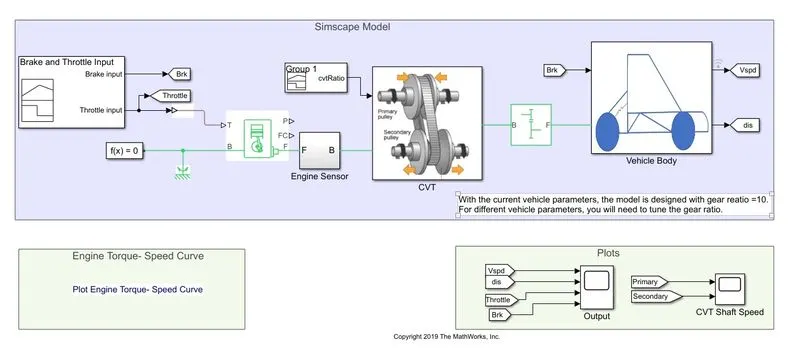
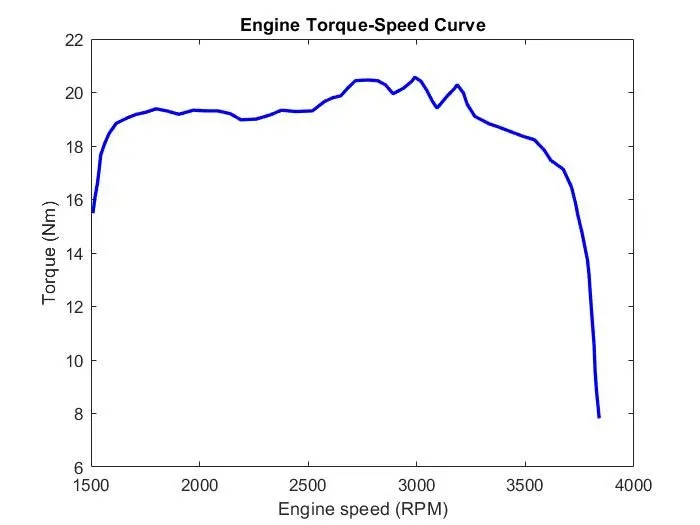
Simscape model of all terrain vehicle ;engine torque speed curve and shaft speed plot is shown above
INPUTS: Constant value input are given to throttle and break and cvt ratio given by a signal generator.
BLOCK USED: Beak and throttle input ,Generic engine, engine sensor,Continuously Variable Transmission ,Simple gear, Vehicle body
CONTINUOUSLY VARIABLE TRANSMISSION:
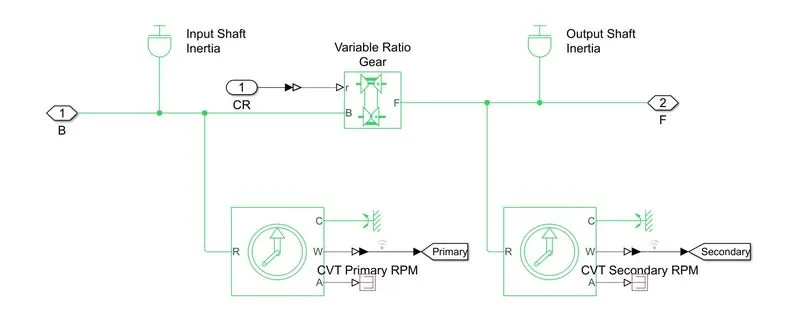
CVT block simulation is shown above .A continuously variable transmkssion is an automatic transmission that can change seamlessly through a continuous range of gears ratios.This contrasts with other
transmissions that provide a limited number of gear ratios in fixed steps.The fexibility of a CVT with suitable control may allow the engine to operate at a constant rpm while the vehicle moves at varying speeds.
Simulation of CVT is done by using Variable ratio gear, ideal rotational motion sensor and input shaft inertia.
Variable ratio gear block: This represents a variable ratio gearbox such as implemented by mechanical belt CVT , electric or hydraulic transmissions.The physical signal input r defines ratio of input to output
angular shaft velocities. Connection B and F are mechanical rotational conserving ports.Specify the rotation between base and follower rotation directions with the output shaft rotates parameter.
GENERIC ENGINE:Represents a system-level model of spark-ignition and diesel engines suitable for use at initial stages of modeling when only the basic parameters are available. Optional idle speed and red
line controllers are included.The throttle input signal T lies between zero and one and specifies the torque demanded from the engine as a fraction of the maximum possible torque. If the engine speed falls below
the Stall speed, the engine torque is blended to zero. If the engine speed exceeds the Maximum speed, the simulation stops and issues an error message.Connections F and B are mechanical rotational conserving
ports associated with the engine crankshaft and engine block, respectively. Connections P and FC are physical signal output ports through which engine power and fuel consumption rate are reported.
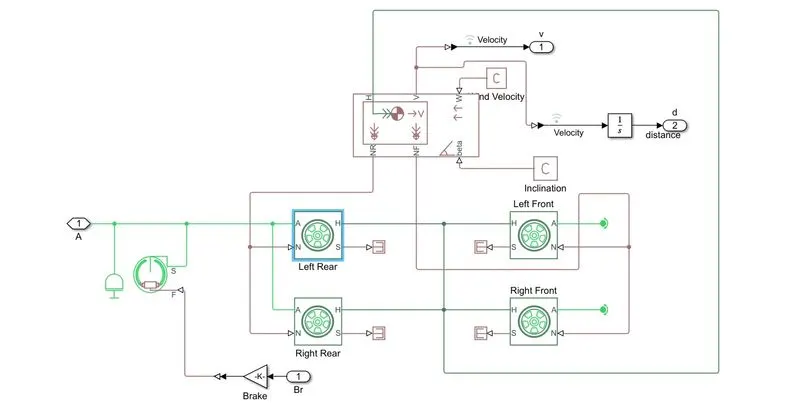
VEHICLE BODY: Simulation of vehicle body is shown below
OUTPUT:1. Stop time set to 200sec and run the model input and output plots are given below
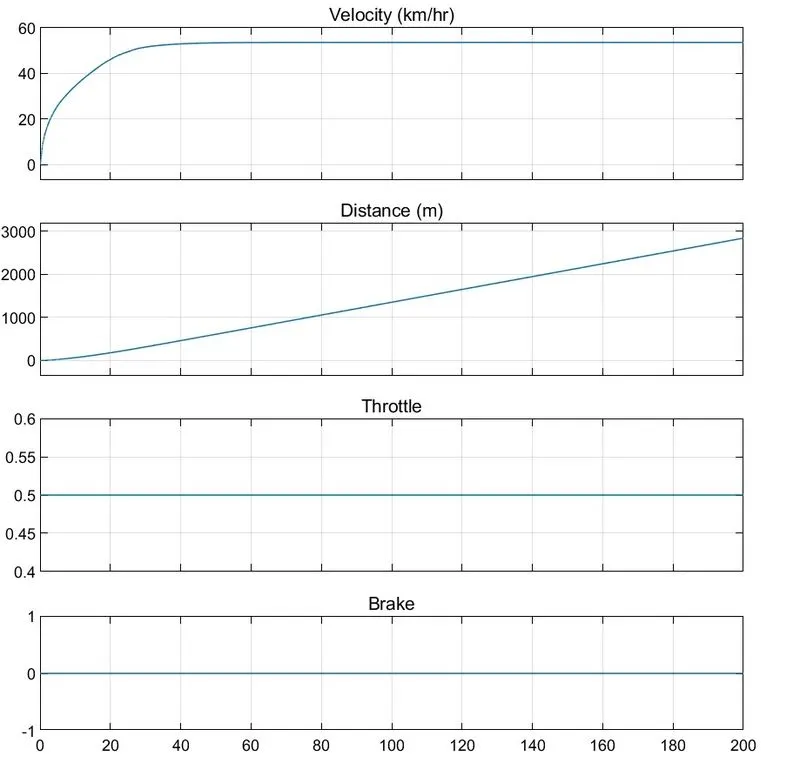
OBSERVATION: In this model we kept throttle and brake input as constants So it is clear from above plot velocity and speed are increasing smoothly.
2.Shaft speed plot is shown below
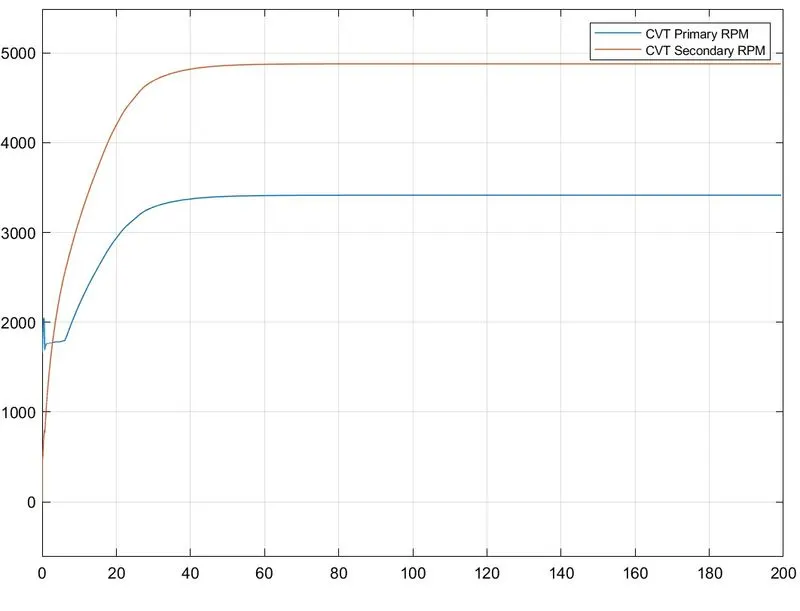
Observation: Since the inputs are constants we get a smooth curve in shaft speed plot.
MODEL 2:
SIMSCAPE MODEL WITH DASHBOARD
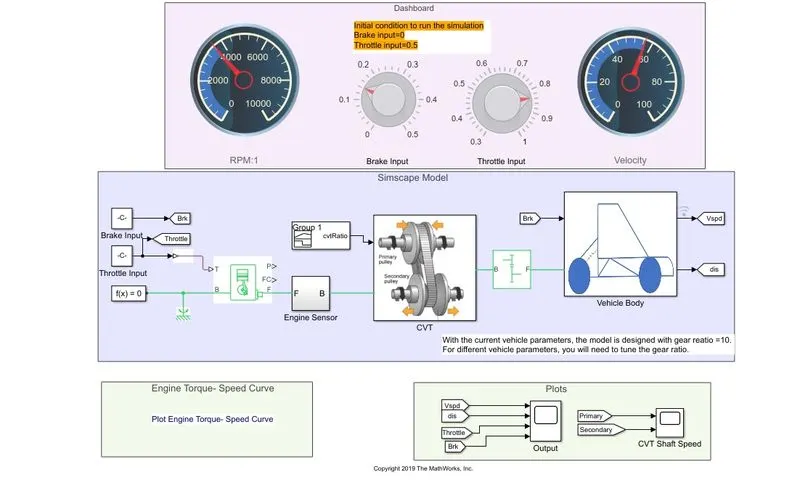
INPUTS: Break and throttle inputs are variable and applied while running the simulation and cvt ratio is given by signal generator.
BLOCK USED:In this model block used are same as the first model but we gave input to break and throttle using a dashboard .
PROCEDURE: Stop time set to infinity while running the model break and throttle inputs are given and corresponding changes observed in rpm and velocity meter in dashboard
OUTPUT: 1.The output and input plots are given below.
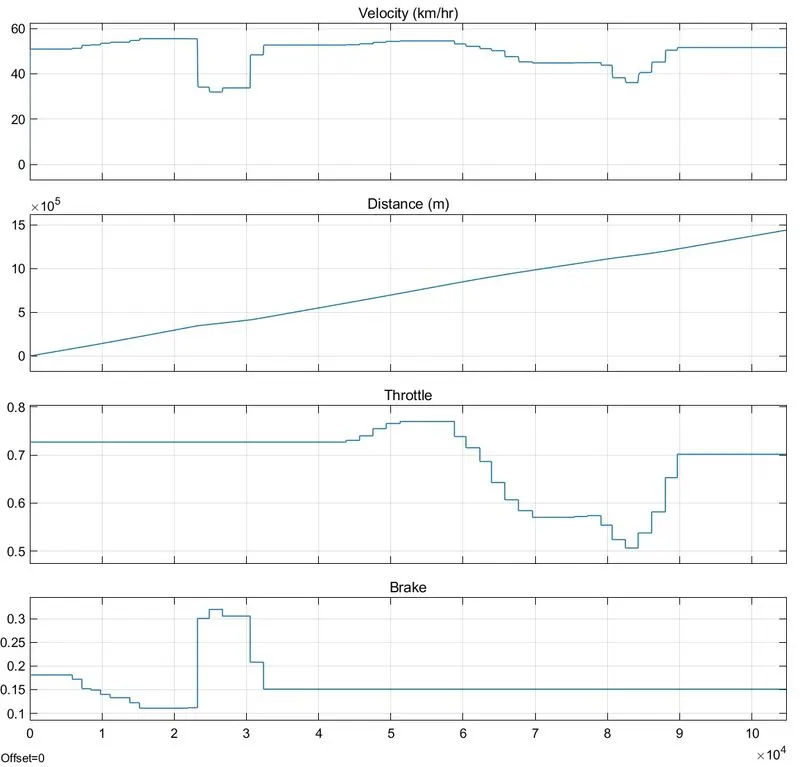
0BSERVATION: It is clear frome above plot variation in brake and throttle input affects velocity and distance.
- We changed break input between zero and 3 sec velocity is varrying correspondingly at 2.5 sec we applied high value break input and velocity is minimum at that and variation in distance curve is visible there.
- We continuously change the throttle input from 4 to 9 sec correspondingly velocity changes during this time period .when throttle input is higher velocity increases when throttle value decreases velocity decrease and variation in distance curve is visible there in above plot.
2.Shaft speed plot is shown below
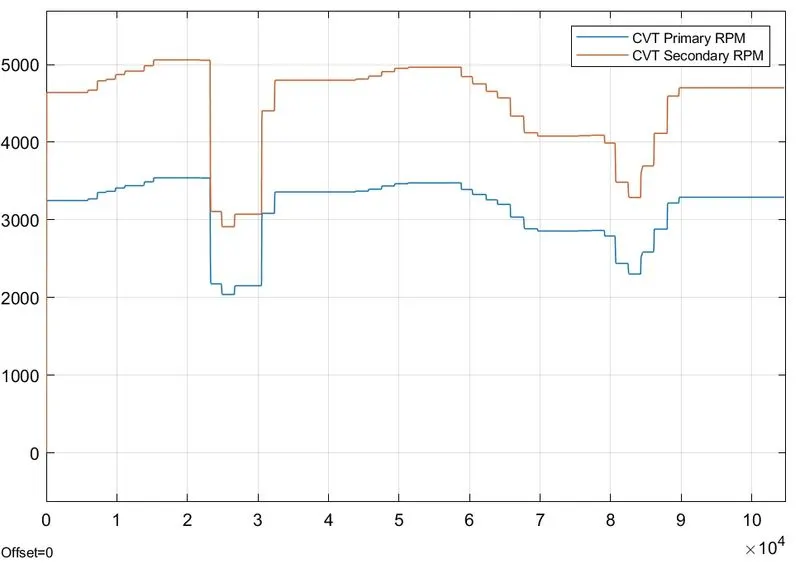
Observation:shaftspeed is varries with the application of break and throttle
MODEL 3:
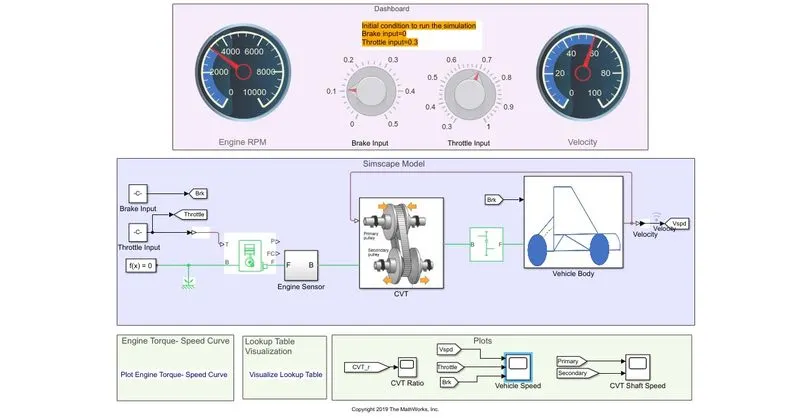
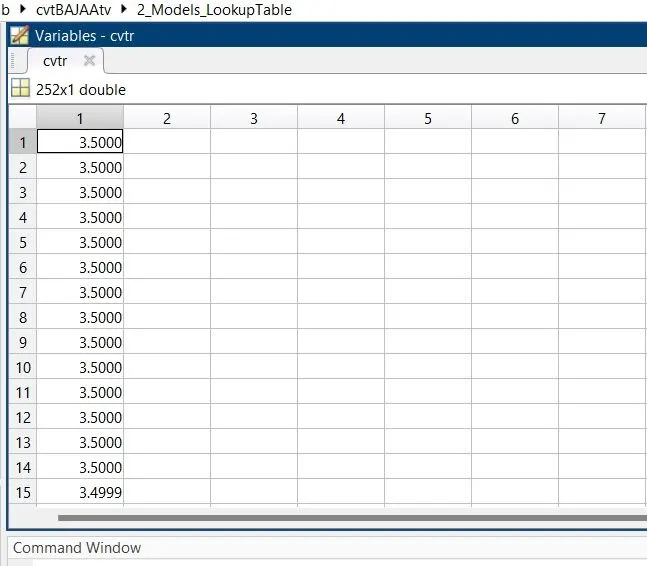
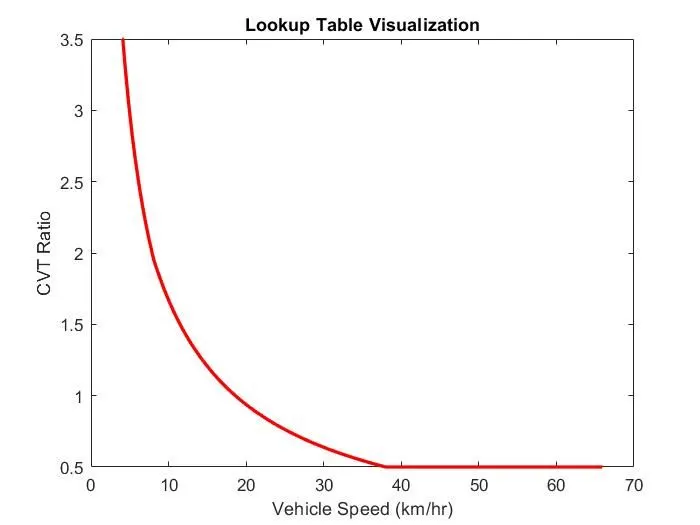
It is a closed loop model of atv with cvt.It is a cvt builder model.In this model instead of signal builder block for CVT ratio lookup table is used and velocity feedback given to CVT.Based on the data given to the
look up table it is calculating require amount of cvt ratio.Break and throttle inputs are given while running the simulation.
Cvt block:
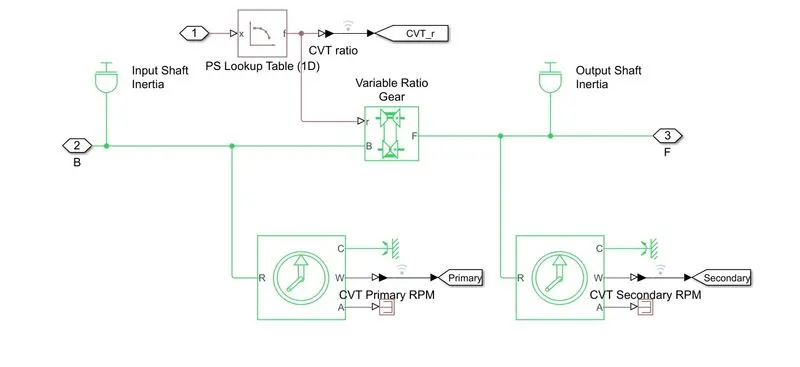
- Look up table data and look up table visualizations are given below
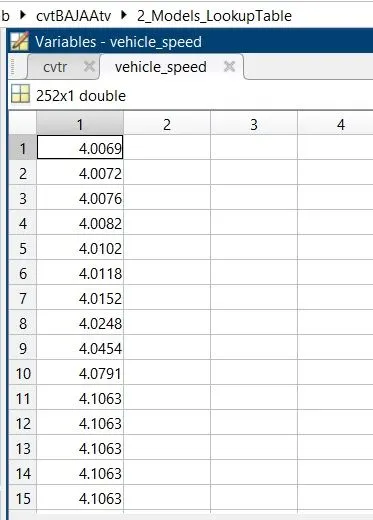
PROCEDURE: Stop time is set to infinity and while running the simulation inputs are applied.
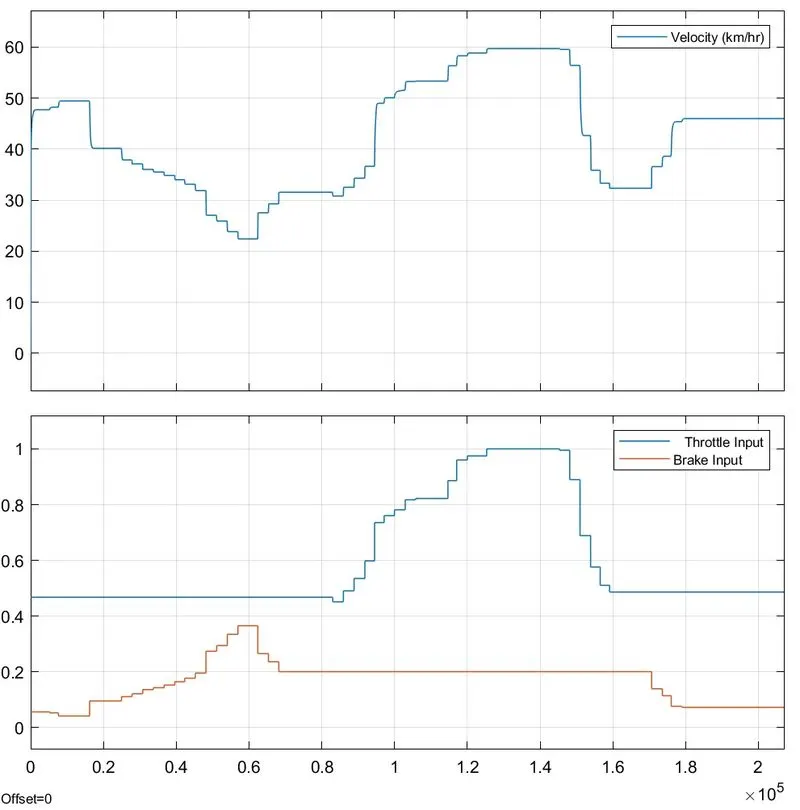
OUTPUT: 1.Input verses output plot is given below
OBSERVATION:
- When throttle is applied vehicle speed increases and when break is applied vehicle speed decreases and corresponding variation happening in shaft speed .
2. Shaft speed plot is given below
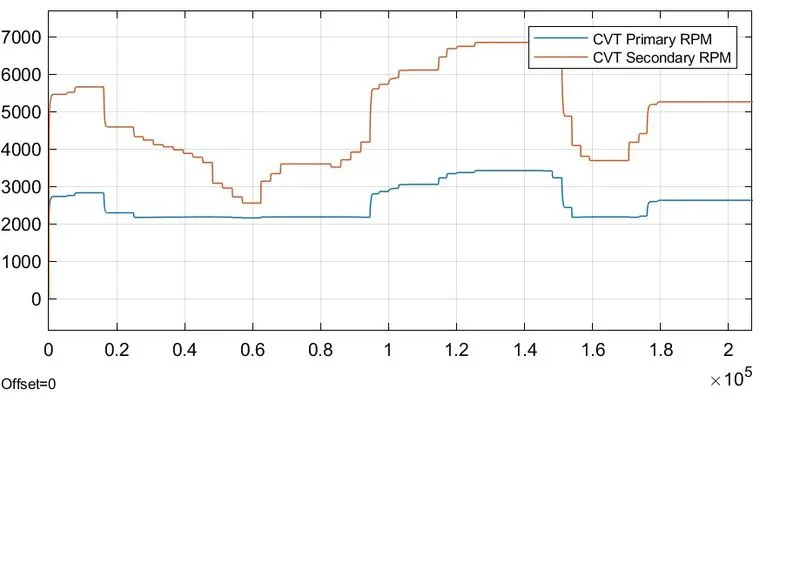
OBSERVATION:The graph shows the changes in rpm of primary and secondary shaft with respect to the change in input parameters.
CONCLUSION: Analysed 3 different models of baja atv with cvt and recorded and observed the output by varrying throttle and break inputs.