Week-4 Challenge WOT Condition Part-2
- What is the difference between mapped and dynamic model of engine, motor and generator? How can you change model type?
| Type | Implementation | When to Use | |
| Mapped |
CiMappedEngine SiMappedEngine |
model uses a set of steady state look up tables to characterize engine performance. The tables provide overall engine characteristics, including actuak torque, fuel flow rate,BSFC, and engine out exhaust emissions |
|
| Dynamic |
CiEngine SiEngine |
Model decomposes the engine behavoir into engine characteristics that are seperated into lower-level components. By combining components in this way, the models capture the dynamic effects. |
|
For Motor: it has 2 type Mapped motor and Dynamic Motor.
Implementation:
- The mapped motor block implements a mapped motor and drive electronics operating in torque control mode. The output torque tracks the torque reference demand and includes a motor response and drive response time constant.
- Use the block for fast system level simulations when you do not know detailed motor parameters, For example, for motor power and torque trafeoff studies. The black assumes that the speed fluctuations due to mechnical load do not affecr the motor torque tracking.
- The DC motor circuit diagram is represented.
- The system equation are created.
- The transfer function is calculation.
- Then the model block diagram is prepared.
- The is done to simulate the model in programming MATLAB.
- Finally the performance analysis is carried out.
For generator:
Type of Modeling:- Mapped Generator and Dynamic Generator.
Implementation:-
- Mapped Generator:- This is also similar to mapped motor modeling where the inout values for generator blocks are predefined or taken from the lookup tables here also simulation time is very less.
- Dynamic Generator:- This model also represents an actual generator working in a real time envirnoment, where the output values calculated continuosly according to change in input values as the equation is implementing simulation time is more compared to the mapped generator.
- To changed model type from mapped to dynamic or dynamic to mapped:-
After entering into passenger block > electric plant > motor will get this window where MotorGenMapped is by default slected as a model type for motor.
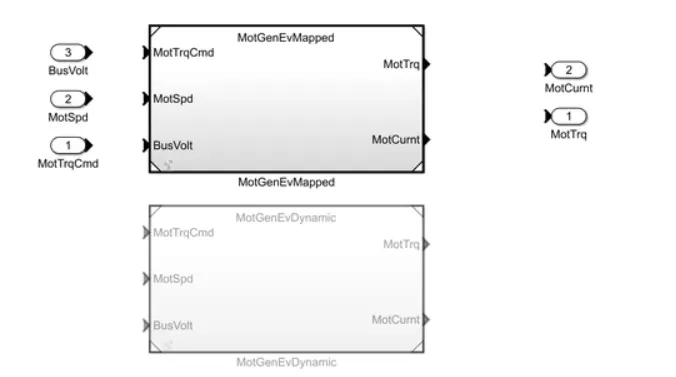
- To change from MotGenEvMapped to motgenev dynamic
- First, we open our reference model into matlab
- here are choosing EV an example.
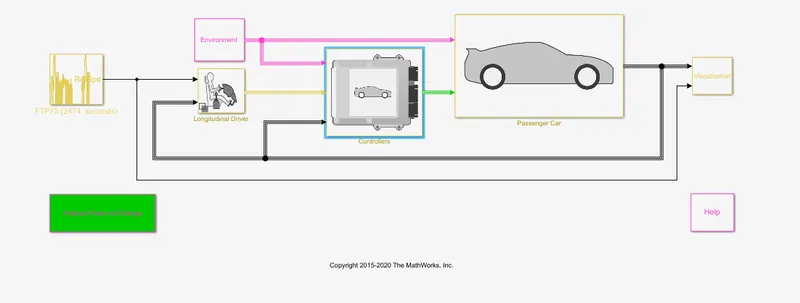
Then after clicking on the modeling section and after that in the design block, we will select the variant manager option:-
- After the variant manager window gets open.
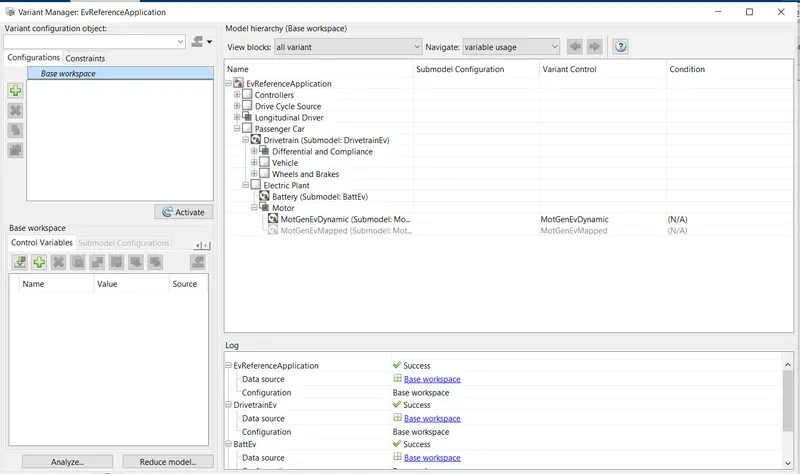
- Then by clicking on the passenger car expand option there will electric plant option that will too in that will get both battery and motor.
- we are taking motor as an example so after expanding the motor option we will get:-
- MotGenEVdynamic.
- MotGenEVmapped.
So the default one is MotGenmapped to change into MotGenEVdynamic.

- we need to right click on our preference and after, a pop up will be shown in which we need to select 'set as label made active choice' and after that out motor variant will be MotGenEVdynamic.
- same we can do for battery to verify whether its change or not will return to out model and open passenger block > electric plant> motor abd clicking on the blcok will get this window as shown below.
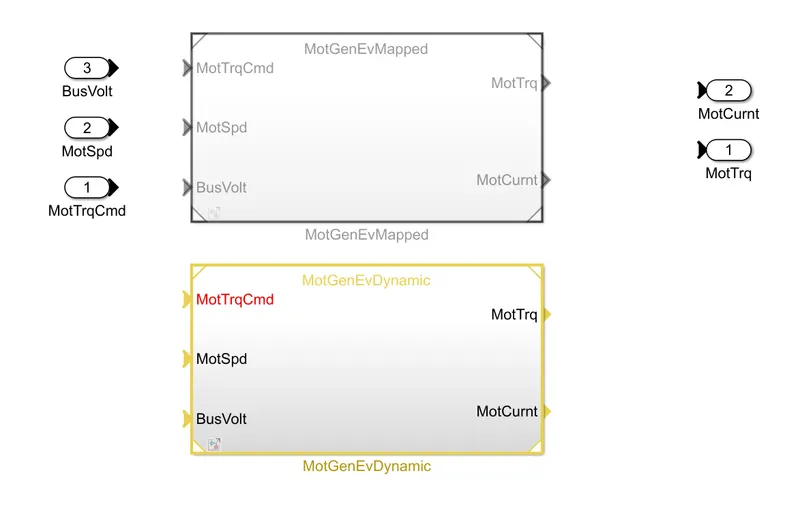
- As we ca nsee changed our variant from MotGenEVMapped to MotGenEVdynamic.
- A same procedure we can do for changing variant from MotGendynamic to MotGenMapped for both battery and motor.
- that is how we can change our model type.
2. How does the model calculate miles per gallon? Which factors are considered to model fuel flow?
Miles per gallon:-
- Miles per Gallon is a fuel economy rating determined bu how far a car can travel on a gallon of petrol or diesel for a engine powered car.
- In case of an electric vehicle it tells us the energy which is equivalent that of a engine powered carto propel the car through distance,
- The amount of fuel energy required to move a engine powered car through a distance is determined and then it is compared to the equivalent amount of electric energy required to move the car through the same distance as the miles per gallon.
- The power train block set has a model that calcualtes the miles per gallon for all kinds of vehicles.
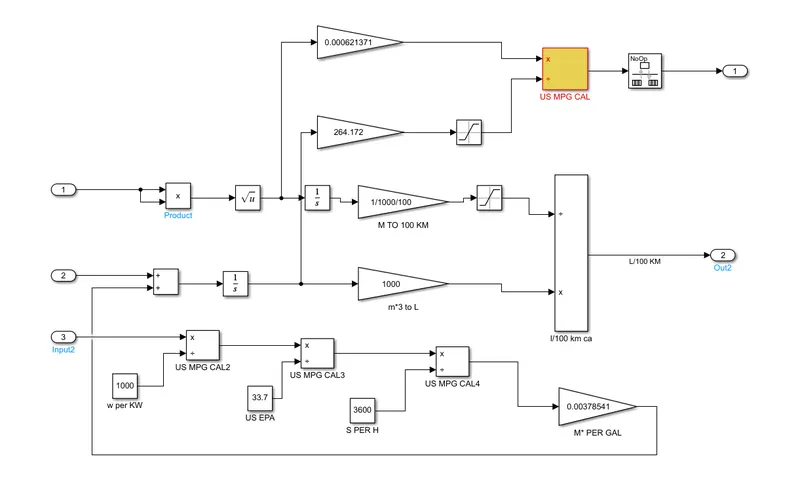
- The above shown model takes the input of the vehicle speed , fuel flow and battery power to calcualte the fuel consumption and the equivalent and calcualtes the miles per gallon.
Vehicle Speed and Fuel Flow:
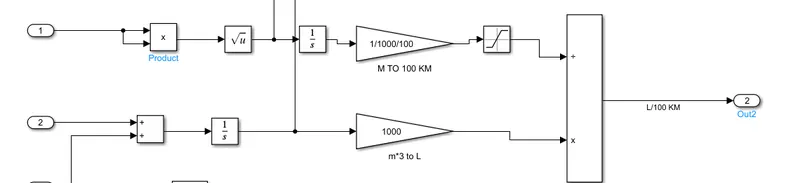
- The vehicle speed is a important factor while considering the fuel consumption at that particular time, so to determine the fuel consumption throughtout the drive cycle.
- To convert speed to distance we can integrate with time and we are doing the same of converting the velocity to get distance convered to integrating.
- Then the fuel flow is expressed as the mass flw rate, the amount of fuel at each moment is kg/sec. Now integrating this will result in the mass of the fuel and by using thus 1 we convert it to the volume and by multiply by 1000 to get it in litres.
- By the comparing the two results we can get the amount of litre consume to Run for 1000 KM.
Battery power:-
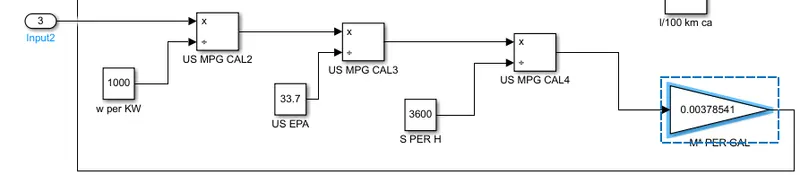
- The amount of energy from battery power required to propel the vehicle equivalent to that of the engine is calculated here.
- the battery power is given in watts and it is converted to KW by dividing with 1000.\
- then we convert the power into energy by multiplying with the time into KWh.
- Then we convert the energy from KWh to equivalent energy in US gallon of automotive gasoline by dividing with 33.7, Since we get the energy in US Gallons equal in KWh we are trying to get the energy of equivalent LIS Gallons per seconds and we do this by dividing with 3600 and we convert the hour the hour to seconds.
Calculating Miles per Galoon:-
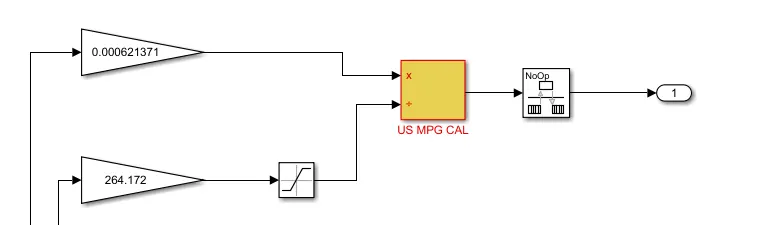
- Then the inputs from the vehicle speed (i.e) the distance we found is taken into the calculation and it is converter to the miles by multiplying with the 0.000621371.
- Then the inputs from fuel flow (battery energy + fuel energy) taken im mA3 and it is converted into equivalent US gallons by multiplying with 265.172.
- Then the two inputs miles convered and equivalent US gallon is further divided and the result is got in miles/Gallon.
3.Run the HEV ReferenceApplication with WOT drive cycle. Change the grade and wind velocity in the environment block. Comment on the results.
Hybrid electric vehicle:-
- A hybrid electric vehicle is the type of hybrid type that combines a conventional internal combustion system with an electric propulsion system.
- The presence of the electric powertrian is intended to achieve either better fuel economy than a conventional vehicle or better performance.
- Example of HEV is Toyota Prius.
Case :1 Simulation Condition
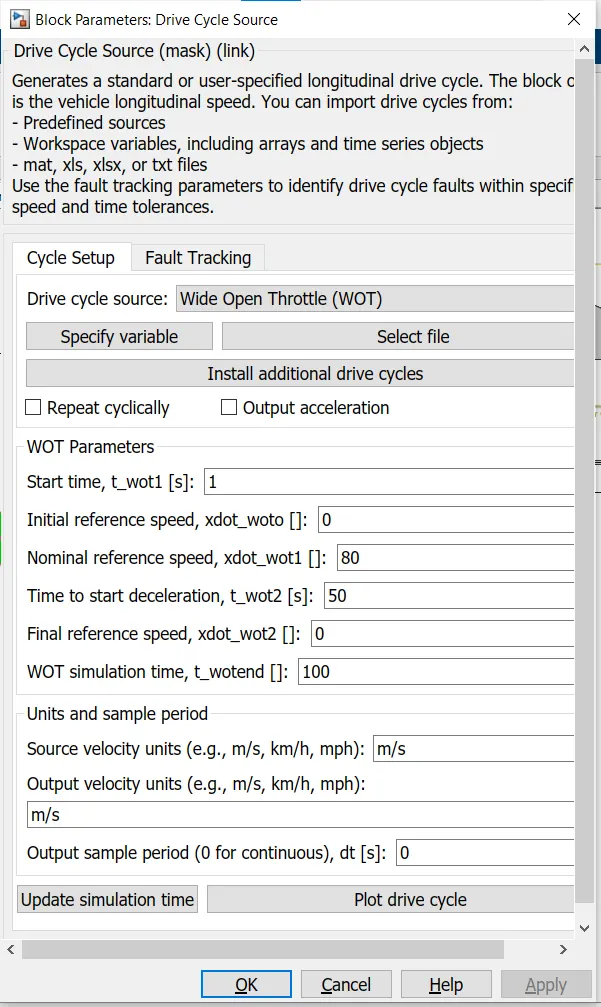
The simulation is done for HEV with Wide open Throttle drive cycle.
The total cycle time: 100 sec
The top speed of this cycle := 80 mph
Time to start deceleration = 50 sec
The grade angle= 0 degree.
The wind velocity = 0 m/s
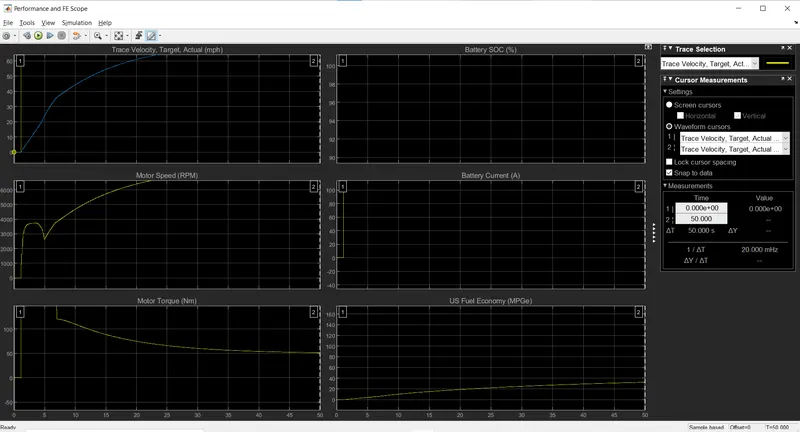
Plot:-1
Shows the velocity of the vehicle with respect to the drive cycle data with the time scale on the x axis. The acceleration time to reach 80 mph = 16.7 sec.
The deceleration time from 80 to minimun = 6.2 seconds.
Plot:-2
Shows the changes in speed of the engine, motor and generaqtor in RPM throughout the drive cycel.
Peak Engine Speed = 4780 rpm
Peak motor speed = 9497 RPM
Peak Generator Speed = 13690 RPM
Plot 3 :-
Shows the torque characteristics and its changes of engine, motor, generator in (Nm) throughout the drive cycle.
Peak Engine tirque = 138.7 Nm
Peak Motor Torque = 206.7 Nm
Peak Generator Torque = 13690 RPM
Plot 4:-
Shows the battery current values(A) and its changes for various acceleration inputs as per the Drive cycle.
The peak current discharger from the battery = 163.5 A.
The peak current charging to the battery = -150.86 A.
Plot 5:-
Shows the battery state of charger SOC (%) and its changes corresponding to the driving inputs.
The state of charge decreased from 80 % to 60 % of charge in a time periof of 49.3 seconds, for the specified driving conditions.
Plot 6:-
Shows the fuel economy as mile per gallons for the corresponding input driving conditions.
The maximum miles that the car run per gallon of fuel equivalent = 46 miles, for the given vehicle at the specified driving conditions.
Case 2 :-
Simulation Condition:-
The simulation is done for Hybrid electric vehicle with wide open trottle drive cycle.
The total cycle time = 100 seconds.
The top Speed of this cycle = 80 mph.
time to start deceleration = 50 seconds.
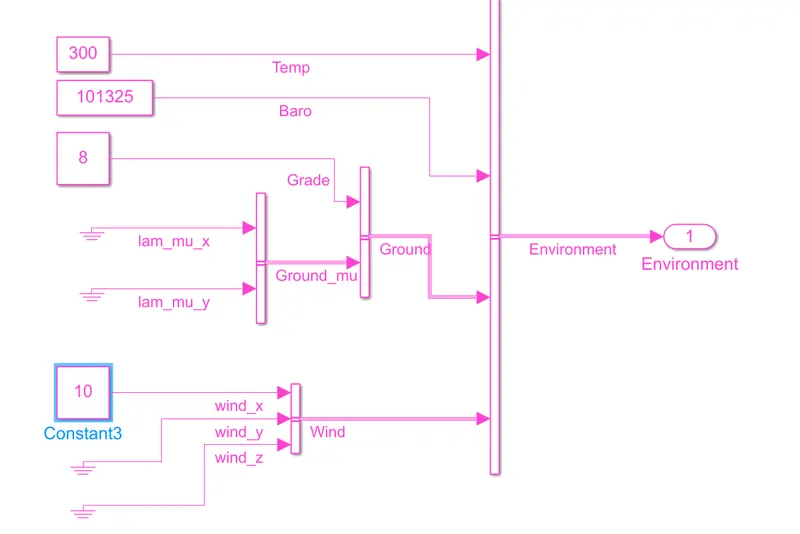
the grade angle = 8 degree.
The wind velocity = 10 m/s.
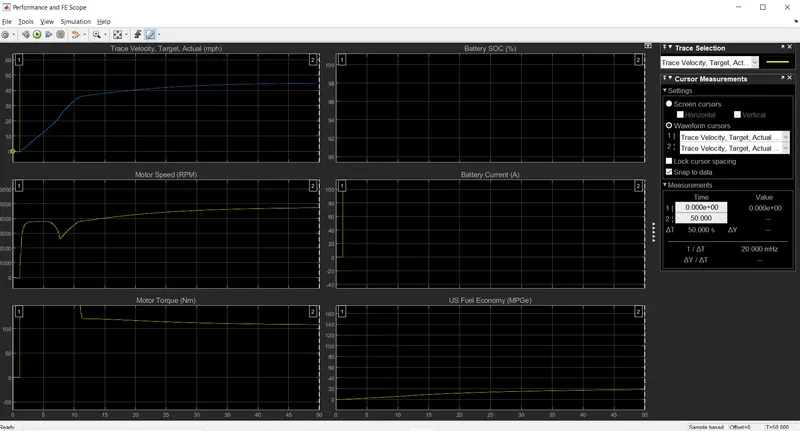
- In all results we can observe some changes from the previous case.
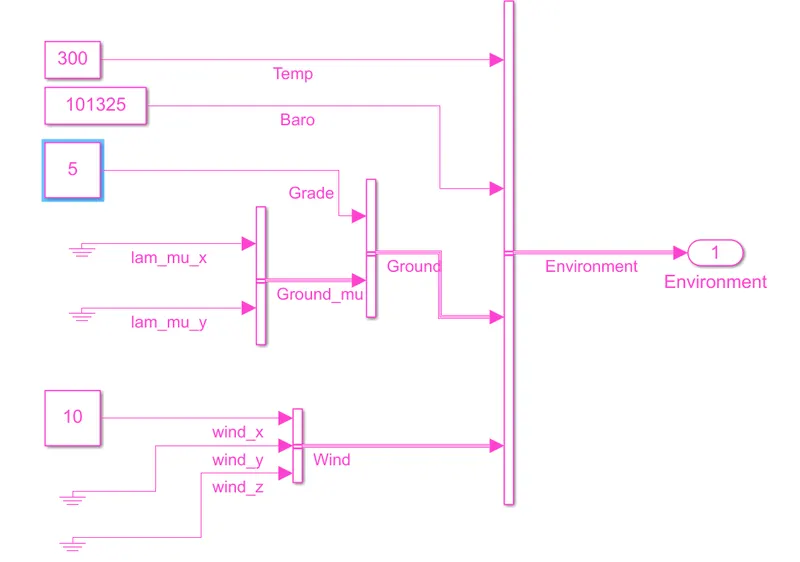
- Though the vehicle parameters and the drive cycle are the same, here we have considered some changes in the environment blocks by adding some hill climb angles and wind velocity.
- The changes in the results are given below.
Plot-1:-
Shows the velocity of the vehicle with respect to the drive cycle data with time scale on the a axis.
the top speed of 60 mph can not be achieved as we have some additional forces acting and so the car only run upto 67.2 mph.
The acceleration time to reach top speed pf 67.2 mph = 44.5 seconds.
The deceleration time from 80 to minimum = 5.06 seconds.
Plot-2:
Shows the changes in speed of the engine, motor and generator in RPM throughout the drive cycle.
Peak Engine Speed = 4676 RPM.
Peak motor Speed = 8103.5 RPM.
Peak generator speed = 12858.5 RPM.
Plot-3:
Shows the torque characteristics and its changes of engine, motor and generator in (Nm) throughout the drive cycle.
Peak Engine torque = 139 Nm.
Peak motor torque = 206.4 Nm.
Peak generator torque = 48.2 Nm.
Plot-4:
Shows the battery current values (A) and its changes for various acceleration inputs as per the Drive cycle.
The peak current discharge from the battery = 167.6 A.
The peak current charging to the battery = -152.46 A.
Plot-5:
Shows the battery state of charge (SOC) % and its charges corresponding to the driving inputs.
The state of charge decreased from 60 % to 30 % of charge in a time period of 49.3 seconds for the specified driving conditions.
Plot-6:
Shows the fuel economy as mile per gallon for the corresponding input driving conditions.
The maximum miles that the car run per gallon of fuel equivalent = 17.93 miles for the given vehicle as the specified driving conditions.
Observation:-
- The simmulation results for both the cases is found and we can see that the simulation 1 without the inclusion of hill climbling conditions and the wind drag velocity is much more efficient when compared to the simulation which includes the hill climbing conditions and the wind drag velocity.
- The vehicle was not able to achieve the required top speed though using the highest possible current dischage of that same battery used before.
- The state of charge also shows that the discharge is also high command to the simulation 1.
- Sp one can say. it is evident that the efficiency of no load vehicle is high comapred to the vehicle with additional load acting on them and also we have visualized this using the power train blockset.
4. Keeping all other parameters same, compare the simulated results of hybrid and pure electric powertrains.
Pure electric vehicle:-
- A battery electric vehicle or pure electric vehicle is a EV that exclusively uses chemical enertgy stored in rechargable battery packs with no secondary source of propulsion of energy.
- BEVs use electric vehicle motors and motor controllers instead of an conventional internal combustion enginers for propulsion. they derive all power from battery packs.
- So they do not produce any emissions of waste gas and they are eco friendly.
- they also have their own limitations such as range etc.
- example of pure ev is Nissan Leaf.
Observation:-
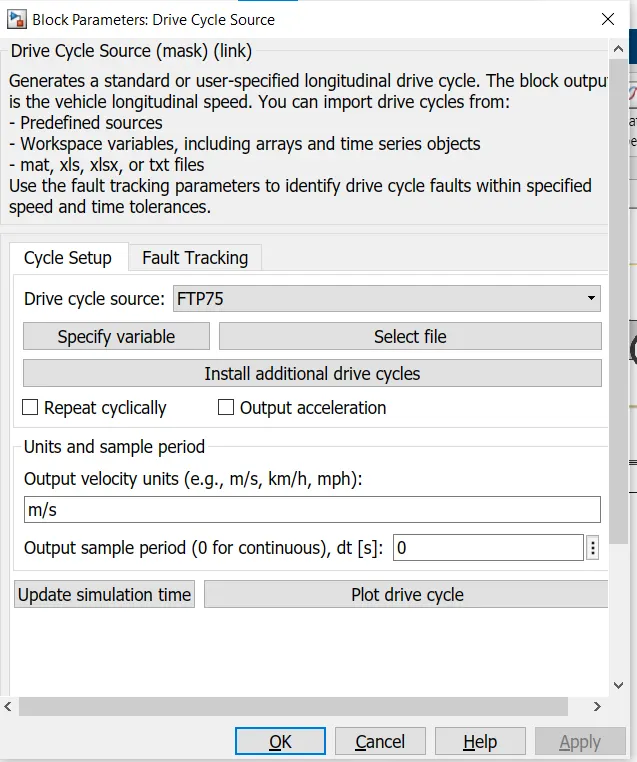
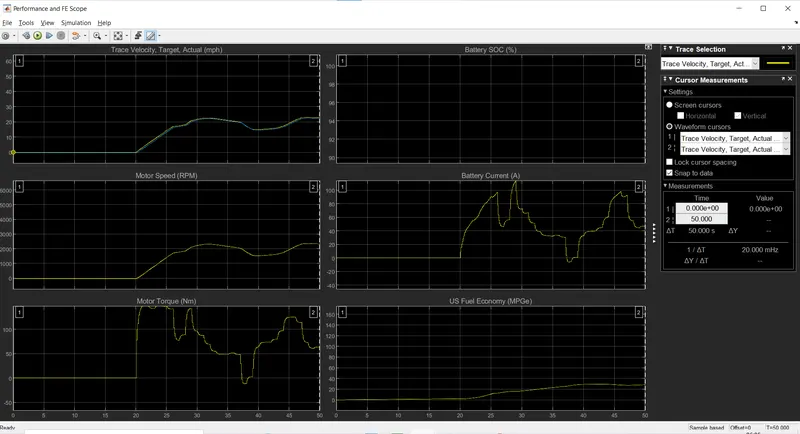
- The electric vehicle when compared with hybrid electric vehicle with the same envirnoment and drive cycle conditions results in less top speed achievement. The electric vehicle produces more values of motor speed and motor torque compared to the hybrid vehicle motr alone but hybrid vehicle when it combines the torque of both motor and its engine it is higher than the ev torque. This is responsible to pull the hybrid car at higher top speed compared to the pure electric.
- As the pure electric car here uses lithuim ion battery compared to the nickel metal hybride battery life discharging capacity and the rate od charging is higher in the pure electric car. As it is able to discharge in a fasr rate the motor can produce high amount of torque instantly compared to the hybrid vehicle
- The efficiency of the electric car is higher than the hybrid than the hybrid car which is evident from the miles per gallon of both of there cars.
- electric vehicle produces zero emissions whereas the hybrid one produce waste gas emission. These are some of the observations from the comparision of the above simulations using power trian blockser.