Simulation and Comparison of Hybrid and Pure Electric Powertrains
Q1. What is the difference between the mapped and dynamic model of engine, motor and generator? How can you change the model type?
Mapped Model System
- A mapped model uses a set of steady-state lookup tables to characterize the model performance. It is used quasi-steady-state engine simulations, where we have the engine data.
- In simple words, the mapped system uses lookup tables, to give output based on the input given rather than solving the system equation.
- The mapped system implements a model using stored data, for example, power, air mass flow, fuel flow, exhaust temperature, efficiency, and emission performance lookup tables. It gives macro-level statistics of the model behavior.
- In mapped systems, the computation level is less compared to the dynamic models.
- The mapped system is easy to solve and the results can be obtained fast.
- The output in a mapped system is the corresponding result based on the inputs given from the lookup table, if our input does not have a corresponding result in the lookup table we may not get any result.
Dynamic Model System
- A dynamic model decomposes the engine behavior into engine characteristics that are separated into lower-level components. By combining components in this way, the models capture the dynamic effects. The dynamic system helps to get a more detailed behavior of a model and its subcomponents.
- In simple words, the dynamic system solves the entire system and its subsystem based on the input to give the results.
- The dynamic system helps to analyze the impact of individual engine components on the overall performance. It gives micro-level statistics of the model behavior.
- A dynamic model system is computationally heavy compared to the mapped systems.
- Dynamic systems are complex and the time taken to obtain results is higher compared to mapped systems.
- The output in a dynamic system is obtained by solving the equation in the real time-based based on the given input.
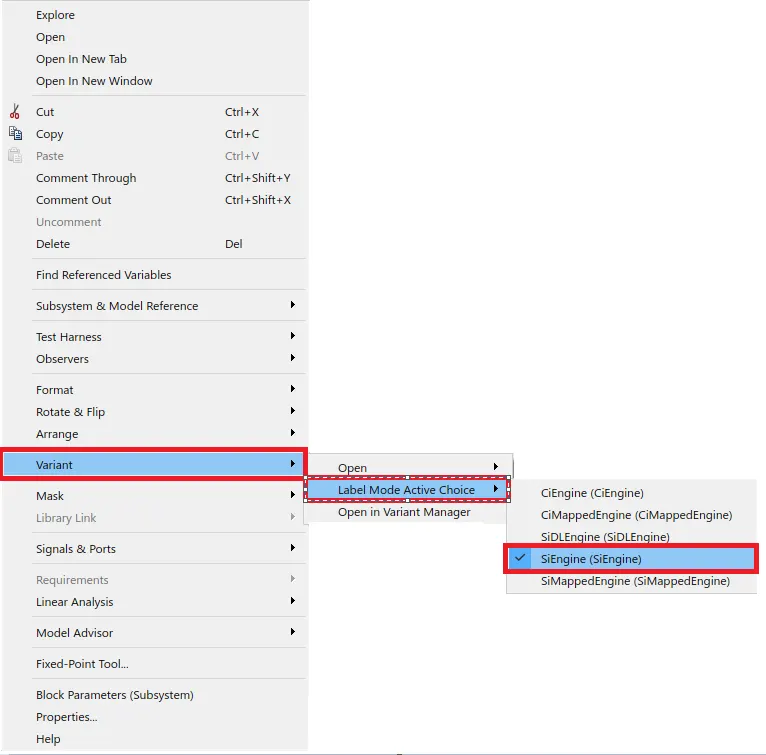
A model type can be changed from a mapped system to a dynamic system by implementing the model equations that solve the real-time input and gives the instantaneous result rater than using lookup tables for the result. Similarly, a dynamic system can be converted to a mapped system by removing the model equations and implementing a lookup table to give the result based on the given input.
In Matlab, the process is simpler as we can comment out that is disable a model or a subsystem based on our requirement.
For example, we have to change the Engine block from mapped to dynamic
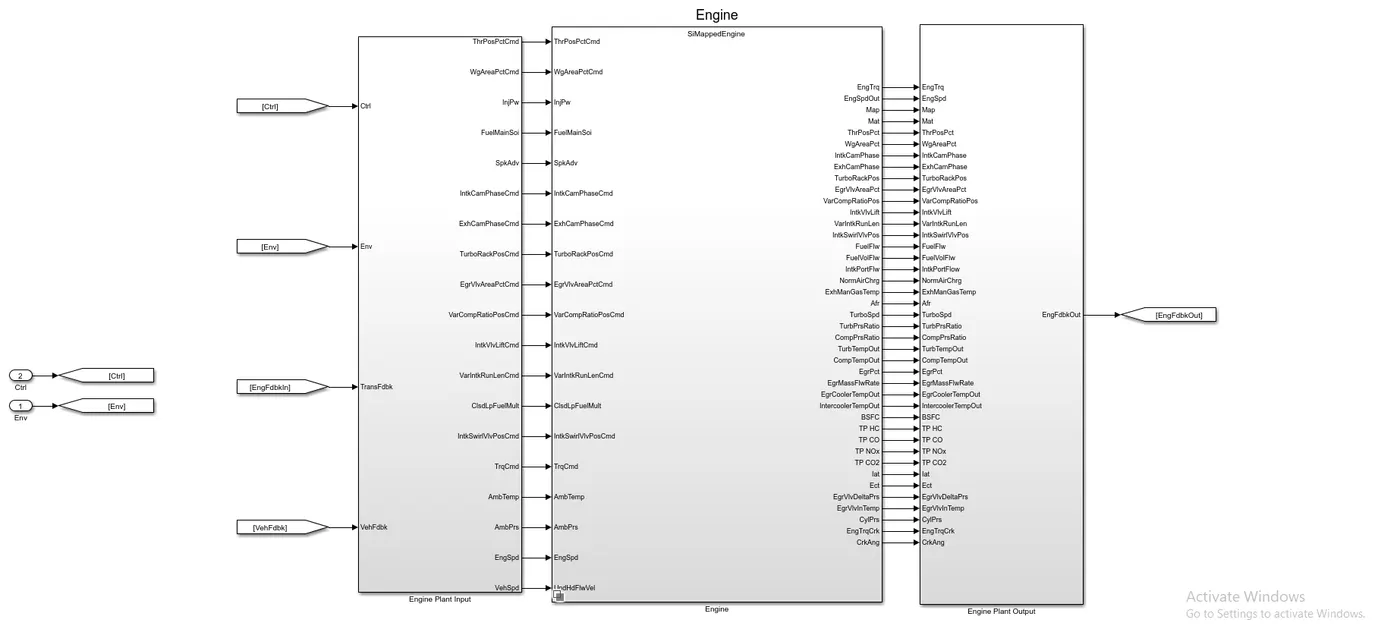
1. Right-click on the engine model, look for variants option
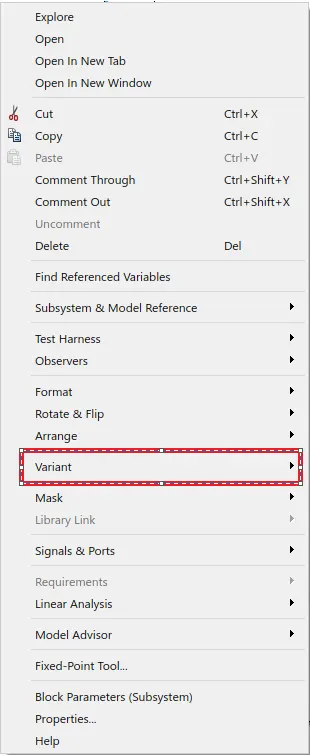
2. Under the variant option, we can open or choose from the different variants available
Q2. How does the model calculate miles per gallon? Which factors are considered to model fuel flow?
The fuel economy of an automobile relates distance traveled by a vehicle and the amount of fuel consumed. Consumption can be expressed in terms of volume of fuel to travel a distance, or the distance traveled per unit volume of fuel consumed.
Fuel economy is the relationship between the distance traveled and fuel consumed.
Fuel economy can be expressed in two ways:
1. Units of fuel per fixed distance
A lower number means more efficient, while a higher number means less efficient.
Generally expressed as liters per 100 kilometers (L/100 km) or gallons per 100 miles(g/100 miles).
2. Units of distance per fixed fuel unit
A higher number means more efficient, while a lower number means less efficient.
Generally expressed as Miles per gallon (mpg) or Kilometers per liter (km/L).
Miles per gallon gasoline equivalent
Miles per gallon gasoline-equivalent (MPGe or MPGge) is a measure of the average distance traveled per unit of energy consumed. MPGe is used by the United States Environmental Protection Agency (EPA) to compare the energy consumption of alternative fuel vehicles, plug-in electric vehicles, and other advanced technology vehicles with the energy consumption of conventional internal combustion vehicles rated in miles per U.S. gallon.
The unit of energy consumed is 33.7 Kilowatt-hours without regard to the efficiency of conversion of heat energy into electrical energy, also measured in Kilowatt-hours. The equivalence of this unit to energy in a gallon of gasoline is true if and only if the heat engine, generating equipment, and power delivery to the car battery are 100% efficient. Actual heat engines differ vastly from this assumption.
33.7 Kilowatt-hours= 1-gallon gasoline energy
`MPGe=(T otal mil es Driven)/[(Total En ergyOf All Fuel Cons umed )/(En eryOfOn e Gallon Of Gasoli n e)]=((T otal mil es Driven)*(En eryOfOn e Gallon Of Gasoli n e))/[(Total En ergyOf All Fuel Cons umed )`
Explanation for the MPGe Model
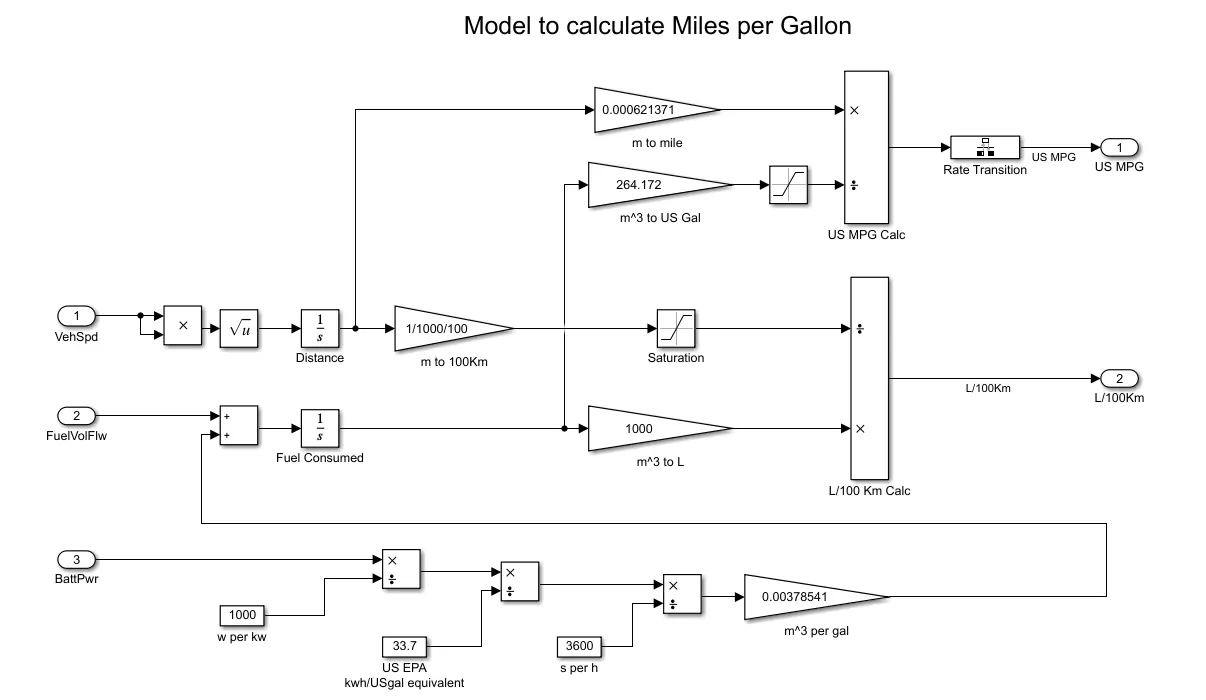
Input required for the MPGe model are:-
1. Instantaneous Speed
2. Instantaneous Fuel Flow
3. Instantaneous Battery Power
Working of the Model
The instantaneous speed is used to calculate the total distance traveled using an integrator block and the distance is covered to miles.
The instantaneous battery power is converted into kilowatt and then power is converted to equivalent energy in gallons, from gallons it is converted to m3 using the gain block and is merged with the fuel using the addition block.
The instantaneous fuel flow from the engine and equivalent from the battery pack is used to calculate the total fuel consumed using an integrator block and the fuel is converted from m^3 to liters.
Using the distance and the fuel flow the Miles per Galon (MPG) and Litre per 100km are found.
Fuel Flow
To calculate the fuel flow, the SI Core Engine block uses fuel injector characteristics and fuel injector pulse-width.
Factors effecting the fuel flow are Engine Speed, No. of Cylinders, Fuel Injector pulse width and the Fuel Injector Slope.
`m_(fuel)=(NS_(i nj)Pw_(i nj)N_(cyl))/(Cps((60s)/min)((1000mg)/g)` where
`m_(fuel)` =Fuel mass flow in g/s
`N` =Engine speed in rpm
`S_(i nj)` =Fuel injector slope in mg/ms
`Pw_(i nj)` =Fuel injector pulse width in ms
`N(cyl)` =Number of engine cylinders
`Cps` =Crankshaft revolutions per power stroke, rev/stroke
`w` =Engine rotational speed in rad/sec
To calculate the fuel economy for high-fidelity models, the block uses the volumetric fuel flow.
`Q_(fuel)=m_(fuel)/(((1000kg)/m^3)Sg_(fuel))`
`Q_(fuel)` =Volumetric fuel flow
`m_(fuel)` =Fuel mass flow in g/s
`Sg_(fuel)` =Specific gravity of fuel
Q3. Run the HEV ReferenceApplication with the WOT drive cycle. Change the grade and wind velocity in the environment block. Comment on the results.
HEV ReferenceApplication
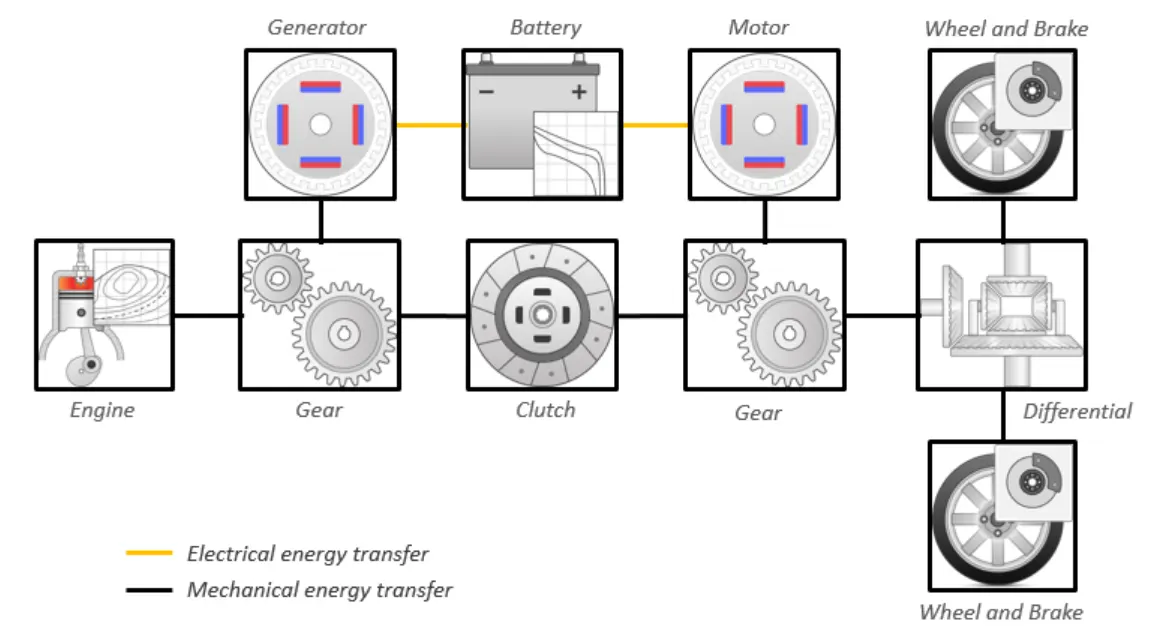
The hybrid electric vehicle reference application represents a full multimode hybrid electric vehicle (HEV) model with an internal combustion engine, transmission, battery, motor, generator, and associated powertrain control algorithms.
HEV reference application is configured with:
-
Mapped motor and generator
-
1.5–L spark-ignition (SI) dynamic engine
This diagram shows the powertrain configuration.
Wide Open Throttle(WOT)
This condition is when a driver opens the throttle to full or nearly full open. This test condition is used to study the response of the vehicle at a given load when the throttle is applied. It gives better insight of the vehicle in real-world characteristics such as top speed, time taken to reach a specified speed limit, etc at a given test condition.
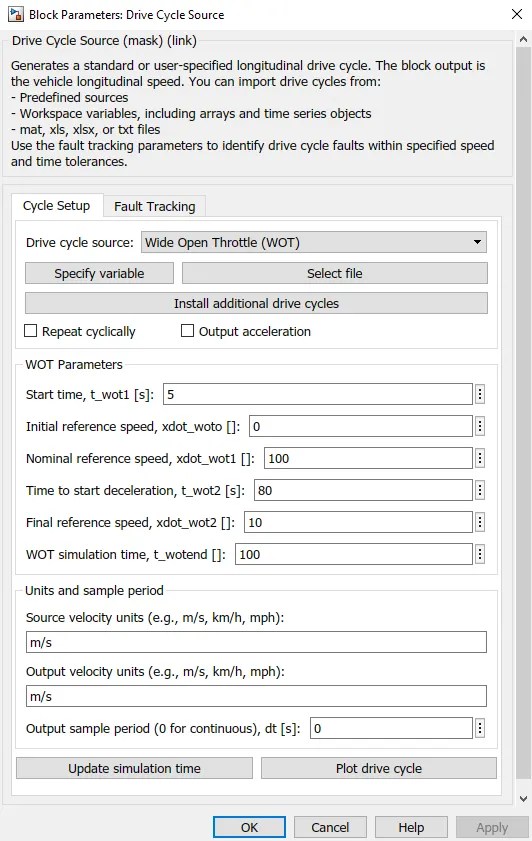
WOT Drive Cycle Source Parameters
For the first 5 seconds, the input speed is zero and the initial speed of the vehicle is zero.
From t=6 to t=80 the vehicle is given full throttle to obtain a speed of 100m/s.
From t=80 to t=100 the vehicle is set to decelerate from 100m/s to 10m/s.
Output from Scope
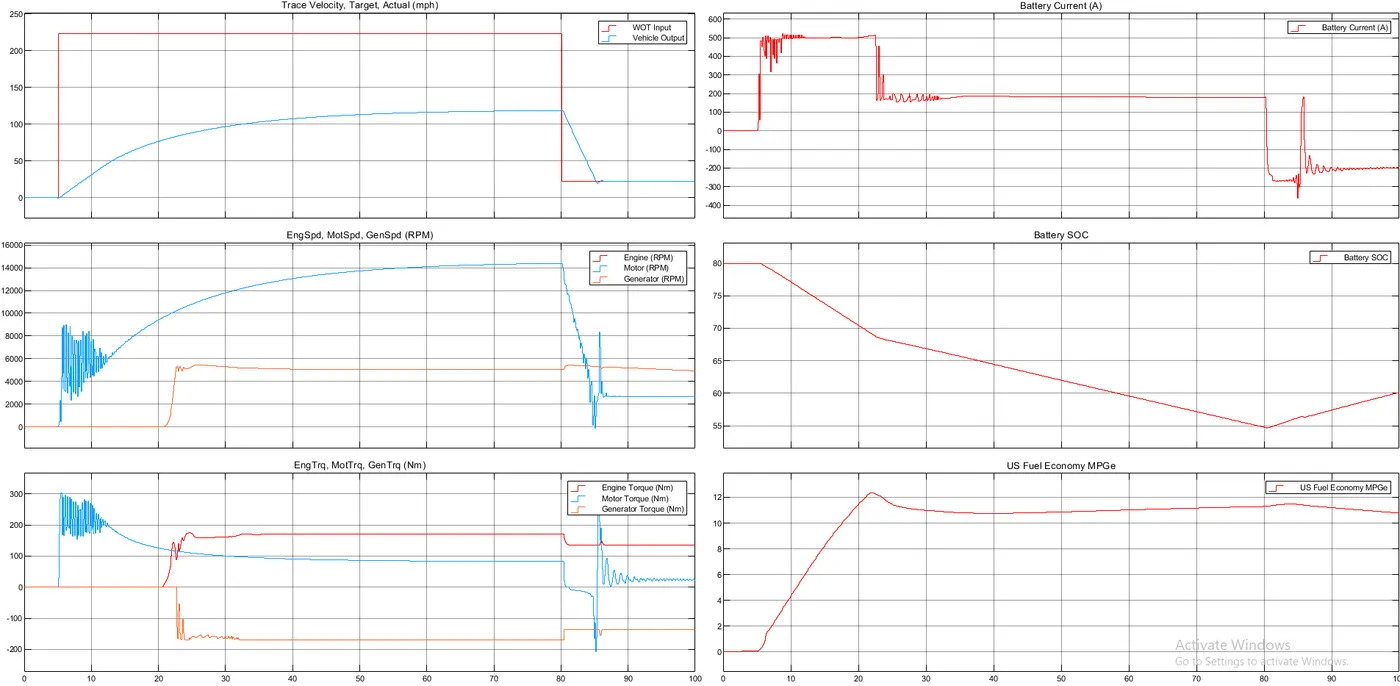
1. Trace velocity and Target Actual (mph)
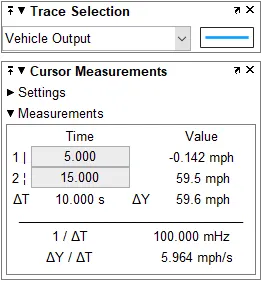
The top speed achieved by the vehicle is 119mph (191.5kmph) and the time taken for acceleration from 0 to 59.5mph(95.75kmph) is 10 seconds.
Acceleration in 10 seconds
2. Battery Current(A)
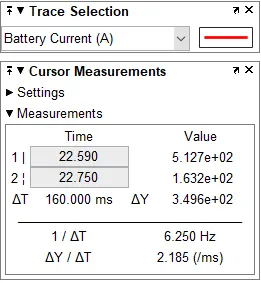
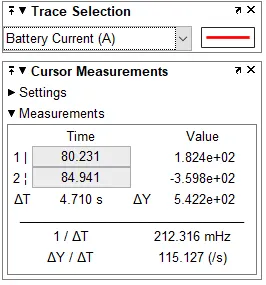
At t=5 sec we can see that the battery supplies the maximum current permissible by the controller in the constant torque region of the motor, then the current drops from 512.7A at t=22.59sec to 162.2A at t=22.75sec that marks the starting of the engine and the generator and hence the load on the battery is decreased. At t=80sec the vehicle decelerates and the battery experiences a flow of negative current that shows the flow of current is from the motor to the battery.
3. EngSpd,MotSpd,GenSpd(RPM)
The motor starts to rotate at t=5 at about goes from 0 to 6000±2500 RPM, this fluctuation is caused due to difference in wheel speed and the motor speed. It takes about 5-7 seconds to stabilize the motor speed. The increase in rpm of the motor is directly proportional to the speed of the vehicle. At t=80 when the vehicle starts to decelerate the motor rpm drops with the vehicle speed but the engine and generator keep running in its max efficiency range but at decreased rpm as the load from the vehicle is very less.
4. Battery SOC
The battery state of charge is proportional to the amount of current drawn from the battery. At t=5 the vehicle starts moving and the battery soc drops at a constant slope until the engine is started at t=22.5 sec. As the load now is distributed between the engine and the motor the battery soc discharge slope is reduced. The initial slope for discharge was 0.767%/sec and after starting of the engine it was reduced to 0.25%/sec.
5. EngTrq,MotTrq,GenTrq (Nm)
Initially, the motor torque is high as it operates in a constant torque region, and with increase in rpm the torque decreases specifying the constant power region for the motor. The engine mostly operates at a constant torque range depending upon the generator load requirement.
6. US Fuel Economy MPGe
The miles per gallon is usually high when we operate on battery and as the engine starts the MPGe values drop and become constant as the vehicles operate on both engine and the battery.
Results for HEV
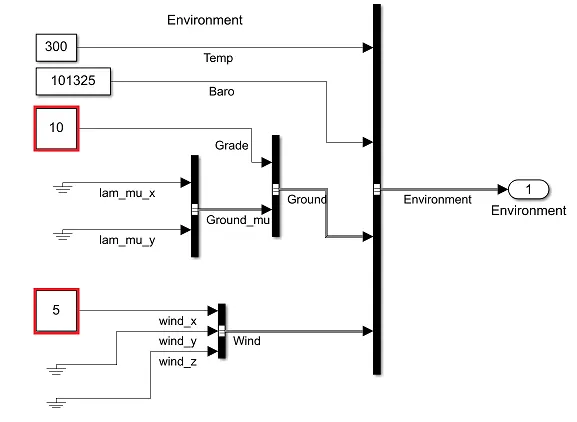
Changing the grade and wind velocity in the environment block
The grade angle is given as 10° and the wind velocity as 5m/s.
The input from the Environment block is sent to the Vehicle body to calculate the effect caused by the gradient and wind velocity on the vehicle body.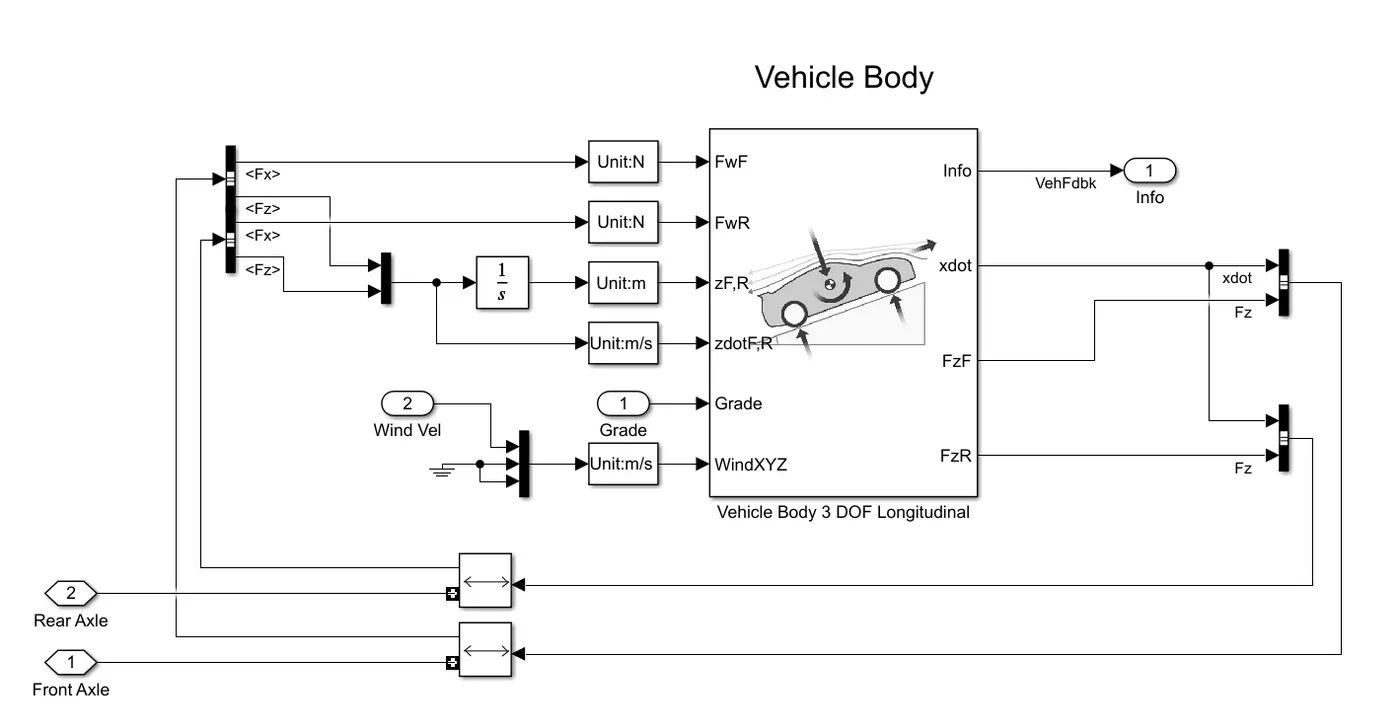
Results for Change in Gradient and Wind Velocity
The change in gradient and wind velocity had on huge impact on the overall vehicle performance. The vehicle top speed dropped from 119mph to 63.8mph. Initially, motor speed behavior was the same but as the load was increased the motor speed was less and the torque output was more. The values of MPGe was reduced as the vehicle traveled with low speed covering less area and the behavior of the Battery SOC remained same.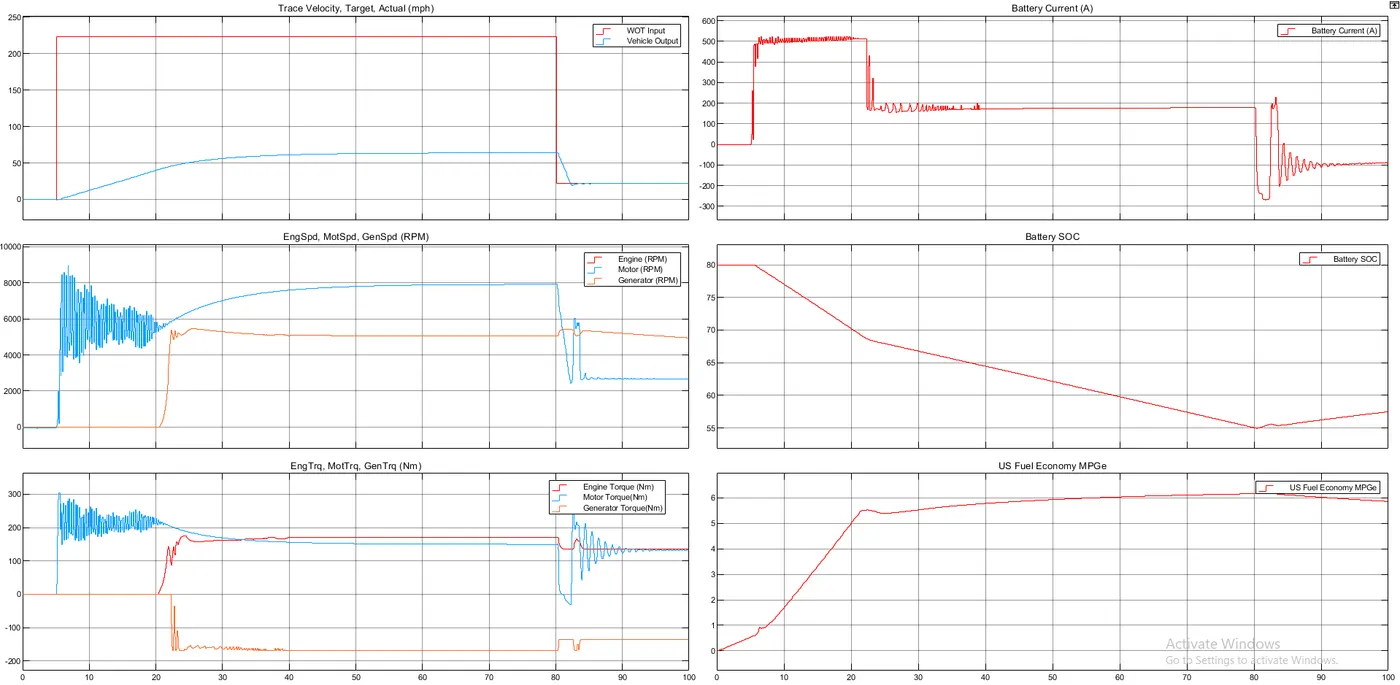
Q4. Keeping all other parameters the same, compare the simulated results of hybrid and pure electric powertrains.
The electric vehicle (EV) reference application represents a fully electric vehicle model with a motor-generator, battery, direct-drive transmission, and associated powertrain control algorithms.
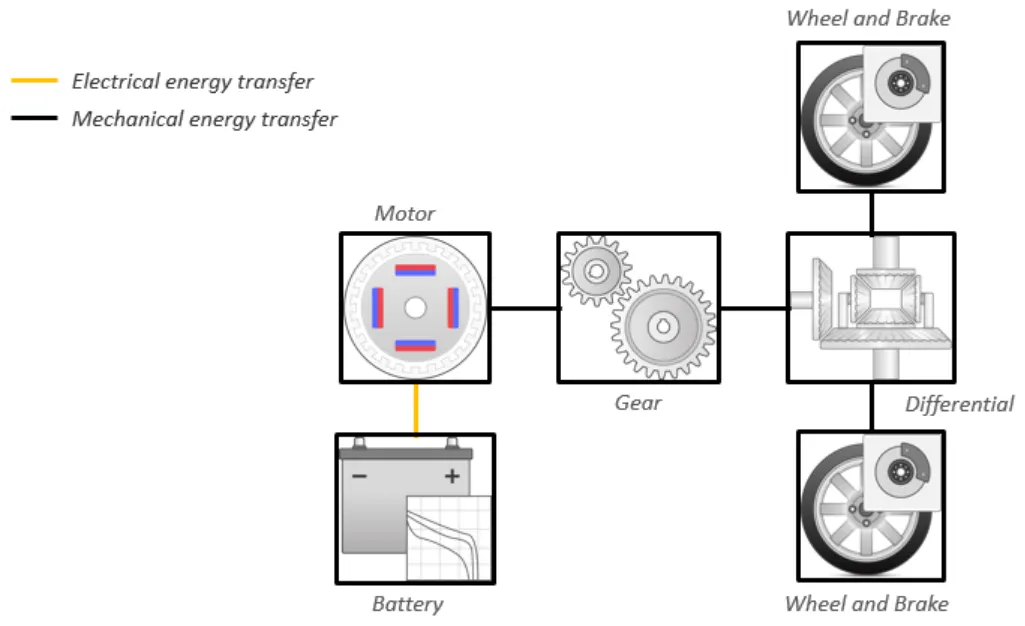
Comparison between HEV and EV
1. Trace velocity and Target Actual (mph)
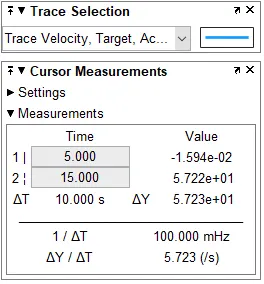
The top speed achieved by the HEV vehicle is 119mph (191.5kmph) and EV is 115.6(186.04kmph). The acceleration in 10 sec for HEV is 0 to 59.5mph(95.75kmph) and for EV is 0 to 57.2mph(92.05kmph).
Acceleration in 10 seconds
2. Battery Current(A)
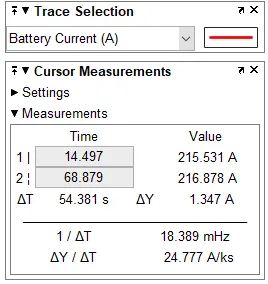
In HEV, the load of the vehicles gets distributed between the battery and the vehicle when the engine is running whereas in EV the entire load lies only on the battery. The peak current in the HEV was 500A and in the case of EV is around 220A which nearly less than half of HEV.
3. EngSpd,MotSpd,GenSpd(RPM)
Initially, the motor RPM in the case HEV is 6000±2500 and in EV is around 4000 which is less compared to the HEV. The peak RPM is less in HEV compared to EV with a little less vehicle speed.
4. Battery SOC
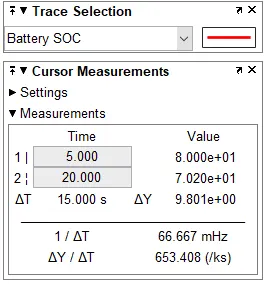
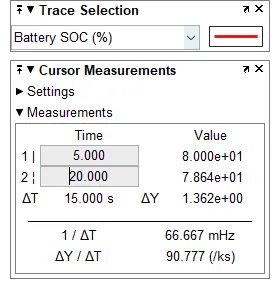
The battery state of charge is proportional to the amount of current drawn from the battery. The EV vehicles seem to be more efficient as the battery SOC drop in case of HEV it is 10% drop in 10 seconds and in the case of EV it is 1.3% in 10 seconds.
5. Torque (Nm)
Initially, the motor torque is high as it operates in a constant torque region, and with increase in rpm, the torque decreases specifying the constant power region for the motor.
6. US Fuel Economy MPGe
The miles per gallon for an EV is much higher compared to HEV as the vehicle operates only on the battery, and generally, the overall efficiency of an electrical system is 80-90% compared to the efficiency of an IC engine vehicle is about 20-35%. In the case of HEV MPGe value drop with stating of the IC engine and in the case of EV keeps on increasing with the speed and the distance covered by the vehicle.
Results for EV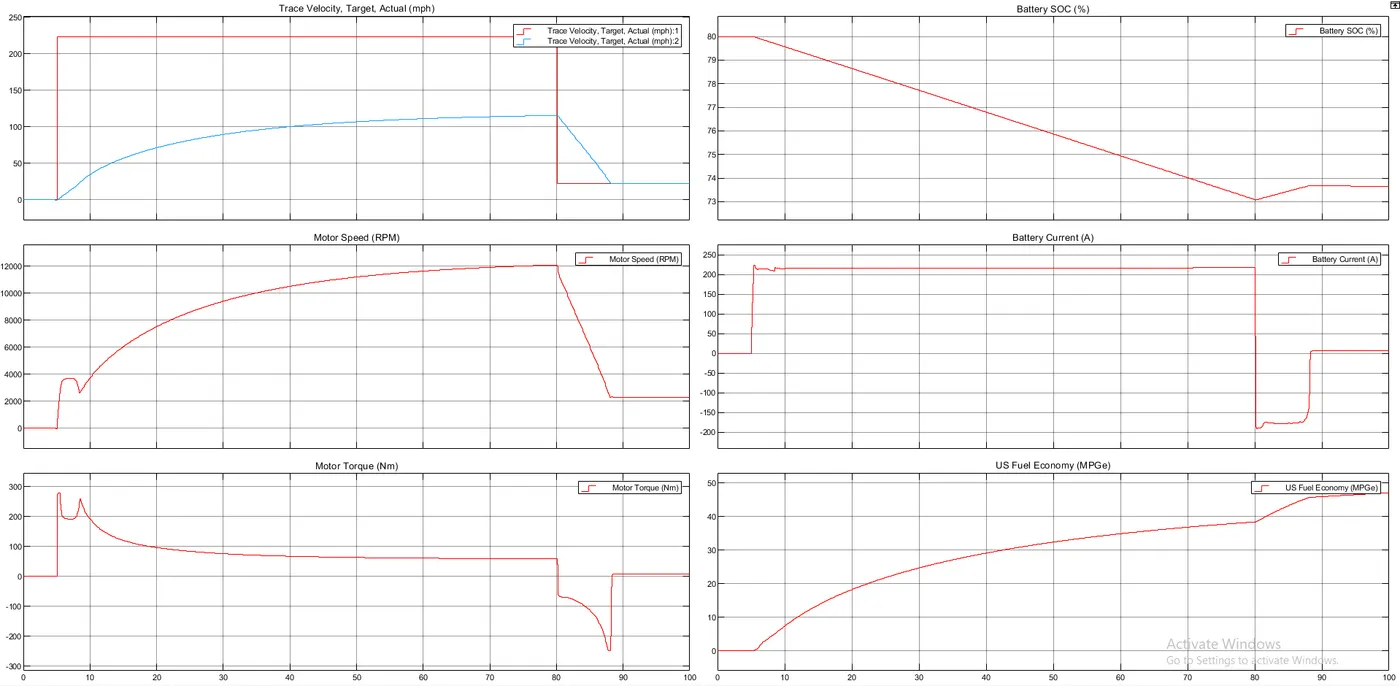
References
1. https://en.wikipedia.org/wiki/Miles_per_gallon_gasoline_equivalent
2. https://en.wikipedia.org/wiki/Fuel_economy_in_automobiles
3. https://in.mathworks.com/help/