Week-4 Challenge WOT Condition Part-2
Week-4 Challenge WOT Condition Part-2
Q1. What is the difference between mapped and dynamic model of engine, motor and generator? How can you change model type?
Answer:
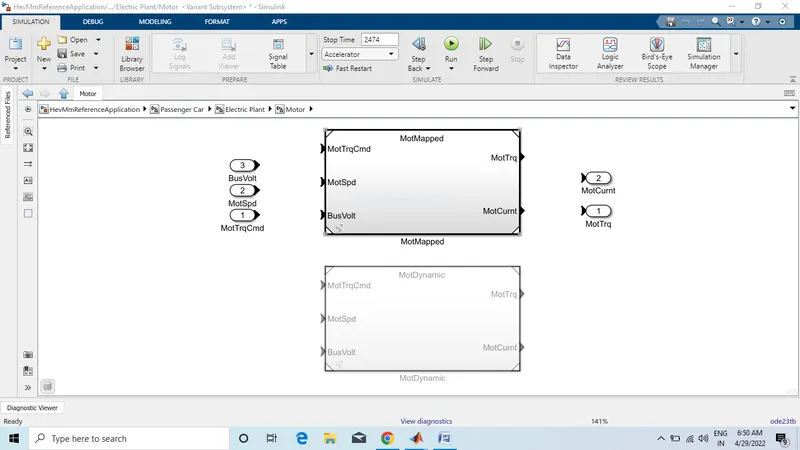
- In this model first subsystem is motor mapped subsystem.
- Seccond subsystem is dynamic mapped subsytem.
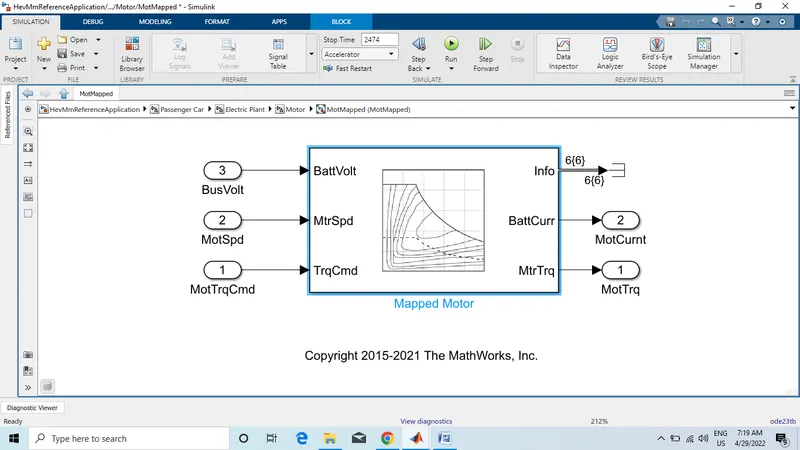
Mapped Model:
- The Mapped Motorblock implements a mapped motor and drive electronics operating in torque-control mode. The output torque tracks the torque reference demand and includes a motor-response and drive-response time constant. Use the block for fast system-level simulations when you do not know detailed motor parameters, for example, for motor power and torque tradeoff studies. The block assumes that the speed fluctuations due to mechanical load do not affect the motor torque tracking.
- Model uses a set of steady-state lookup tables to characterize engine performance.
- The tables provide overall engine characteristics, including actual torque, fuel flow rate, BSFC, and engine-out exhaust emissions.
Usages
- If you have engine data from a dynamometer or a design tool like GT-POWER.
- For quasi steady-state engine simulations.
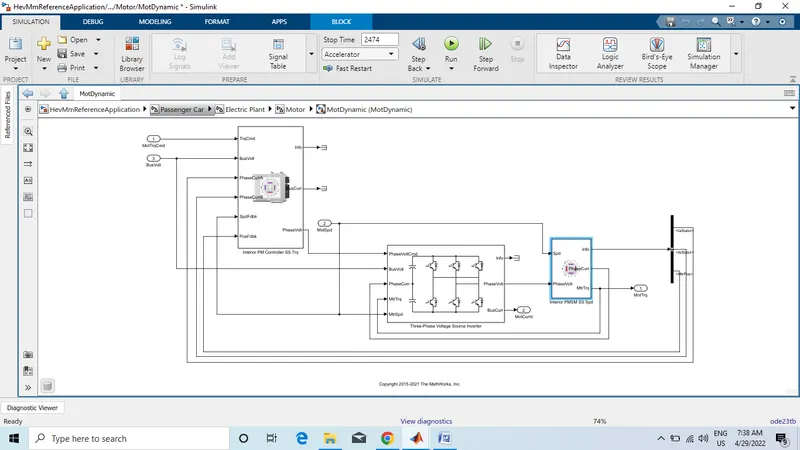
Dynamic Model:
- Model decomposes the engine behavior into engine characteristics that are separated into lower-level components. By combining components in this way, the models capture the dynamic effects.
- This dynamic model have use interior PM conroller- The Interior PM Controllerblock implements a torque-based, field-oriented controller for an internal permanent magnet synchronous motor (PMSM) with an optional outer-loop speed controller. The internal torque control implements strategies for achieving maximum torque per ampere (MTPA) and weakening the magnetic flux. You can specify either the speed or torque control type.
- The Interior PM Controllerimplements equations for speed control, torque determination, regulators, transforms, and motors.
- This model have use three-phase voltage source inverter- The Three-Phase Voltage Source Inverterblock implements a three-phase voltage source inverter that generates neutral voltage commands for a balanced three-phase load. Configure the voltage switching function for continuous vector modulation or inverter switch input signals. You can incorporate the block into a closed-loop model to simulate a power inverter. The block controls the ideal switch states.
- This model have use interior PMSM- The Interior PMSMblock implements a three-phase interior permanent magnet synchronous motor (PMSM) with sinusoidal back electromotive force. The block uses the three-phase input voltages to regulate the individual phase currents, allowing control of the motor torque or speed.
- By default, the block sets the Simulation typeparameter to Continuous to use a continuous sample time during simulation. If you want to generate code for fixed-step double- and single-precision targets, considering setting the parameter to Discrete. Then specify a Sample Time, Ts
Usages:
- If you need a more detailed dynamic model and have component-level data.
- To analyze the impact of individual engine components on the overall performance.
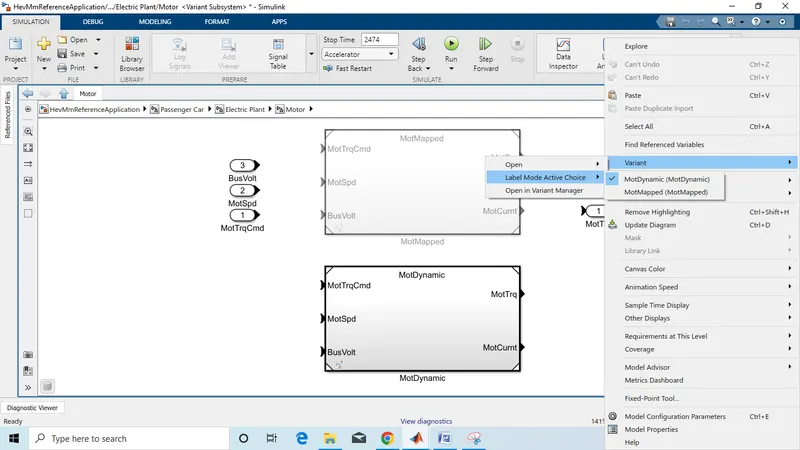
How change model type:
- First open HEV multimode reference application on matlab .
- Then open passenger car subsystem model.
- Then open electric plant subsystem.
- Then double click and open motor subsystem.
- Then rignt click any where in this screen .
- After opening this option list click on ‘varient’ then click on ‘lebel mode option’ and change the mode. How to change shown in below fig.
Q2. How does the model calculate miles per gallon? Which factors are considered to model fuel flow?
Answer:
- MPG stands for miles per gallon and is used to show how far your car can travel for every gallon (or 4.55 litres) of fuel it uses. For example, if you own a car that returns 50mpg and its fuel tank only has one gallon of petrol or diesel in it, you’ll drive 50 miles before the car runs out of fuel.
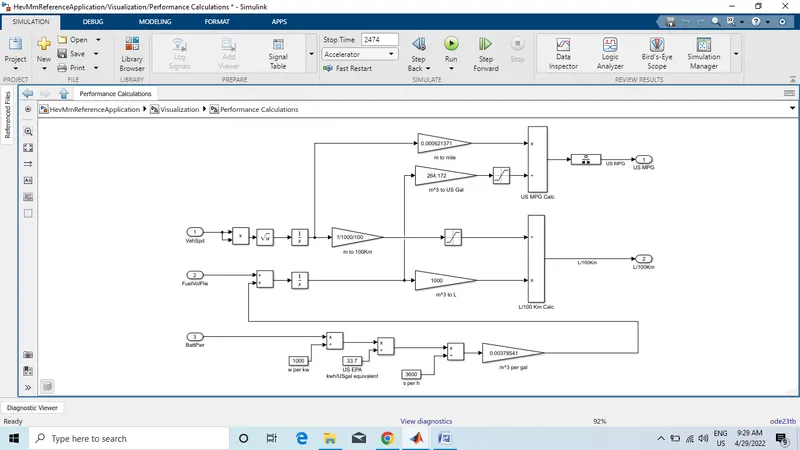
- This vehicle model have fuel and battery both energy source are available . powertrain blockset provide miles per gallon messaurement system. Shown below fig.
Vehicle speed :
- Vehicle speed is important factor while mesaure fuel consumtion in the vehicle. Vehicle speed change accordingly fuel consumtion scenarios of the vehicle get changed.
- For masurement this model have used product block , sqrt block , integrator block , gain block, saturation block. All the blocks connected with product.
- Gain block use for convert the distance m to km. so gain block value is 1/1000/100.
- Integrator block used for calculate the distance according to Continuous-time integration of the input signal.
- Saturation block used for lower limit function.
- Product block use for The Productblock outputs the result of multiplying two inputs: two scalars, a scalar and a nonscalar, or two nonscalars that have the same dimensions. Product block parameter are L/100 km.

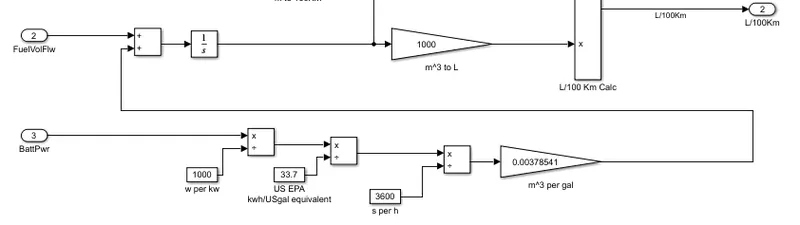
Fuel power and battery power:
- Fuel power convert m^3 to liter.
- Battery power convert to m^3 to gallon.
- Battery power use three constant block. First constant block use for convert the battery power watt to kilo-watt. Constant block value is 1000.
- Seccond constant block use for convert emissons or energy data into concrete terms you can understand such as the annual CO2 emissions of vehicles. Constant block value is 33.7.
- Thired constant block use for convert the time sec to hour.
- All the constant block connected with divded block.
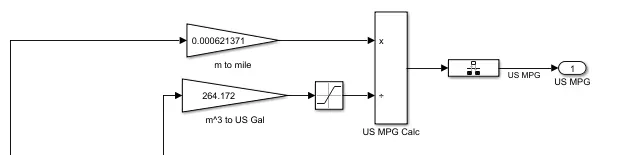
Calculating miles per gallon:
- Then the inputs from the vehicle the distance I found (in meters) is taken into the calculation and it is converted to the miles by multiplying 0.000621371.
- Then the inputs from fuel flow ( battery energy + fuel energy ) taken in mA3 is converted into equivelent us gallon by multiplying with 264.172.
- Then two input connected with devide block. Devide block connected with rate transition block.
- Rate transition block use for handle data transfer between different rates and tasks.
Q3. Run the HEV ReferenceApplication with WOT drive cycle. Change the grade and wind velocity in the environment block. Comment on the results.
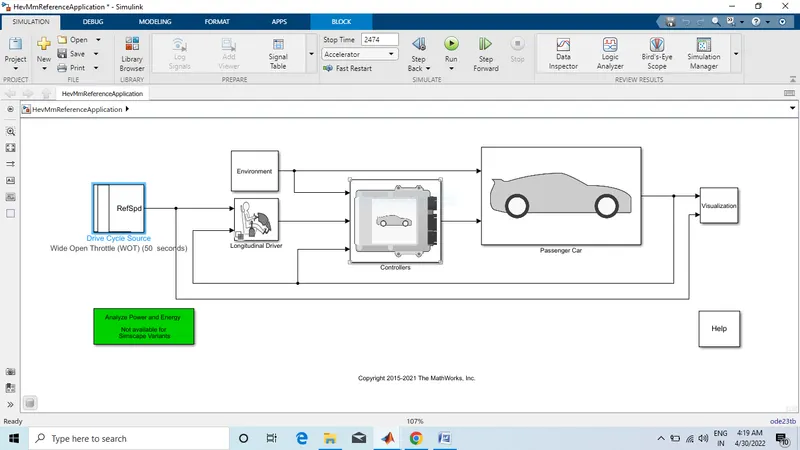
Answer: First open HEV multimode reference application model on matlab simulink.
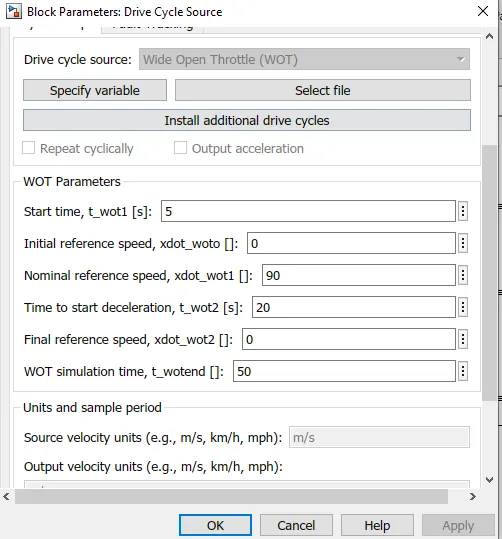
Then double click on drive cycle block and add WOT drive cycle , simulation run time is 50 sec.
Condition 1:
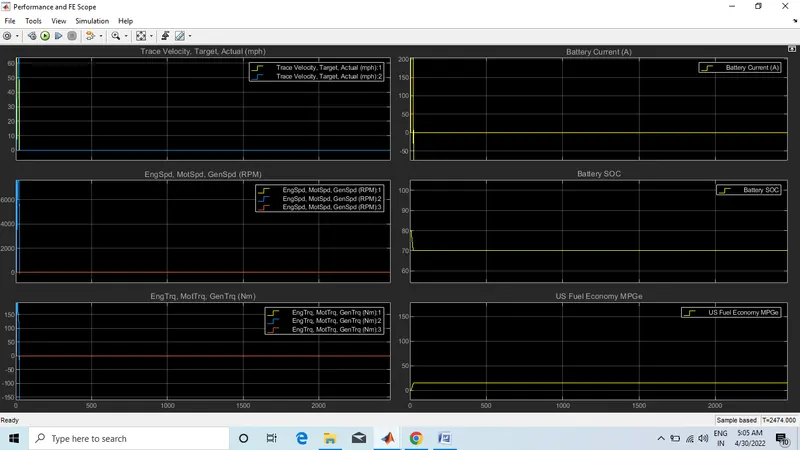
Nominal reference speed of this model is 90 , all the rest of data in default state. Then run this simulation. Run the simulation with WOT drive cycle.
Observation 1:
Plot 1: Trace velocity ,target acrual graph- Trace velocity and vehicle actual velocity not match with each other. Trace velocity in starting with transient state condition , actual velocity is constant.
Plot 2: Eng speed , motor speed and generator speed graph- in this graph engine speed , motor speed , generator speed achived 6000 rpm speed at a time , this time output become in transient state condition then output become constant stady state condition.
Plot 3: Engine torque, motor torque, generator torque graph- when engine speed is increase engine torque is decrease but motor and generator torque is in stable condition.
Plot 4: Battery current graph-in starting Battery current fluctuating like in-rush current then current become stady state condition.
Plot 5: Battery soc graph- in battery state of charge condition battery charge decrease some time then battery behave like stable source.
Plot 6: US Fuel economy MPGs- This graph at starting increase then become constant
Condition 2:
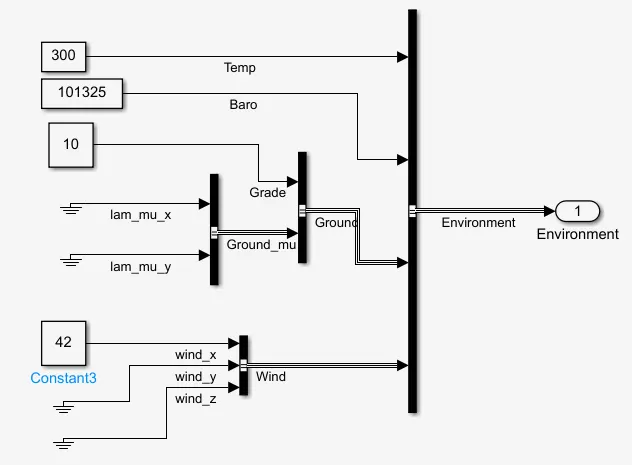
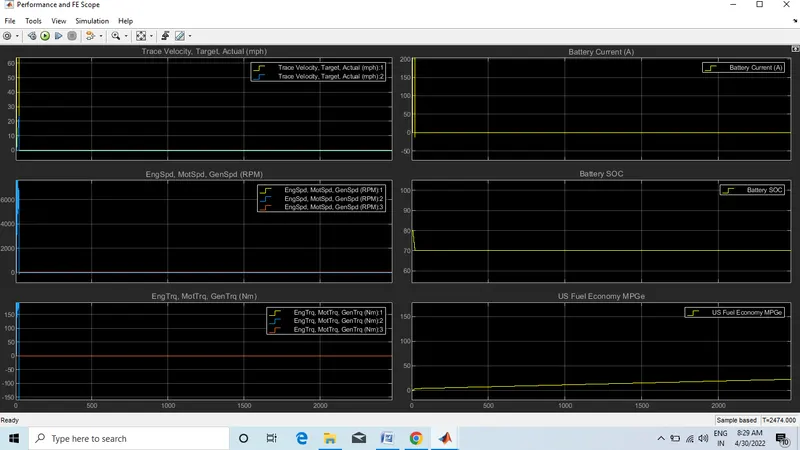
Change the grade and wind velocity in the environment block. Grade is 10 and wind velocity is 42 and others data remain same. Then run this model.
Observation 2:
Plot 1: Trace velocity ,target acrual graph- Trace velocity and vehicle actual velocity not match with each other. Trace velocity in starting with transient state condition , actual velocity is constant.
Plot 2: Eng speed , motor speed and generator speed graph- in this graph engine speed , motor speed , generator speed achived 6000 rpm speed at a time , this time output become in transient state condition then output become constant stady state condition.
Plot 3: Engine torque, motor torque, generator torque graph- when engine speed is increase engine torque is decrease but motor and generator torque is in stable condition.
Plot 4: Battery current graph-in starting Battery current fluctuating like in-rush current then current become stady state condition.
Plot 5: Battery soc graph- in this condition battery state of charge graph is remain same.charge decrease some time then battery behave like stable source.
Plot 6: US Fuel economy MPGs- as compare to both the graph, this graph is increaseing at certain time period then become instable model.
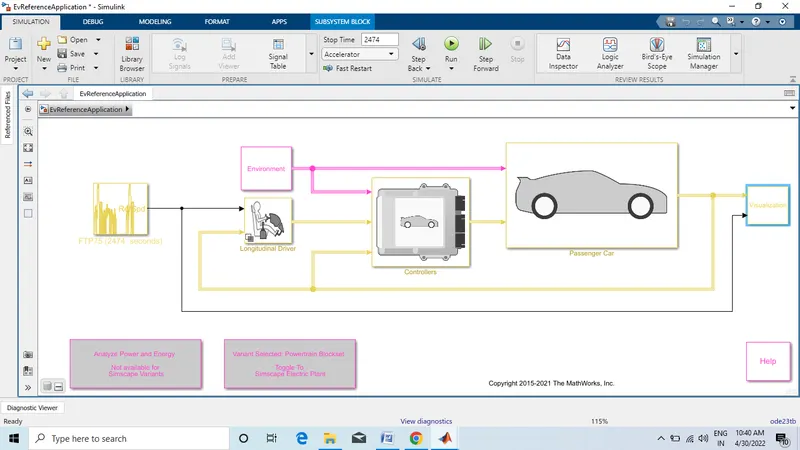
Q4. Keeping all other parameters same, compare the simulated results of hybrid and pure electric powertrains.
Answer:
Pure Electric vehicle:
An electric vehicle (EV) is one that operates on an electric motor, instead of an internal-combustion engine that generates power by burning a mix of fuel and gases. Therefore, such as vehicle is seen as a possible replacement for current-generation automobile, in order to address the issue of rising pollution, global warming, depleting natural resources, etc. Though the concept of electric vehicles has been around for a long time, it has drawn a considerable amount of interest in the past decade amid a rising carbon footprint and other environmental impacts of fuel-based vehicles.
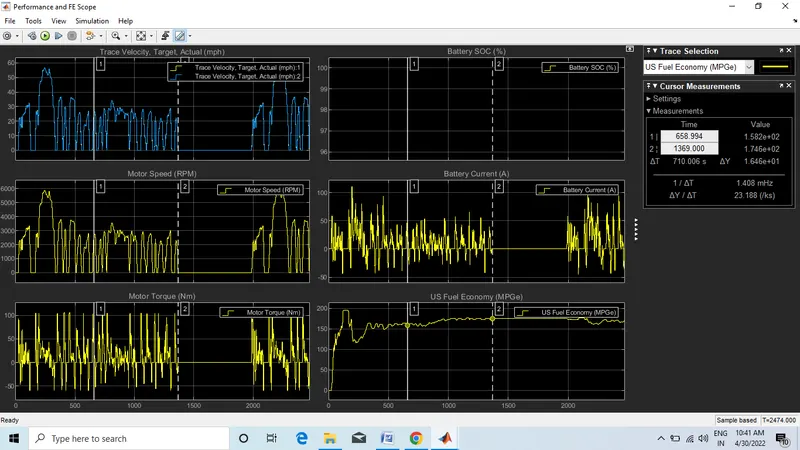
Output Result:
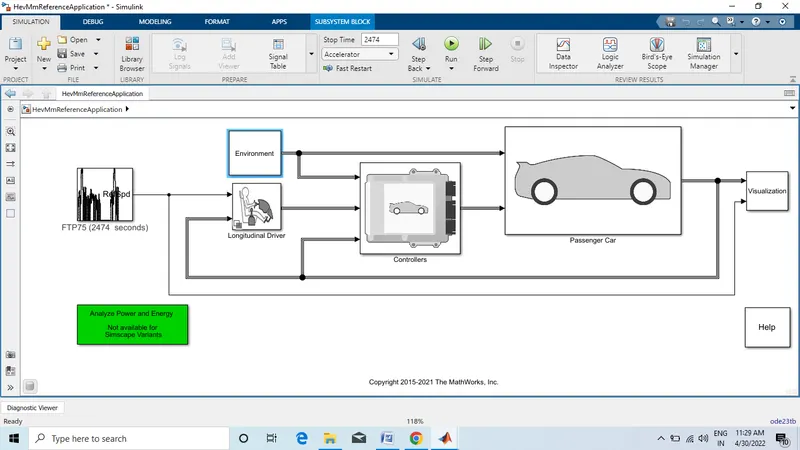
Hybrid electric vehicle:
A hybrid electric vehicle (HEV) is a type of hybrid vehicle that combines a conventional internal combustion engine (ICE) system with an electric propulsion system (hybrid vehicle drivetrain). The presence of the electric powertrain is intended to achieve either better fuel economy than a conventional vehicle or better performance. There is a variety of HEV types and the degree to which each function as an electric vehicle (EV) also varies. The most common form of HEV is the hybrid electric car, although hybrid electric trucks (pickups and tractors), buses, boats and aircraft also exist.
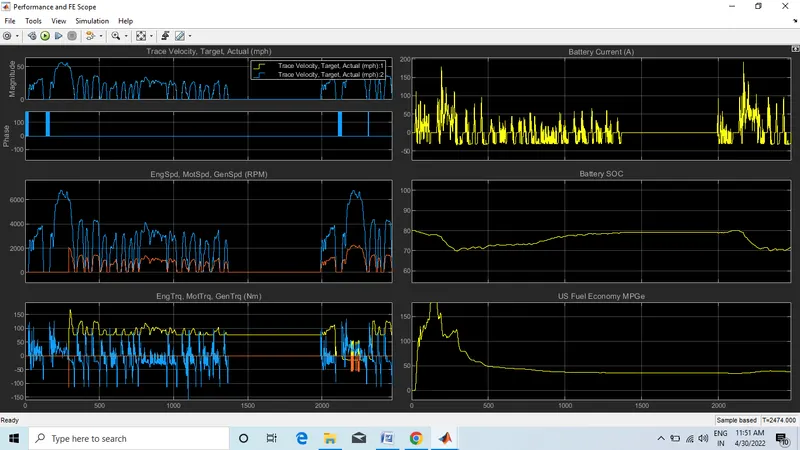
Output Result:
Observation ( pure electric vehicle vs Hybrid electric vehicle):
- When compare with electric vehicle and hybrid electric vehicle with the same environment and drive cycle condition results in less top speed achievement. The electric vehicle produces more values of motor speed motor torque compared to hybrid electric vehicle.
- As the pure electric vehicle uses lithium-ion battery compared to the nickel-metal hybrid battery the discharge capacity and the rate of charge capacity higher in pure electric vehicle.
- The efficiency of electric vehicle higher than hybrid electric vehicle.
- Electric vehicle prouduce zero emission whereas the hybrid electric vehicle produce gas emission. These are some observation from the comparision of the above simulation using pwertrain blockset.