Week-4 Challenge WOT Condition Part-2
1.What is the difference between mapped and dynamic model of engine, motor and generator? How can you change model type?
| Mapped model | Dynamic model |
|
Mapped Engine
Mapped Motor
Mapped Generator
|
Dynamic Engine
Dynamic motor
Dynamic Generator
|
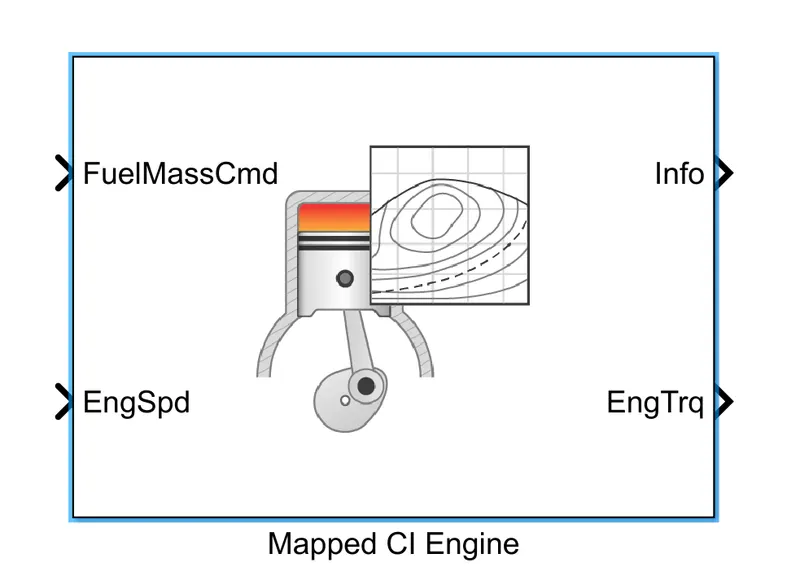
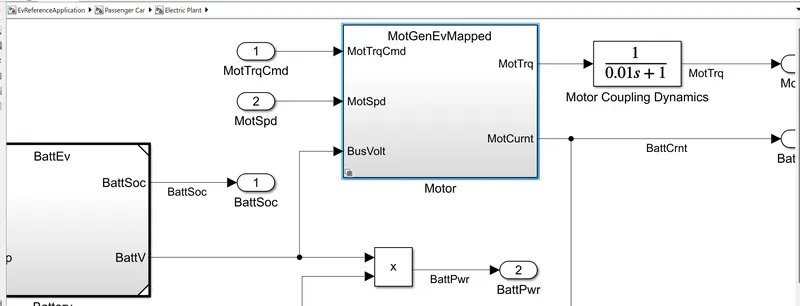
Mapped Motor:
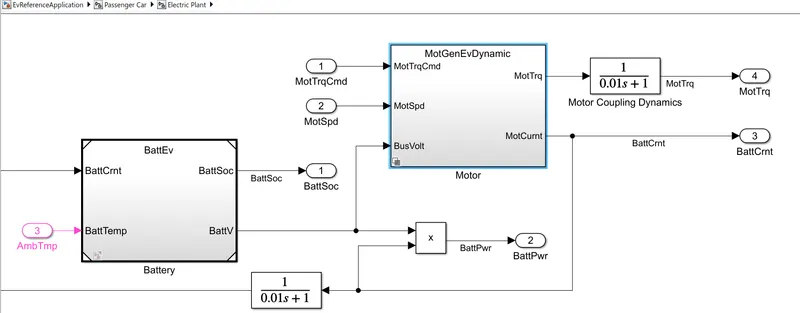
Dynamic Motor:
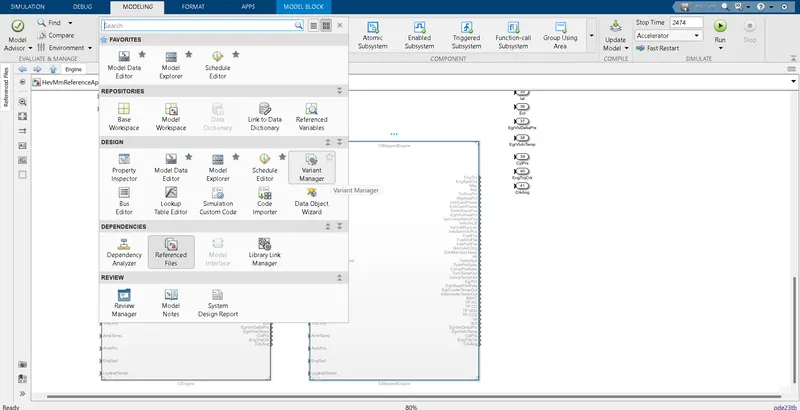
To change the model type:
Here we are going to change Mapped generator to dynamic generator.Goto modelling and select variant manager
Then goto generator part and click GenDynamic and right click and hit 'Set as Label Mode Active Choice'
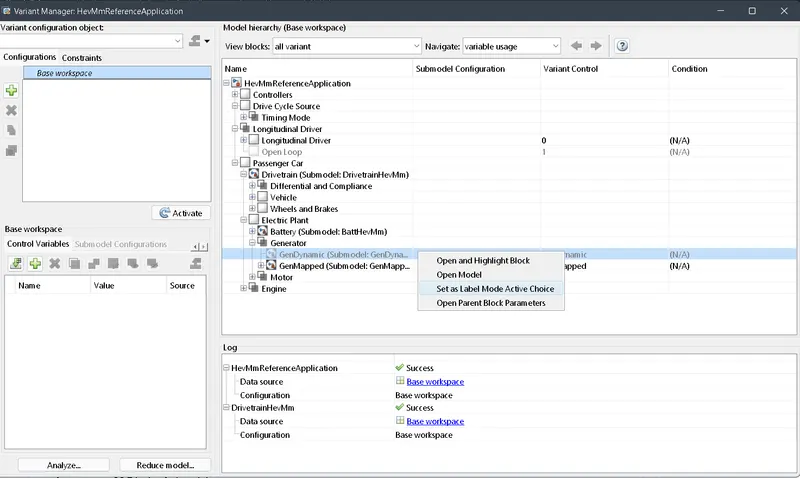
We can also use this method to change mapped to dynamic or viceversa for any part.
2. How does the model calculate miles per gallon? Which factors are considered to model fuel flow?
Miles per gallon gasoline equivalent (MPGe or MPGge) is a measure of the average distance travelled per unit of energy consumed. MPGe is used by the US Environmental Protection Agency (EPA) to compare energy consumption of alternate fuel vehicles, Plug-in electric vehicles and other advanced technology vehicles with the energy consumption of conventional internal combustion vehicles rated in miles per US gallon.That is 1 gallon of gas has 33.7kWh equivalent electricity.
The unit of energy consumed is deemed to be 33.7 kWh without regard to the efficiency of conversion of heat energy into electrical energy, also measured in kilowatt hours.The equivalence of this unit to energy in a gallon of gasoline is true if and only if the heat engine, generating equipment, and power delivery to the car battery are 100% efficient. Actual heat engines differ vastly from this assumption.
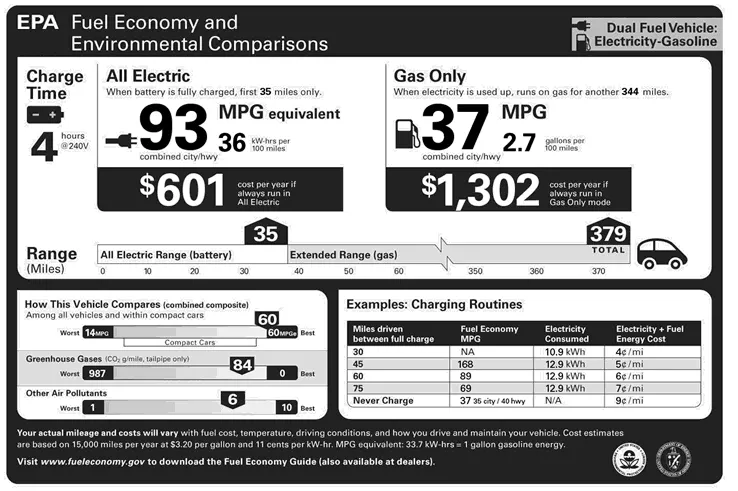
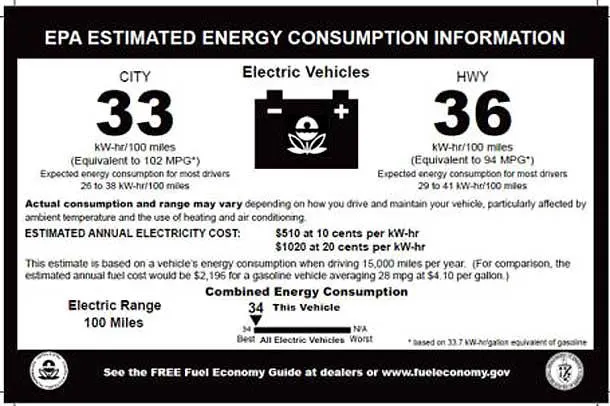
Pure electric mode vs only gas for Hybrid vehicle is shown above.With this extra range
can be obtained.
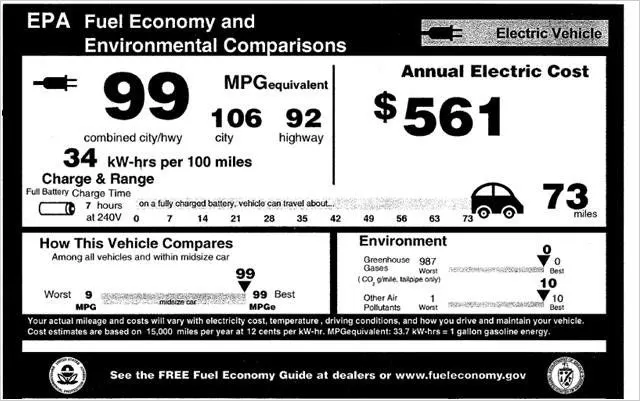
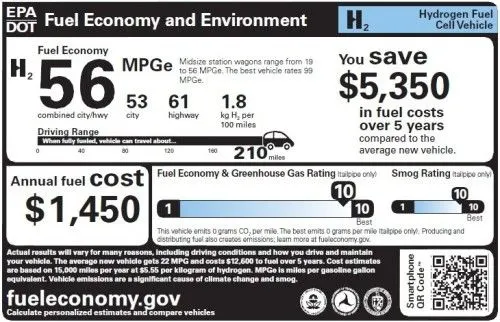
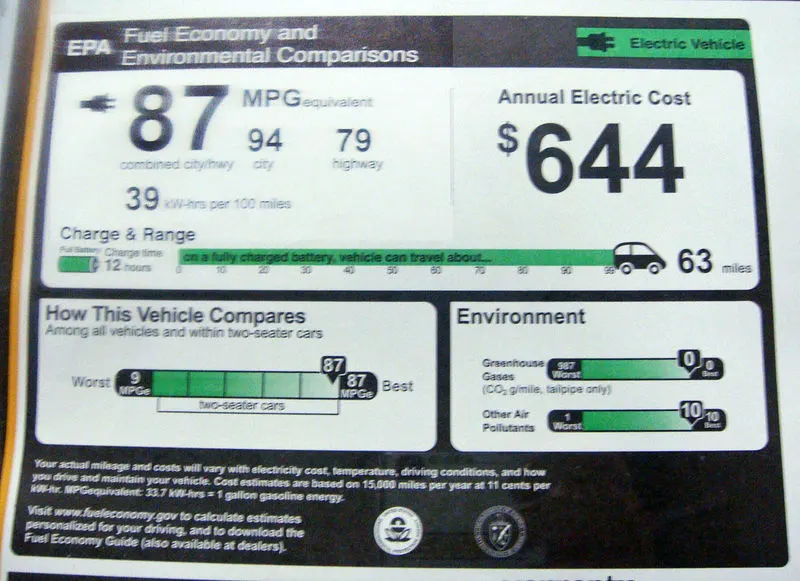
The above ratings are given by Environmental Protection Agency(EPA)
Consider a battery having 80kWh capacity.If using 1kWh of the battery runs the vehicle for 3 miles then
Miles Per gallon gasoline equivalent,MPGe = 3miles/kWh * 33.7kWh/gallon
= 101.1kWh
In this model MPGe is calculated using a block named 'Performance calculations ' made using stateflow.
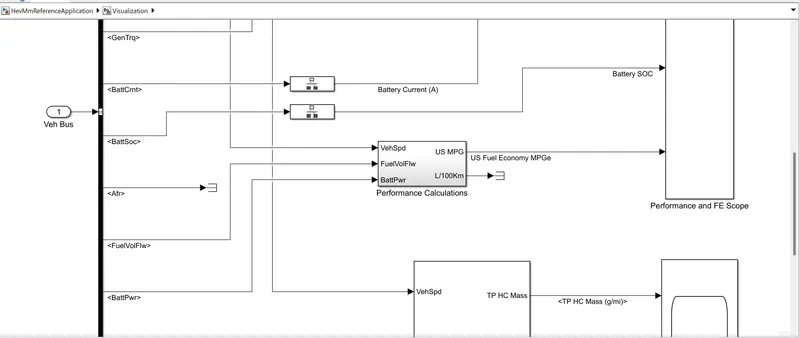
Performance calculations block:
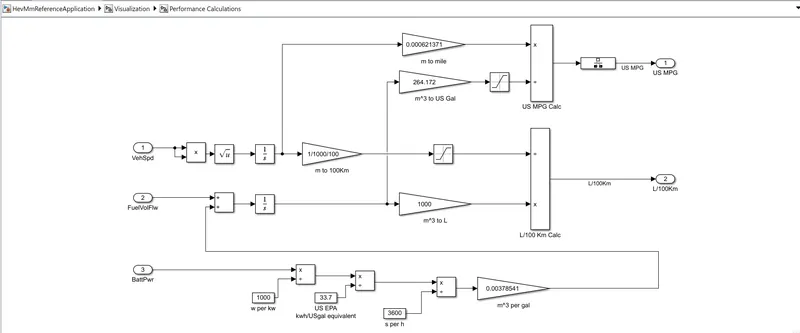
The inputs given to this block are vehicle speed,Battery power and Fuel volume flow
Outputs are MPGe and L/100Km(litre per 100km)
In this model the Energy inputs are from two sources: Electricity and Fuel
The vehicle speed is converted into distance by using integrator and the distance in metres is converted into miles
The battery power in watts is converted to kW and it is divided by 33.7 then the result is divided with 3600 and this 0.00378m^3/gallon is added with fuel volume flow.
Thus vehicle efficiency in MPGe is calculated.
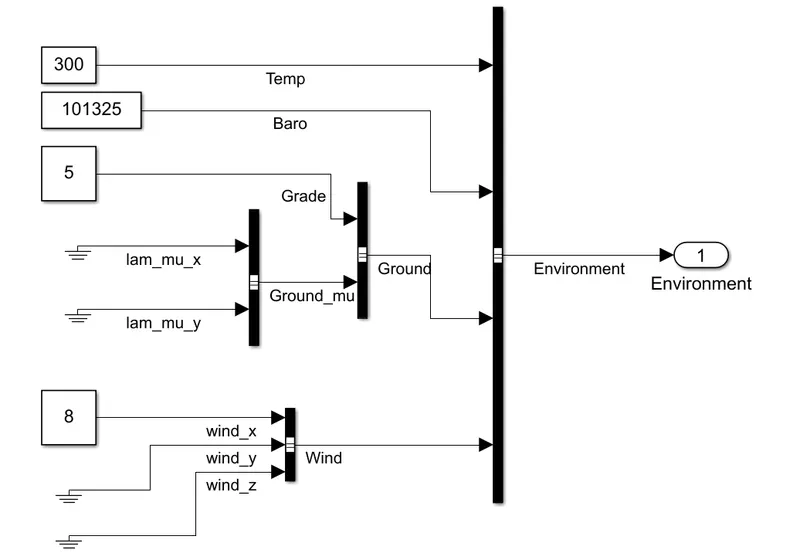
3.Run the HEV Reference Application with WOT drive cycle. Change the grade and wind velocity in the environment block.Comment on the results.
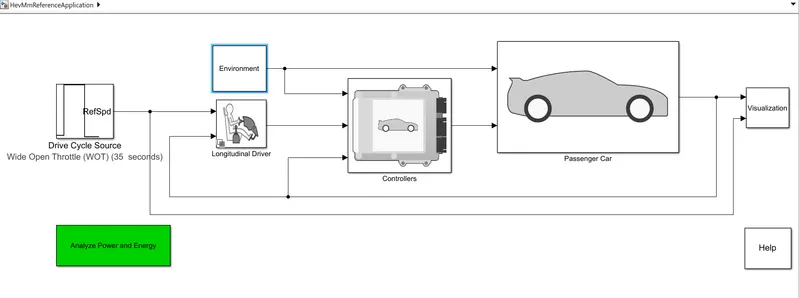
Hev Multimode Reference application with Wide Open Throttle (WOT) drive cycle:
To open this model we need Powertrain Blockset product in matlab.Search in help as 'Hev Multimode Reference application ' or simply type in command window 'autoblkHevStart'
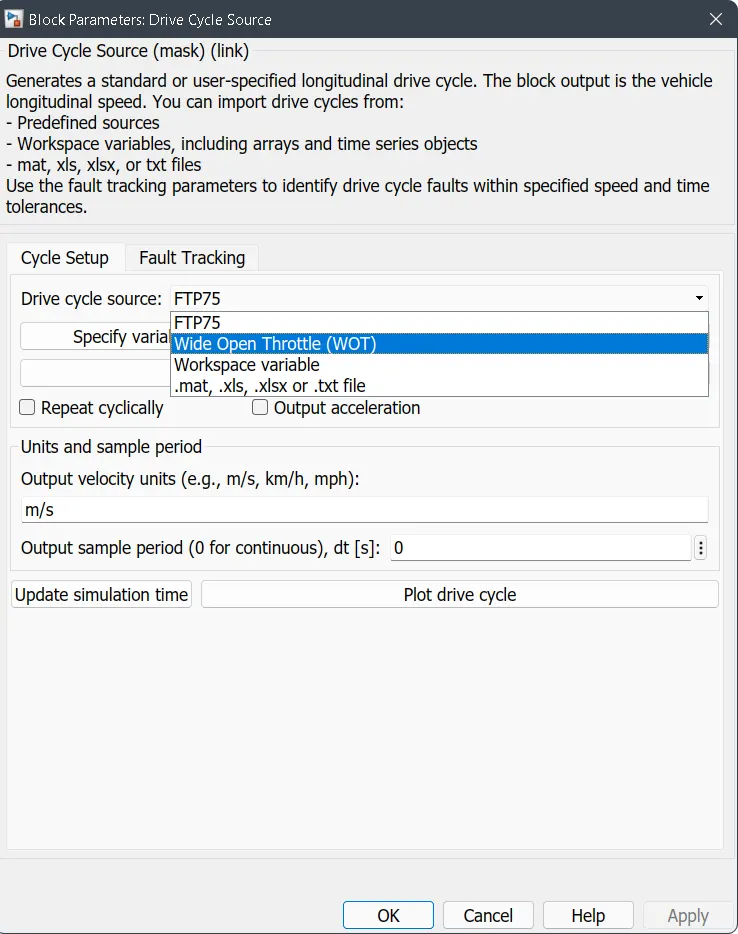
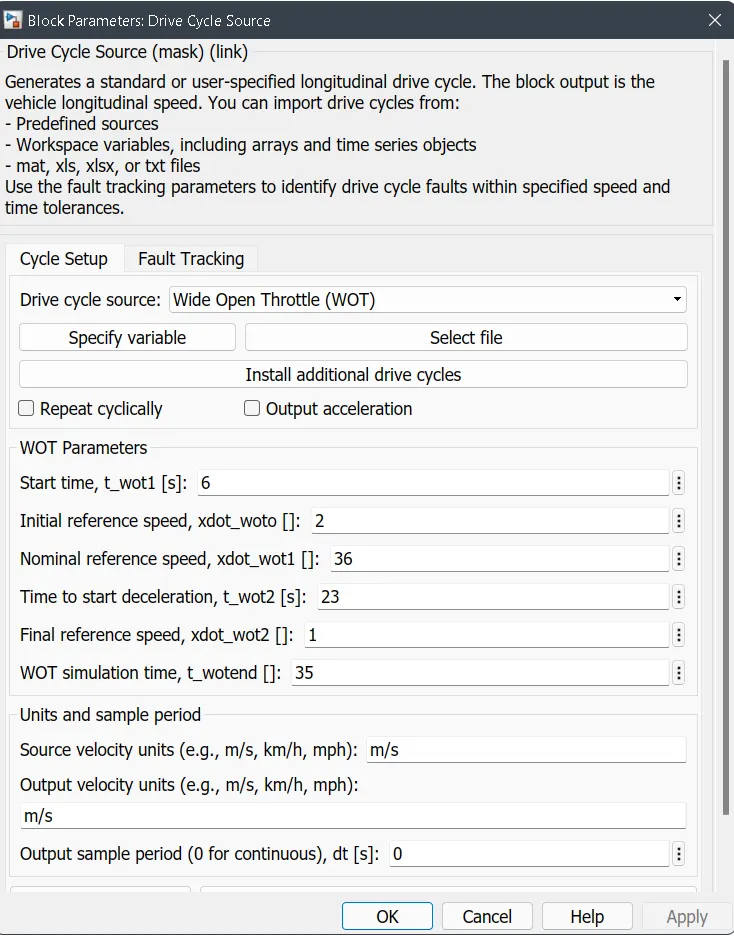
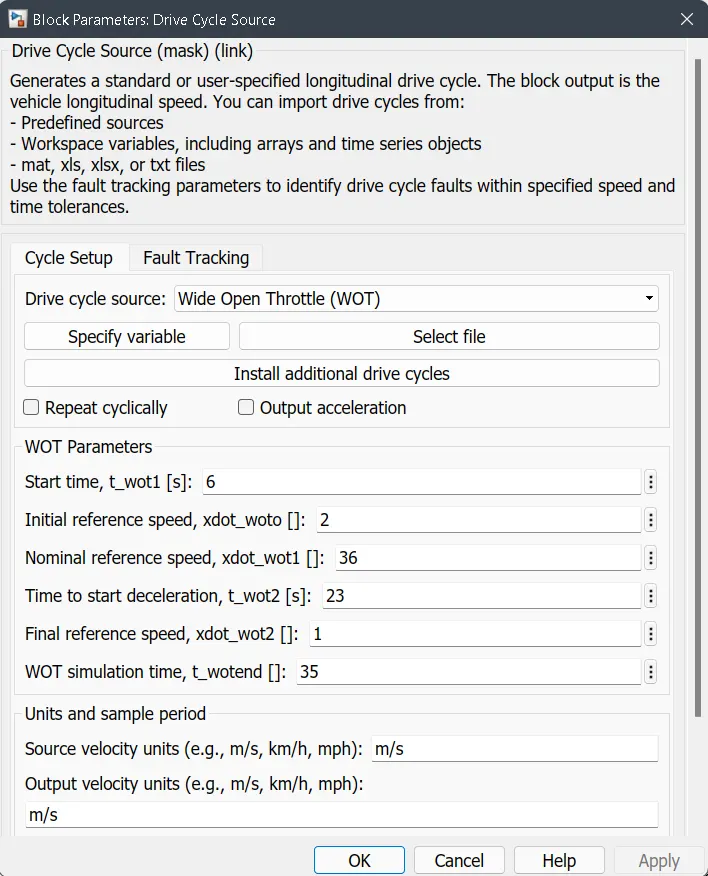
Then change the Drive Cycle Source settings
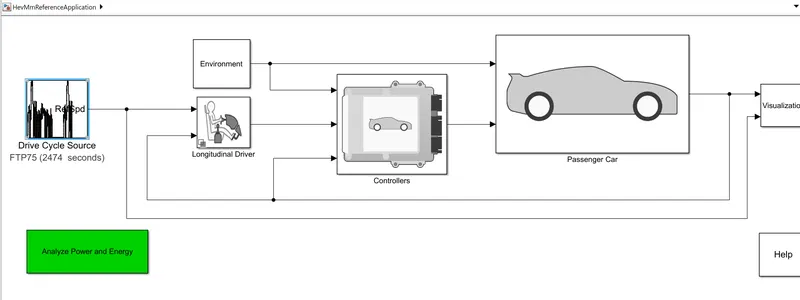
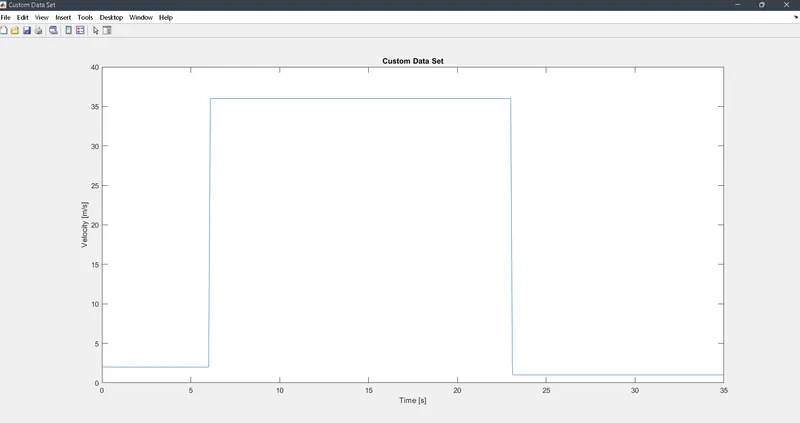
Change the drive cycle source to WOT change the WOT parameters also.
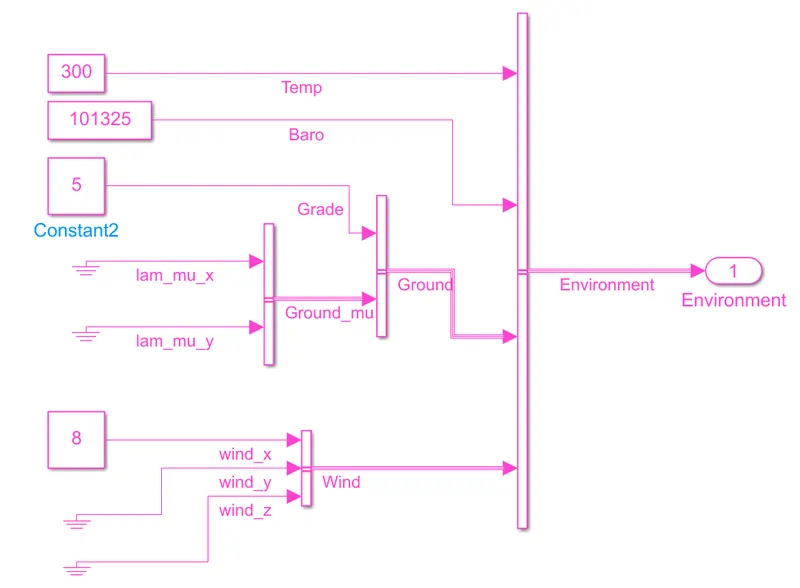
Change the Wind velocity and grade from Environment block:
The final model:
The WOT drive cycle plot:
Output obtained from Performance and FE scope:
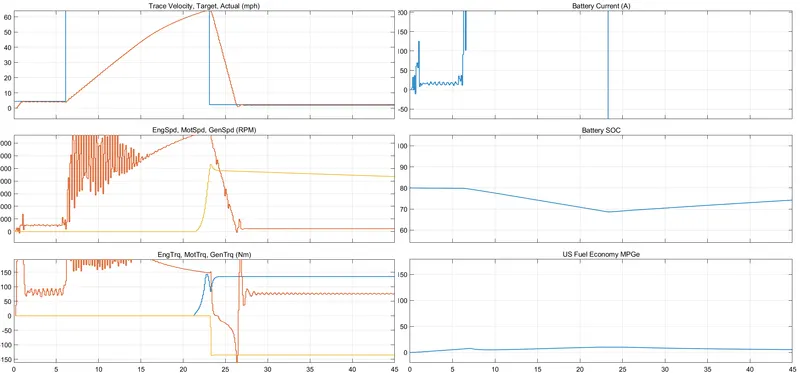
The graphs shown are:
Trace velocity,Target,Actual graph : blue line shows the desired curve and orange line is the actual path.
Engine speed,Motor speed,Generator speed:
Engine Torque,Motor torque,Generator torque:
Battery current: we can see as the speed increases current drawn also increases.When decelarating regenerative braking happens.
Battery SOC(State of Charge): state of charge also decreases when the speed increases
US fuel economy MPGe:
TP emissions plot:
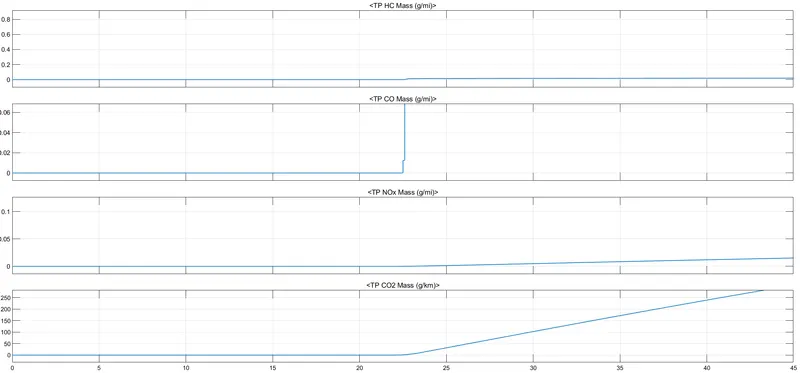
4.Keeping all other parameters same, compare the simulated results of hybrid and pure electric powertrains.
Goto help and search ev reference application and do same changes we have done in above hev application.Enter the same parameters and run.
Comparing Hev powertrain with Ev powertrain:
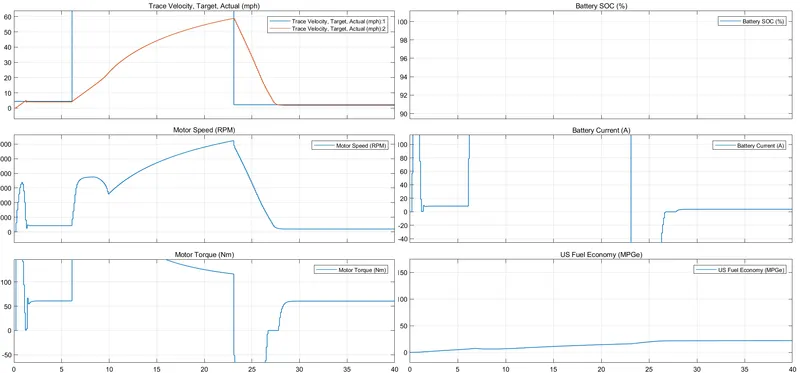
The graphs shown are:
Trace velocity,Target,Actual graph :
It is almost same as the Hev's plot. Blue line shows the desired curve and orange line is the actual path.
Engine speed,Motor speed,Generator speed:
There are much less oscillations and fluctuations in Ev graph compared to Hevs
Engine Torque,Motor torque,Generator torque:
There are much less oscillations and fluctuations at the starting time in Ev graph compared to Hevs.
Battery current: we can see as the speed increases battery current increases.
Battery SOC(State of Charge):
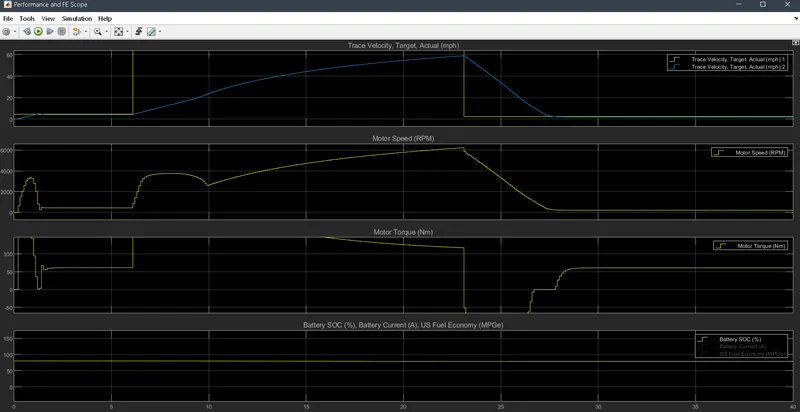
We can see that the Battery SOC is nearly 80% and it is steady throughout the run.It is better than the Hev's SOC.
US fuel economy MPGe:
We can see that the fuel economy is much better in EV than in HEV.