Week-4 Challenge WOT Condition Part-2
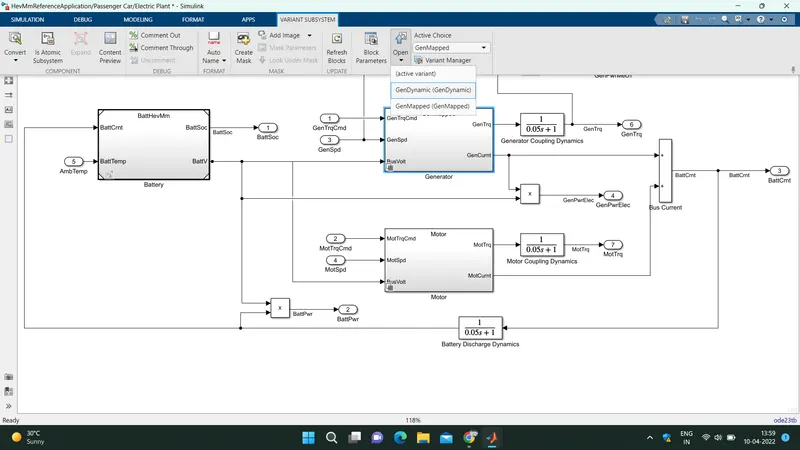
1.What is the difference between mapped and dynamic model of engine, motor and generator? How can you change model type?
ANSWER:
When you customize a SI or CI reference application, you can use either a dynamic or mapped engine model. The table provides considerations for using either implementation.
|
Type |
Implementation |
When to Use |
|
|---|---|---|---|
|
Mapped |
|
Model uses a set of steady-state lookup tables to characterize engine performance. The tables provide overall engine characteristics, including actual torque, fuel flow rate, BSFC, and engine-out exhaust emissions. |
|
|
Dynamic |
|
Model decomposes the engine behavior into engine characteristics that are separated into lower-level components. By combining components in this way, the models capture the dynamic effects. |
|
How can you change model type? :
THE CHANGING MODEL TYPE IS FIRST YOU NEED TO GO POWER BLOCK SET
THEN OPEN THE HEV MULTIMODE APPLICATION MODEL
THEN OPEN THE PASSENGER BLOCK HEN YOU WILL FIND THE ELECTRIC PLANT
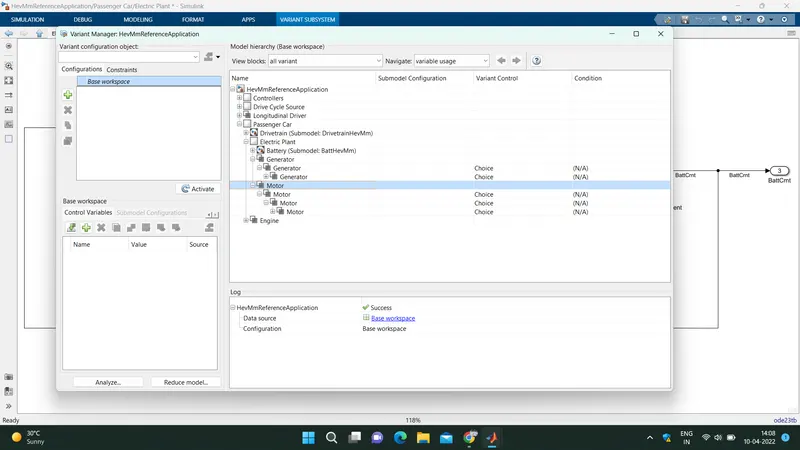
AND FOLLOW BELOW SCREEN SHOTS:
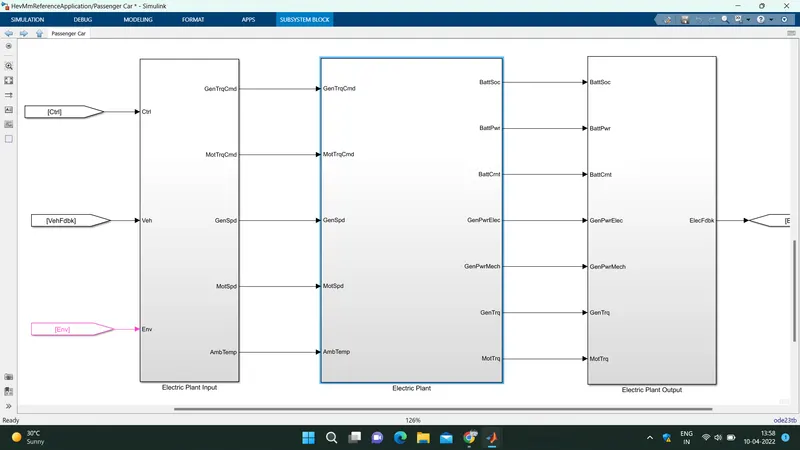
HERE YOU CAN CHANGE THE DYNAMIC MODEL BY CLICKING AT VARIENT
AND YOU CAN SEE THE PATH
2.How does the model calculate miles per gallon? Which factors are considered to model fuel flow?
ANSWER:
CONVERSION TO CUBIC MILE TO GALLON and fuel flow steps mentioned below
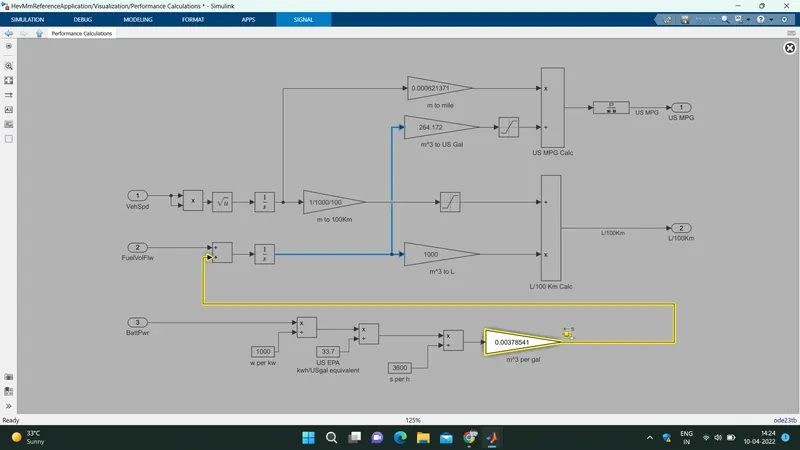
as we know that 264.172 US gallion is 1000L
the reference model taken as consideration is HEV as it operates as both the battery and fuel injection engine
the final output can be calculated by keeping consideration of battery output and fuel output and vehicle speed and therefore and fuel efficiency is calculate
3.Run the HEV ReferenceApplication with WOT drive cycle. Change the grade and wind velocity in the environment block. Comment on the results.
answer:
THE PERFORMANCE SCOPE RESULTS OF VARIOUS PARAMETERS WITH DEFAULT VALUES AND RUN TIME KEPT FOR 60SECONDS AND OBSERVED IN OBTAINED RESULTS :
DRIVING CYCLE:
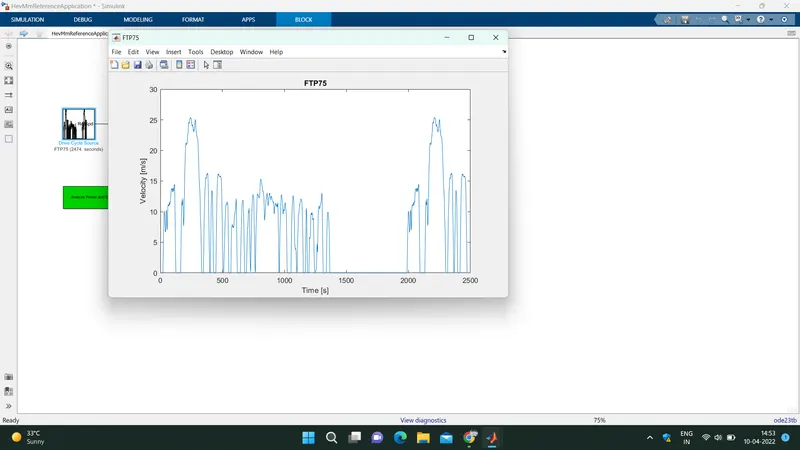
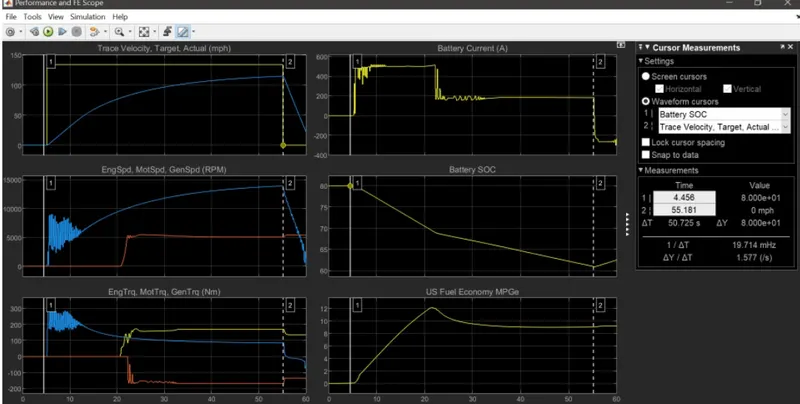
- HERE GRAPH1 YOU CAN SEE DESIRED VELOCITY NOT MATCHED WITH ACTUAL VELOCITY
- AT GRAPH2 YOU CAN OBSERVED ENINE SPEED AND MOTOR SPEED ACHIEVED
- AT PLOT3 MOTOR TORQUE AND ENGINE TORQUE YOU CAN OBSERVED
- AT PLOT 4 POWER PRODUCED BY BATTERY.
- AT PLOT 5 AND 6 ALSO YOU CAN OBSERVE BATTERY SOC AND US FUEL ECONOMY
- NOW CHANGING THE WOT CYCLE WIND VELOCITY AND GRADE:
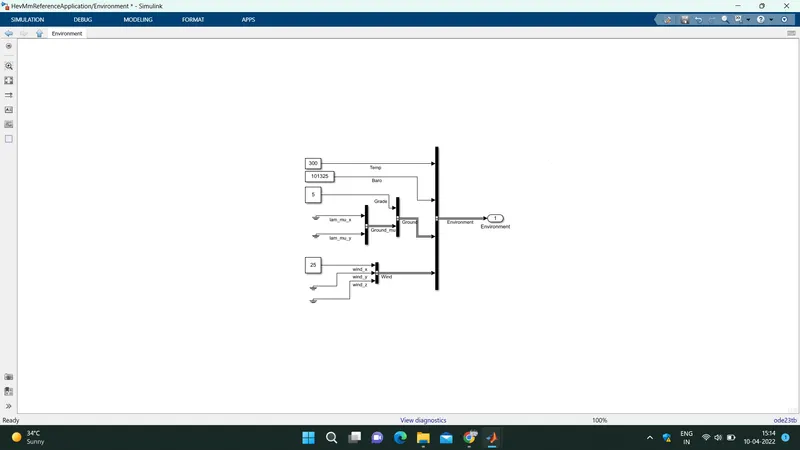
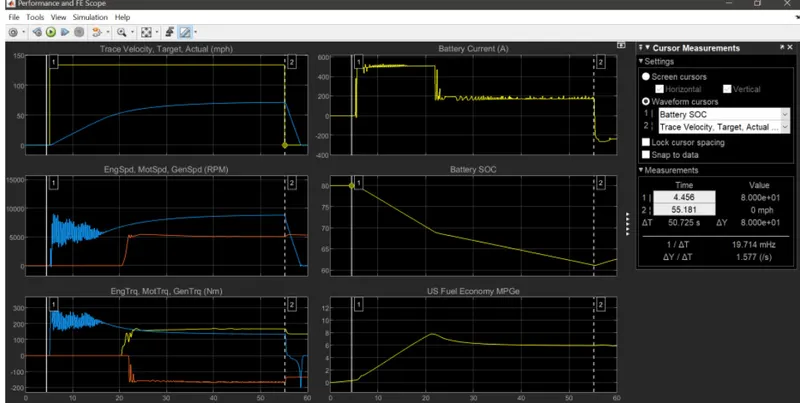
THE ABOVE PLOTS OBSERVED AS JUST CHANGE IN PATTERNS AS FOR GIVEN DATA WITH REFERNCE VALUES
4.Keeping all other parameters same, compare the simulated results of hybrid and pure electric powertrains.
ANSWER:
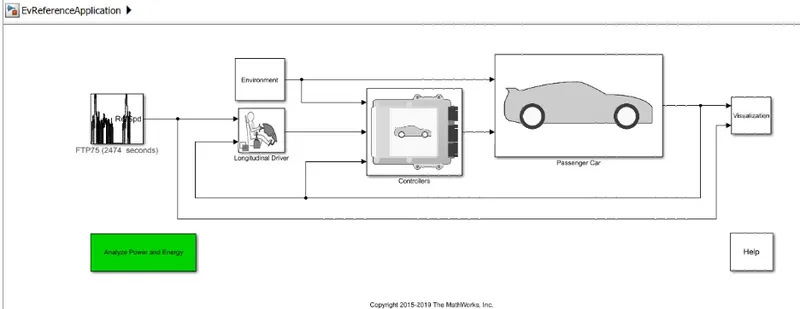
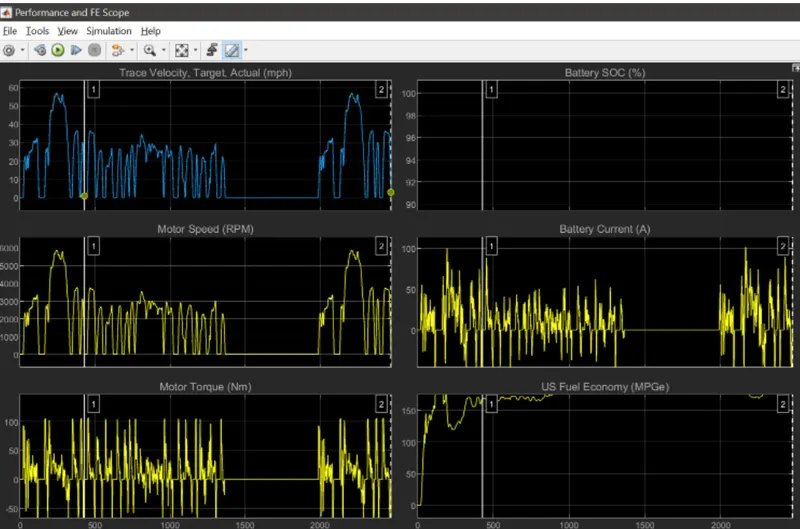
pure electric powertrains AND its performance plots
hybrid electric powertrains:
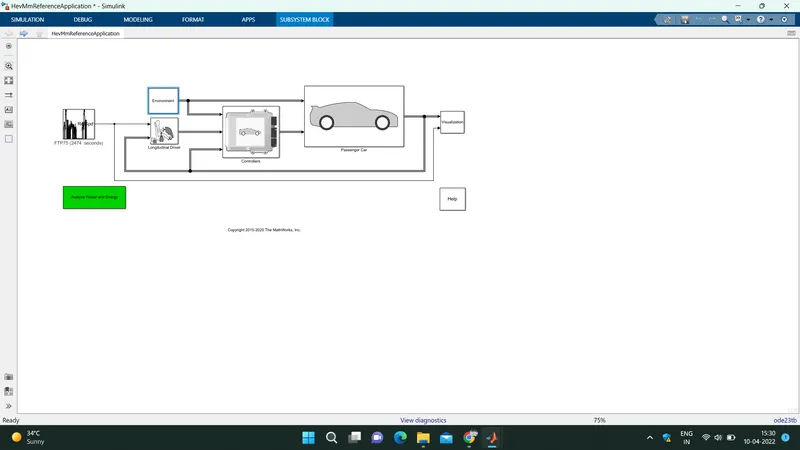
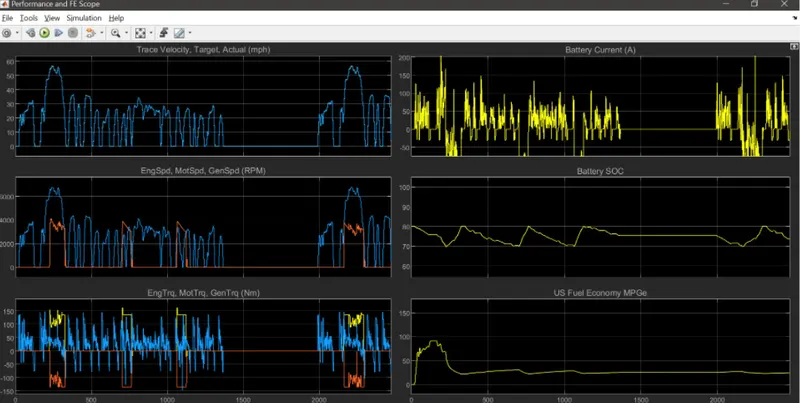
the above two models differnce is ev model only works on battery and hybrid ev are works on both the battery and engine so the parameters are veried and differented accordingly.
all the questions were answered .