Week-4 Challenge WOT Condition Part-2
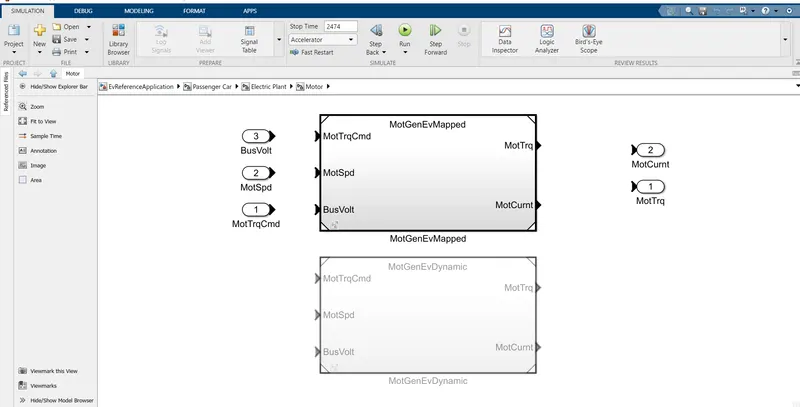
- What is the difference between mapped and dynamic model of engine, motor and generator? How can you change model type?
Difference between mapped and dynamic model of engine
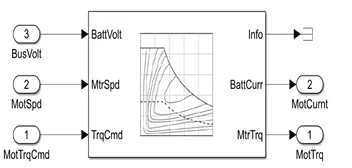
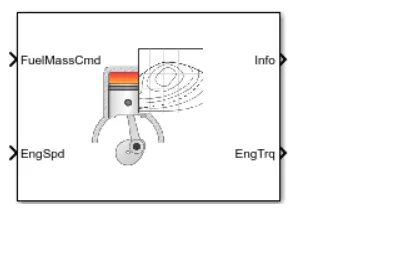
- Mapped model:
- In this model the data regarding the components are preloaded in lookup tables.
- Mapped model represent marco behavior as set of lookup tables.
- Mapped model is easy to construct.
- Gathering information to load in look up table is difficult.
Advantages:
- If the data of the components are avilable with us periorly its easy to simulate models.
- The mapped model is also known as gobal based model
Disdvantages:
- Gathering information about each and every parameter of the model is difficult
Motor:
Data like torque power, torque range, speed data has to be provided to do simulation.
Engine:
The data like rpm,power,etc.should be entered into the lookup table to get simulation
Generator:
Specification for the battery current,rotor torque,etc.data should be given to get simulated
- Dynamic model:
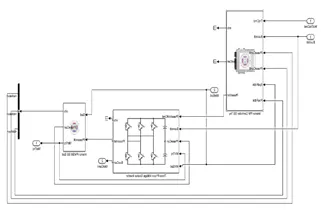
- Dynamicc model deccomposes behavior in to several individual components that results in analyzing and designing of the component.
- In this Dynamic model we can find out the performance of each component.
- Gathering different physical model is difficult compared with mapped or simple dynamic models.
Advantages:
- The detail analysis of the component is done accordingly.
- Performance of the component can be developed and it can be improved further.
- The dynamic model is also known as real time based model.
Disadvantages:
- Difficult to construct the mathematical model.
Motor:
- The simulation for the component done as per the real world component
- The inputs for the permenant magnet synchronus machine(PMSM)controller,three phase invertor and PMSM are has to give to simulate the component.
Engine:
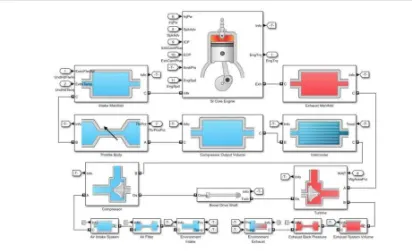
Physical model of the component get installed with required input data provided
Generator:
- Inputs for the each component of Generator should mentiond.
- The components are physical simscape models.
- Not every data provided should be correct in this case,Some assumptons should be considered.
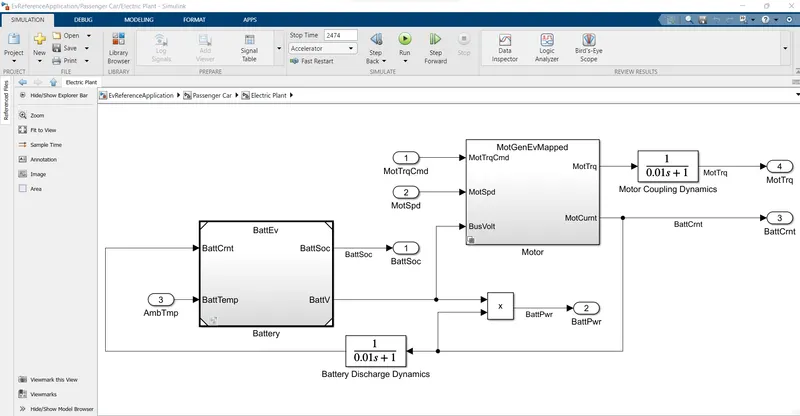
Switch between mapped and dynamic model
2.How does the model calculate miles per gallon? Which factors are considered to model fuel flow?
How does the model calculate miles per gallon?
Miles per Gallon: miles per gallon (MPG)is a fuel economy rating determined by how far a car can travel using one gallon of gasoline or disel for a conventinal IC Engine vehicle. in the case of an eletric vehicle , this is a measure of how much electrical energy is consumed by the battery pack to travel a fixed distance.
Per gallon of gasoline-equivalent for electric cars: Burning one gallonn of gas produces 121.3MJ. To generate the sme amount of heat by way of electricity,it takes 33.7 kilowatt-hours(kwh). So if an eletric vehicle can travel 100 miles on 33.7kwh of electricity, then we can rate it at as 100 MPGe.
The power train set has a model that calculates the miles per gallon for all kinds of vehicles.
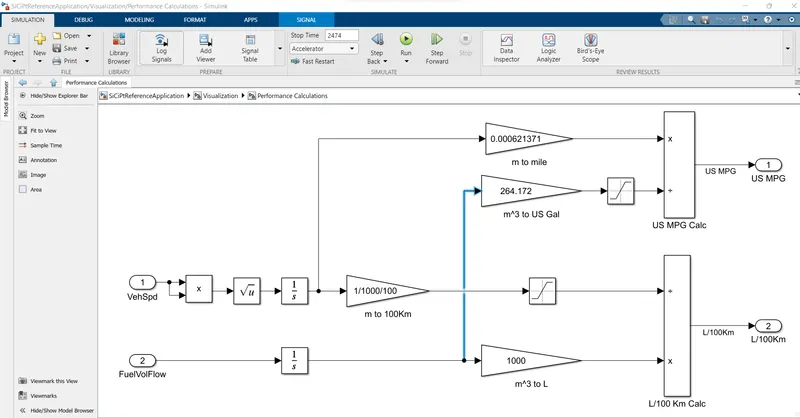
1.For Conventional Vehicle
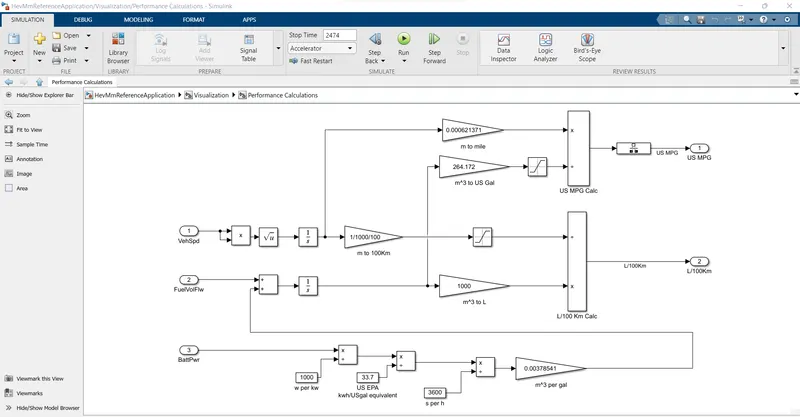
2. For hybrid electric vehicles
3.For electric vehicle
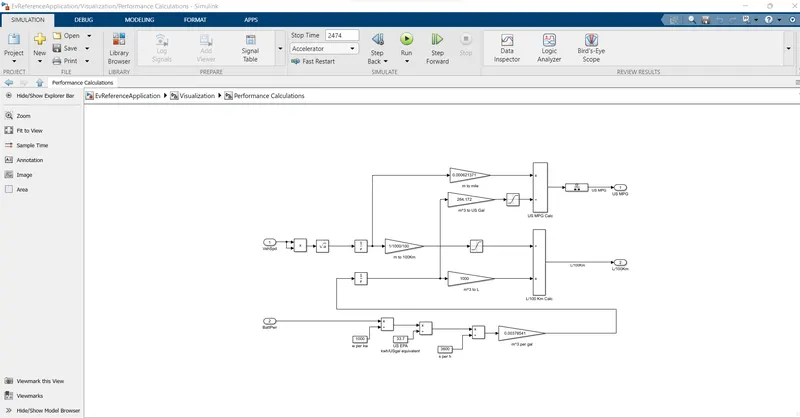
The model takes an input of vehicle speed.fuel flow and battery power to calculate fuel consumption and the equivalent battery consumption to calculate the miles per gallon.
Vehicle speed & fuel flow:
- Vehicle speed is an important factor while considering the fuel consumption at that particular time, to determine fuel consumption throughout the drive cycle.
- Then the floe is expressed as the mass flow rate(i.e) the amount of fel at each moment is kg/sec. now integrating this will result in the mass of the fuel and by using this 1/(1000*0.739) we convert it to the volume and multiplay by 1000 to get it in litres.
- by comparing the two results we can get the amount of litre consumed to run for 100km .
Battery Power:
- The amount of energy from battery power required to propel the vehicle Equivalent to that of the Engine is calculated here.
- The battery power is given in watt and it is converted to kW by dividing with 1000.
- Then converting the Energy from kWh to equivalent energy in US gallon of automotive gasoline by dividing with 33.7. Since we get the energy in US gallon equal in kWh, to get the energy of equivalent US Gallons per seconds dividing with 3600 and we convert the hour to seconds.
- Then multiplying with 0.00378541 converting the US Gallons per sec to the volume of the fuel flow in (m^3/s) and then we multiply with 739 which gives the result as mass flow rate kg/s.
- Then finally the battery en energy equivalent in kg/s is given as an input for the fuel flow parameter to find the equivalent US Gallons energy and estimate the miles per Gallons.
Calculating miles per Gallon:
- The input from the vehicle speed (i.e) the Distance we found (in meters) are taken into the calculation and it is converted to the miles by multiplying with 0.000621371.
- Then the inputs from fuel flow (Battery ewnergy + Fuel energy) taken in m^3 and are converted into equivalent US Gallons by multiplying with 264.172.
- Then the two inputs Miles covered and equivalent US Gallon are further divided and the result is got in miles/Gallon.
factors are considered to model fuel flow?
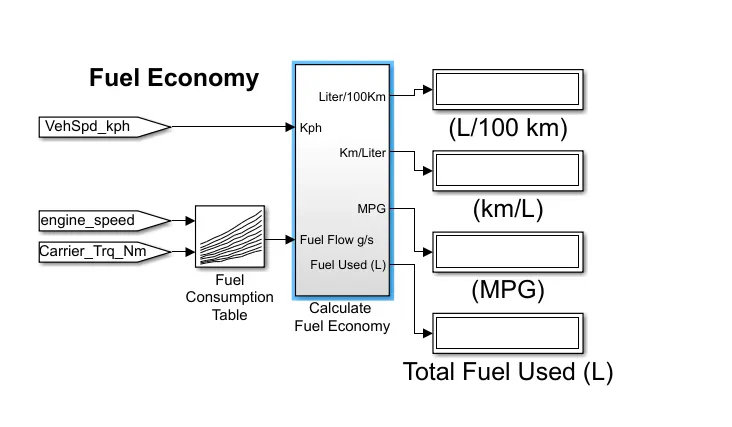
Factor considered in the model fuel flow are fuel Economy and fuel consumption:
1.Fuel Economy:
The fueln economy of an automobile relates distance travelled by a vehicle and the amount of fuel consumed. consumption can be expressed in terms of volume of fuel to travel a distance,or the distance travelled per unit volumeof fuel consumed . Sine fuel consumption of vehicles is a significant factor in air pollution, and since the importation of motor fuel can be3 a large part of a nation's foreign trade, many countries imose requirements for fuel economy. Different methods are used to approximate the actual performance of the vehicle, and in providing power to overcome various losses encountered while propelling the vehicle,and in providing power to vehicle systems such as ignition or air conditing.Various strategies can be employed to reduce losses at each of the conversions between the chemical in the fuel and kinetic energy of the vehicle.Driver behaviour can fuel and so do not have fuel economy per sec,but equivalence measures.
Major Factors Considered in the Fuel Economy:
Vehicle speed
Engine Speed
motor torque
2.Fuel Consumption:
Fuel consumption is ther inverse of fuel economy. It is the amount of fuel consumed in driving a given distance.
3.Run the HEV ReferenceApplication with WOT drive cycle. Change the grade and wind velocity in the environment block. Comment on the results.
Hybrid electric vehicle:
A hybrid electric vehicle (HEV) is a type of Hybrid vehicle that combines a conventional internal combution engine (ICE) system with an electric propulsion system (Hybrid vehicle drivetrain). The presence of the electric powertrain is intended to achieve either better fuel economy than a convectional vehicle or better performance. There is a variety of HEV types and the degree to which each function as an electric vehicle (EV) also varies. The most common form of HEV is the hybrid electric car, although hybrid electric trucks (pickups and tractors), buses, boats and aircraft also exist.
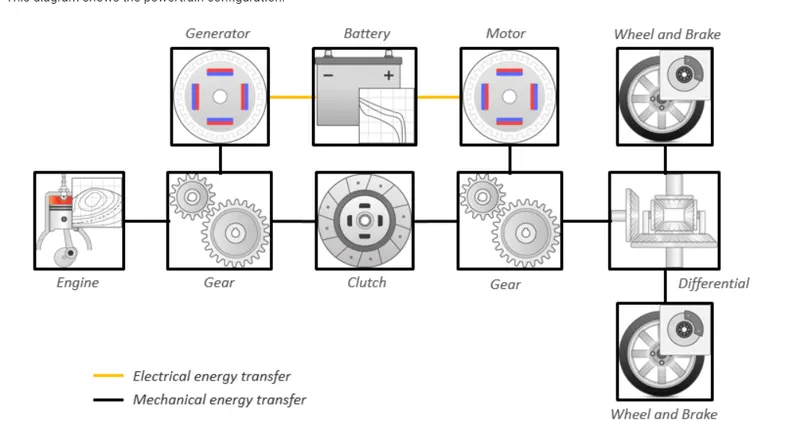
In MATLAB using powertrain blockset-Design tradeoff analysis and component sizing, ontrol parameter optimization,or hardware-in-the loop(HIL) testing for HEV-Input Power Split under that exploring Hybrid Electric Vehicle input power-split Reference application.
SIMULAtion model:
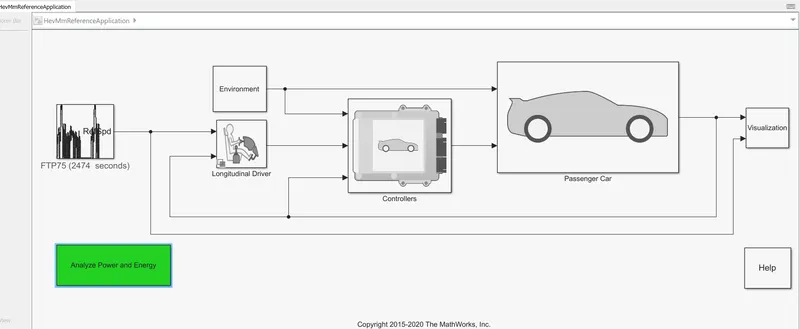
case1:
For the frist block selecting the input drive cycle i.e Wide open Throttle(WOT),keeping grade as 0a nd wind velocity as 0 and other parameters as default
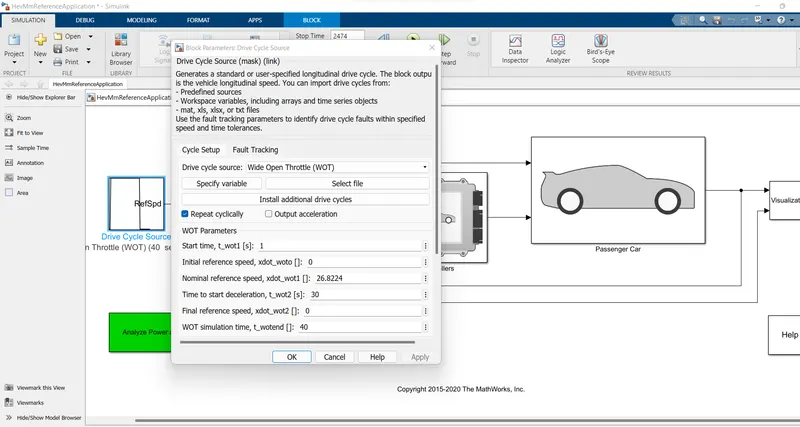
The simulation is done for Hybrid electri vehicle with wide open Throttle Drive Cycle.
The Total cycle time=60sec.
Time to start deceleration = 30 sec.
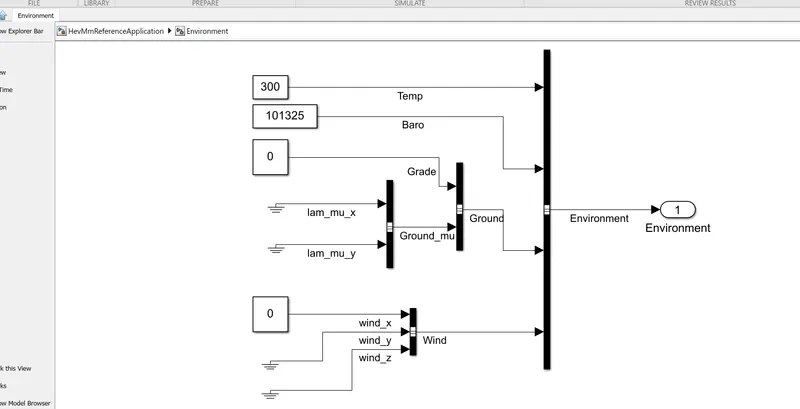 +
+
The Grade anglr = 0 degree
The wind velocity = 0m/s
Results:
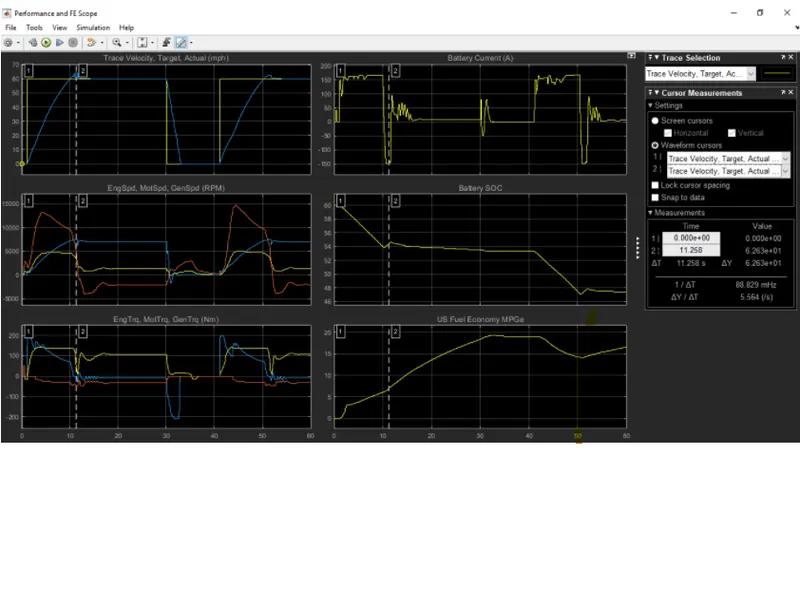
The above image shows the results for the simulation and it consists of six different plots.
cursor measurement helps in reading results in a better way. the cursor enables us to study the
behaviour of other result parameters corresponding to the acceleration of the vehicle.
Plot 1: Trace Velocity,Target,Actual(mph)
it shows the velocity of the vehicle for the drive cycle data with the time scale on the x-axise.
Traced velocity is given as input command & actual velocity is output. the actualgraph doesn't match with input traced velocity due to
limited instantaneous current /power avaialble.
The top speed achieved =63mph
The acceleration time to reach 63mph=11258 seconds
The acceleration time to reach 60to minimum=3.164 seconds
From the plot, it can be stated that the top vehicle speed achieved very fast i.e within 11 seconds the same speed remains upto 30 seconds.
top speed reach ti minimum speed in just 3.16 seconds. similarly, the cycle continuoues the drive cycle is of 40 seconds and simulation is ran
for 60 seconds for a proper conclusion.
Plot 2: Engine speed ,motor speed, generator speed (RPM)
it show the changes in the speed of the engine ,motor and generator in rpm throughtout the drive cycle
peak engine speed =4787 Rpm
peak motor speed =7437 Rpm
peak generator speed =14610 Rpm
The engine, motor, generator speed in increasing when the vehicle speed is increasing it can be seen that generators & engine speed have
reached the peak values when battery SOC ststted talling after 40 seconds.
the motor initiates the initial acceleration and is capable to produce enough propulation power to reachthe specified maximum velocity.
However, the motor is activated as soonas the maximum velocity is achieved indicating the a conbined effort is required to maintain the velocity.
the engine continues to operate which in turn is the input for the generator for producing electricity to reach the default SOC as specified in the control strategy.
Plot 3: Engine Torque, motor Torque, Generator Torque (Nm)
It shows the torque characteristics and its changes of engine, motor and generator in (Nm)throughout the drive cycle.
peak Engine torque = 143 Nm
peak Motor touque = 200 Nm
peak Generator torque =51 Nm
with wide-open throttle specification , the motor runs at maximum torqur , however, the power distribution stabilizes between the motor
and the engine as the vehicle reaches the desired velocity. A negative value for the generator indicates the engine torque is used to change
the battery as well during the propulsion time.
Plot 4: Battery Current (A)
It shows the battery current value (A) and its changes for various acceleration inputs as per the drive cycle.
The peak current discharge from the battery =164.63A
The peak current charging to the battery =-147.68 A
with wide-open throttle specification, the powertain draws maximum currnts from the battery and stabilizer as the conditions are met
and the engine is activated . A negative battery current value indicates regenerative braking and charging by the engine.
Plot 5 : Battery SOC
It show the battery state of charge SOC(%) and its changes corresponding to the driving inputs
The state of charge decreased from 60 % to 47.4 % of charge in 60 seconds for the specified driving conditions.
Plot 6: US Fuel enconomy MPGe
show the fuel economy as mile per gallons for the corresponding input driving conditions.
According to the drive cycle the vehicleachieved its maximum speed at 11th sceond and the speed is constant upto 30th second of drive
cycle ( from the plot ) that fule requirements also increasing with the increase in speed till the speed is constant.
after this constant speed vehicle speed is decreasing and the vehicle is at lowest speed for next 10-12 seconds and during this the fuel
requirement is also decreasing and the same drive cycle and fuel requirement is repeated.
Change the grade and wind velocity in the environment block. Comment on the results.
simulink model:
case2:
For the frist block selecting the input drive cycle i.e Wide open Throttle(WOT),changing the grade and wind velocity, keeping all other parameter as default.
The simulation is done for Hybrid electri vehicle with wide open Throttle Drive Cycle.
The Total cycle time=60sec.
Time to start deceleration = 30 sec.
The grade Angle = 8 degree
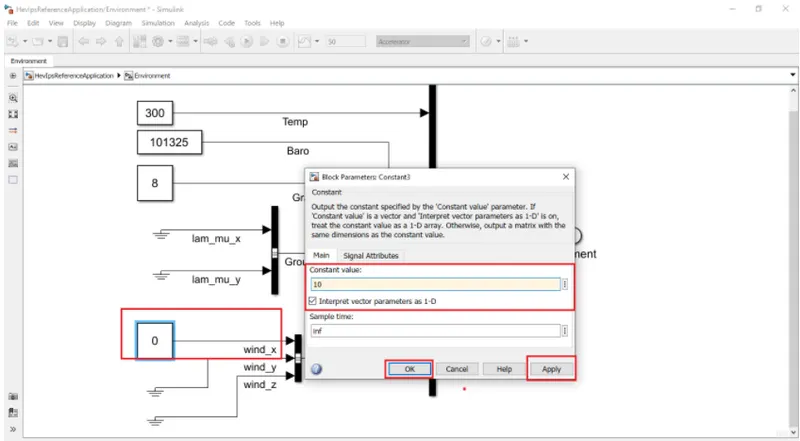
The wind velocity= 10m/s.
Reasult:
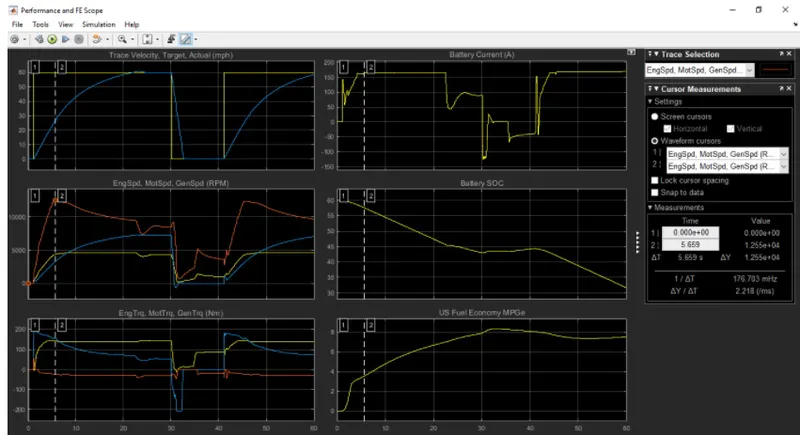
In all results some changes can be observed as that of previous results. Though the drive cycle parameters are the same , some changes in the environment block such as grade angle and wind velocity lead to changesb in final results.
Plot 1: Trace Velocity,Target,Actual(mph)
it shows the velocity of the vehicle for the drive cycle data with the time scale on the x-axise.
Traced velocity is given as input command & actual velocity is output. the actualgraph doesn't match with input traced velocity due to
limited instantaneous current /power avaialble.
The top speed achieved =60mph
The acceleration time to reach 60mph= 22.21 seconds
The acceleration time to reach 60to minimum=2.97 seconds
It can be observed that the top speed achieved with these conditions is less than the earlier case and time reuired to reach the top speed is also higher The vehicle does not reach the desired veloccity which can be attributed to the steep gradeability and high resistance force by the wind.
Plot 2: Engine speed ,motor speed, generator speed (RPM)
it show the changes in the speed of the engine ,motor and generator in rpm throughtout the drive cycle
peak engine speed =4651 Rpm
peak motor speed = 7295 Rpm
peak generator speed =12550 Rpm
The motor initiates the initial acceleration to produe propulsion power to reach the specified maximum velocity , but it can be observed that the motor is unable to produce enough propulsion power to reach the desired velocity ,thus the engine contributes to the propulsion effort However, the combined effort is not sufficient to reach the desired velocity due to resistancce offered by wind velocity and grade angle.
Plot 3: Engine Torque, motor Torque, Generator Torque (Nm)
It shows the torque characteristics and its changes of engine, motor and generator in (Nm)throughout the drive cycle.
peak Engine torque = 143 Nm
peak Motor touque = 202 Nm
peak Generator torque =52.67 Nm
with wide-open throttle specification , the motor runs at maximum torqur , however, the power distribution stabilizes between the motor
and the engine as the vehicle reaches the desired velocity. A negative value for the generator indicates the engine torque is used to change
the battery as well during the propulsion time.
Plot 4: Battery Current (A)
It shows the battery current value (A) and its changes for various acceleration inputs as per the drive cycle.
The peak current discharge from the battery =166A
The peak current charging to the battery =-125.37 A
with wide-open throttle specification, the powertain draws maximum currnts from the battery and stabilizer as the conditions are met
and the engine is activated . A negative battery current value indicates regenerative braking and charging by the engine.
Plot 5 : Battery SOC
It show the battery state of charge SOC(%) and its changes corresponding to the driving inputs
The state of charge decreased from 60 % to 28% % of charge in 60 seconds for the specified driving conditions.
Plot 6: US Fuel enconomy MPGe
show the fuel economy as mile per gallons for the corresponding input driving conditions.
According to the drive cycle the vehicleachieved its maximum speed at 22 sceond and the speed is constant upto 30th second of drive
cycle ( from the plot ) that fule requirements also increasing with the increase in speed till the speed is constant.
after this constant speed vehicle speed is decreasing and the vehicle is at lowest speed for next 10-12 seconds and during this the fuel
requirement is also decreasing and the same drive cycle and fuel requirement is repeated.
canclusion:
According to the simulation results for both teh cases i.e with and without grade angle & wind velocity , it an be said that vehicle in which grade angle and wind velocity is equal to zero is more efficient than the forner one.
- In case2, due to wind velocity and Gradeability, the vehicle is not able to math the trageted speed.
- In case2, maximum rpm achived by the motor is less because of resistance offered by grade angle & wind velocity, while an engine & generator is a bit less than the case1 but we can consider it as same due to negligible difference.
- In case2,the battery current is almost the same.As battery have the same max capacitty in both the cases.
- In case2 the state of charge also shows that the disharge is also high compared to the case1.
- MPGe achieved is less in case2 than the case1 in the same period it is because of the resistance offfered by grade angle & wind velocity.
- So overall we cam say that adding gradeability & wind resistance causes the vehicle to achieve less aceleration & top speed at same battery capacity 7 MPGe achieved is also less.
- It can be observed that the efficcieny of the no-load vehicle is high compared to the vehicle with additional loads acting on them.