Week-4 Challenge WOT Condition Part-2
1.)
i.) Differences between Mapped and Dynamic model of engine, motor and generator:-
---> The mapped and dynamic motor/engine essentially respresent the concepts of Static and Dynamic modelling of vehicles.These two categories of moelling is based on level of details of a vehicle model.
- Static Model: Static or steady state model is nothing but macro level , low detail kind of a model.
- Dynamic Model: Dynamic model on the othe hand is quite opposite to that of steady state modelling in the sense that it takes care of related terms and transients.
-->Comparitive differences between Static and dynamic models:-
Static models
- It constructs models that use microstatistics, which are cycle average efficies of components, without much details.
- Output is obtained instantaneously and it depends on the current input given to the model.
- Static models run faster and they run on the data given in the look up table.
- The relationship between input and output does not change i.e static in nature and can be represented by an algebraic equation.
Dynamic models
- Dynmaic model represents the actual compenents in a system.
- They perform detailed subsecond transient simulations.
- Output of the system takes time to react.
- The model relationship with input and output changes with time, depends on past inputs and initial conditions. It can be represented as differential equations.
Mapped Engine, Motor and Generator.
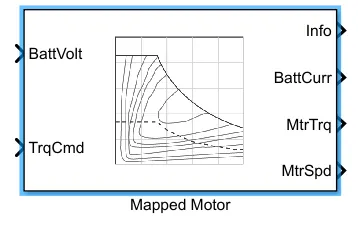
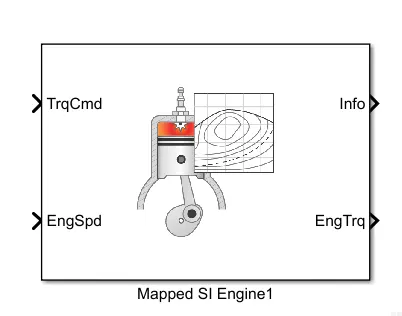
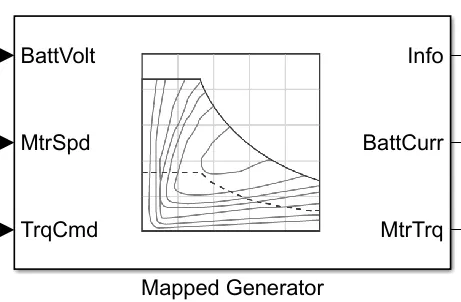
---> These mapped engine, mother and generator are essentially steady state or static models. One way to understand these static view point models is throught the torque-sped curves,which is essentially what these look up tables in these models are. In these curves for a given input voltage or load torque, through the graph a correspoding motor/engine speed is obtained as output.
---> If we change the load torque or input voltage, we obtain a corresponding different value of speed.this is the essence of static models where for a change in the input or model conditions the output changes instantaneously, it doesn't capture the dynamics and transients.
--->These models are applicable when we are trying to size the engine /motor,i.e where we need to know the maximum speed and torque values,where conditions don not change so quickly look table and torque speed curves are sufficient.
Dynamic Engine, Motor and Generator.
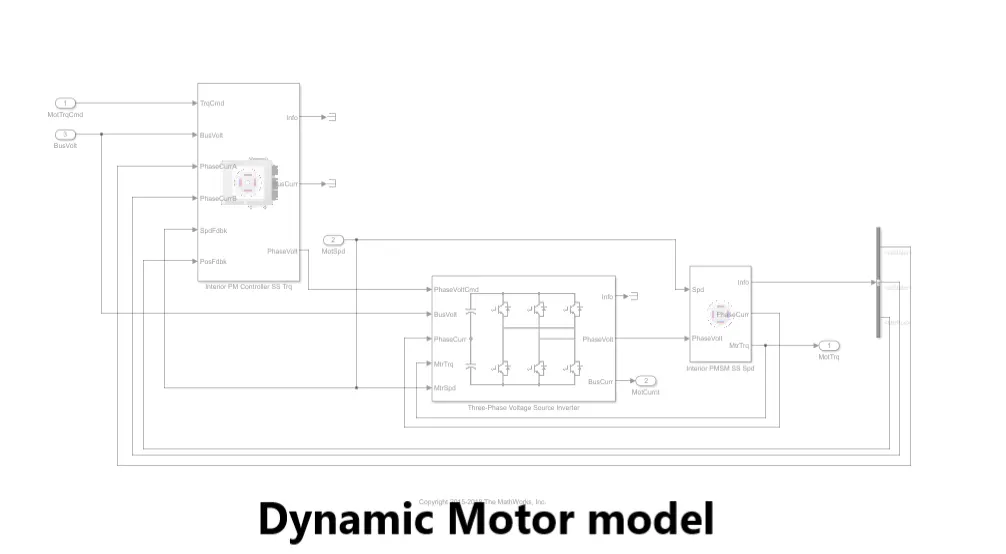
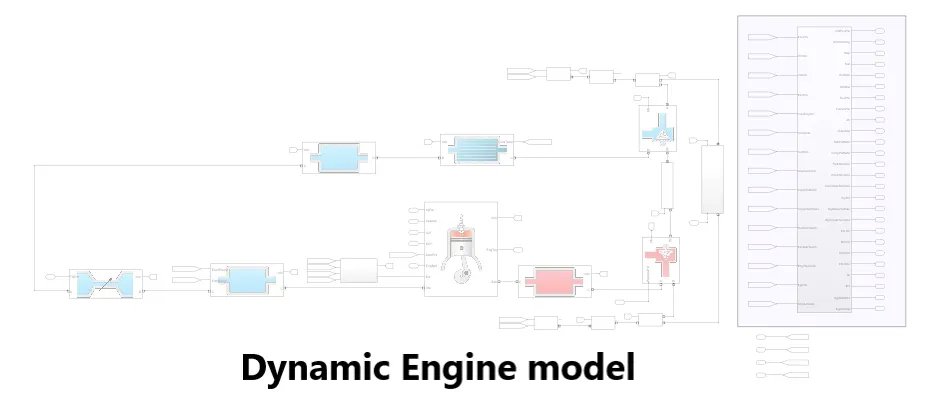
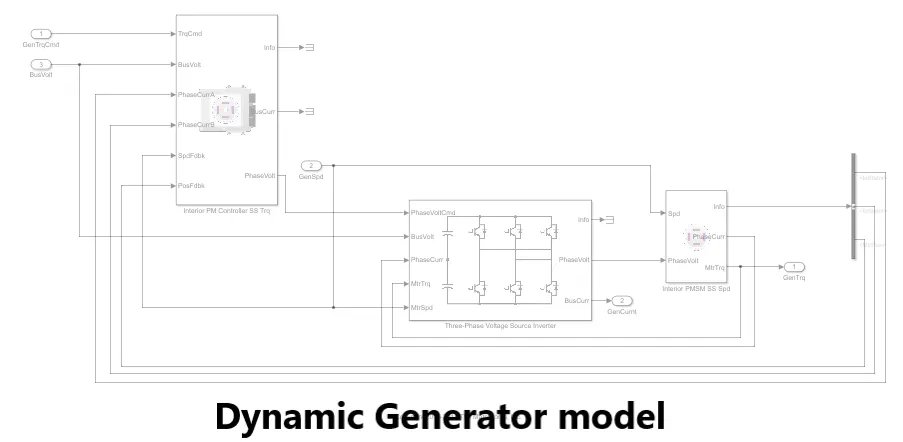
--> In reality in the case of a motor/engine , if we were to change the input voltage or load torque it will take sometime for the motor or engine to react.
-->Actually the dynamic motor/engine/ generator will have speed and torque plots with transient points.And so it takes time for the engine/motor's speed and torque to ramp up, they change with respect to time.
--> Here the relationship between input and output values changes with time, also depends on paast inputs and initial conditions i.e relation between input and output is dynamic.
--> Dynamic models are preferred where detail orient design is needed, where undertanding of the transient changes at the compenent level is required and where the rate of response of motor/engine is needed.
ii.)
--> In the EVrefrence model and the HEVrefrecne model, insie the passenger car model block the mapped and the dynamic moodels of motor, genrator and the engine are present.
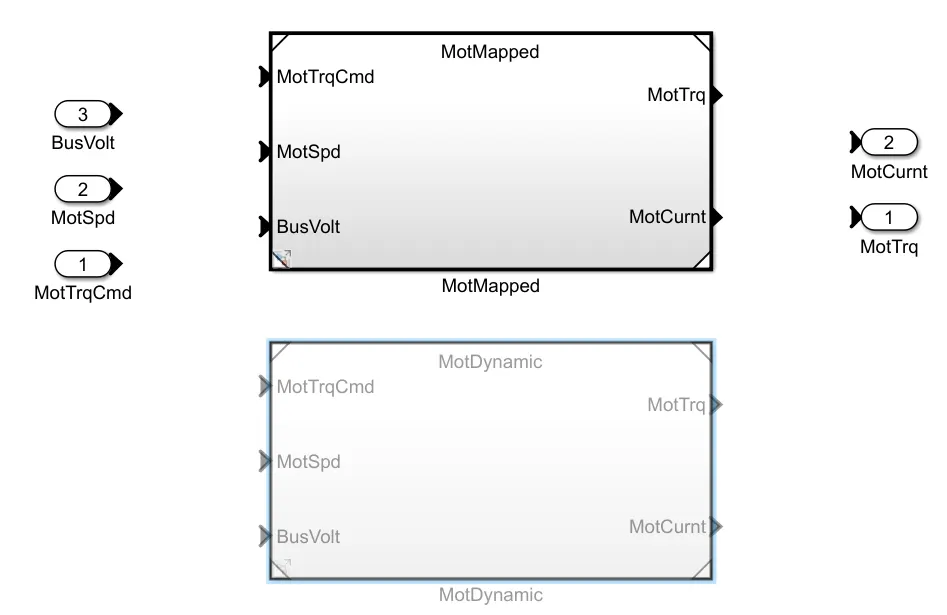
--> So, we have provision of choosing between the Mapped and dynamic model here.
--> Usually the mapped model is connected , whicle the dynamic model remains deactivated by default.
--> But, depending upon on the level of detail required by us, we can select and choose either of the two, for our simulation.
2.)
--> On running the simulation of either of the EVrefrenceapplication and HEVrefrenceapplication models, the results open in the scope wndow called "Performance FE scope", where FE stand for fuel economy.
for EVmodel:
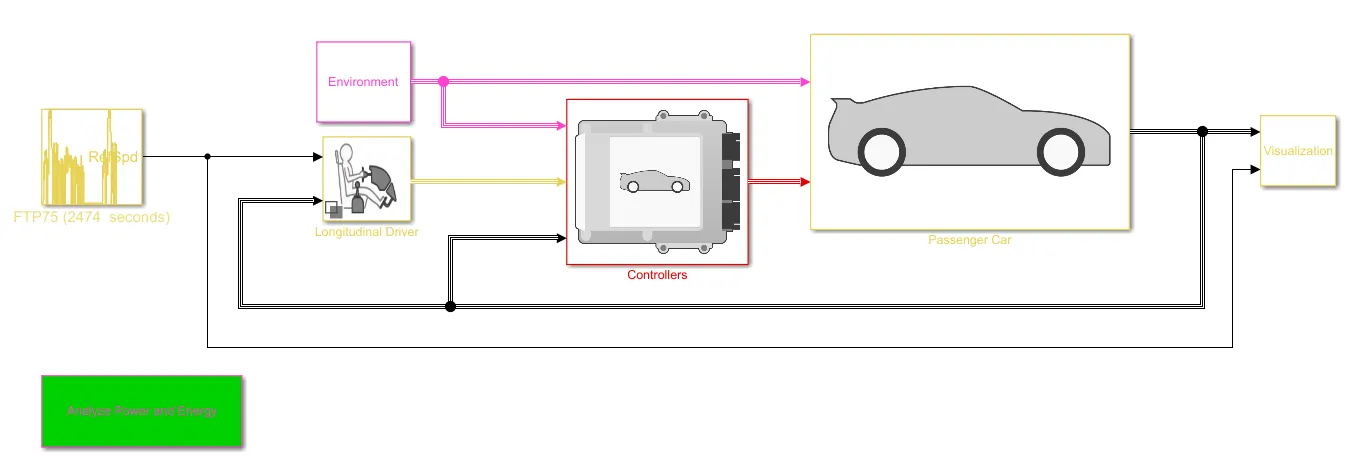
on running the simulation,results :-
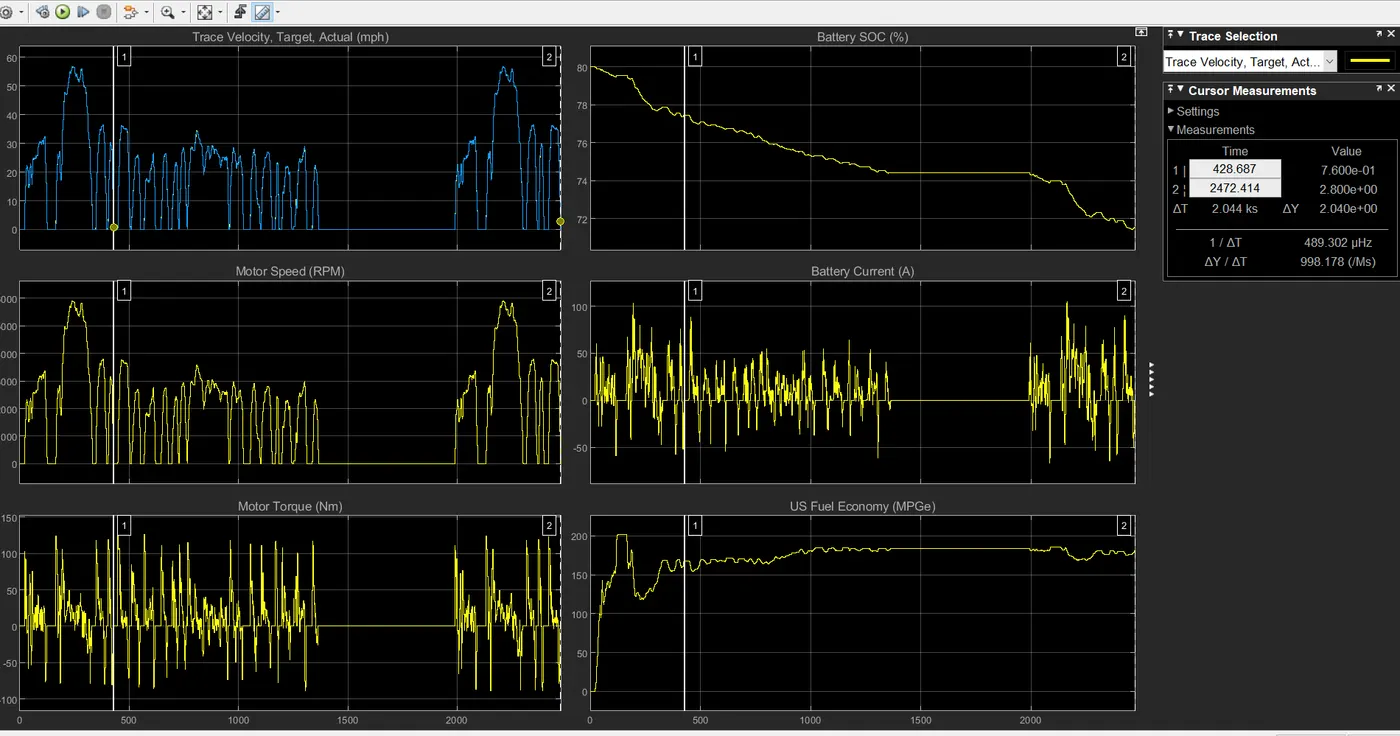
-->In the case of EV model although, there is a equivalent fuel economy plot generated in terms of milels per gallon.But, since EVs don't really use any fuel.So, this graph is basicaly a comparison of amount of miles per gallon of equivalent energy used by the vehicle.Generally pure electric vehicles above 100 miles per gallon efficiency.
-->for an electric vehicle to reach its top speed, positon the cursors on the drive cycle plot in a portion of the plot where the vehicle has seemingly accelerated to the to its top speed from rest, ie here for a time of 80 secs 56moh speed has been achieved by the vehicle 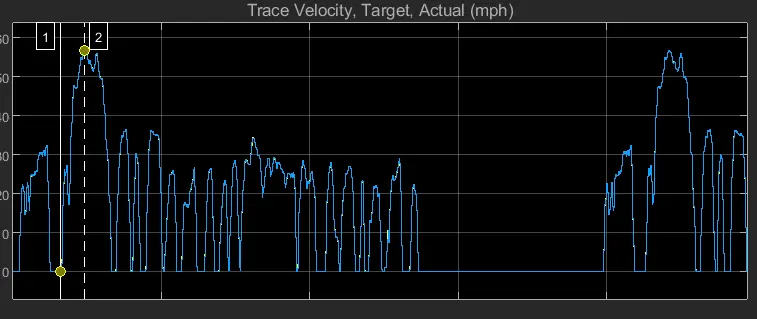
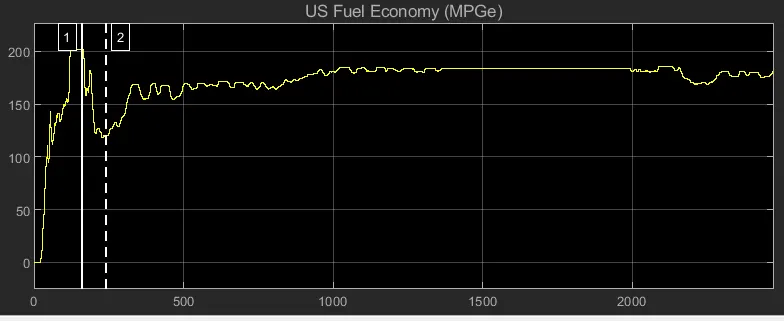
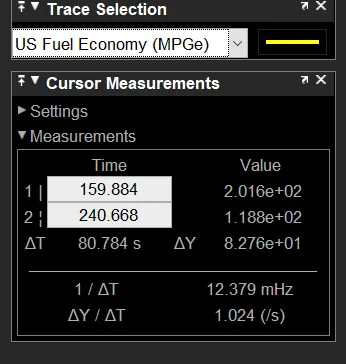
So here for in order for vehicle to accelrate to reach 56miles per hour speed, the equilvalent energy used is 80 miles per gallon approx. This is reasonably high efficiency resulting in drop in efficiency by just 20 miles per gallon approx.
for HEVmodel:-
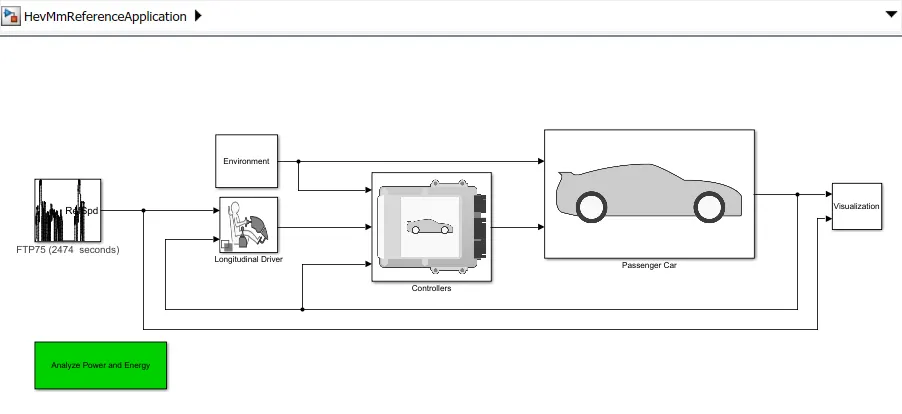
On running the model simulation :-
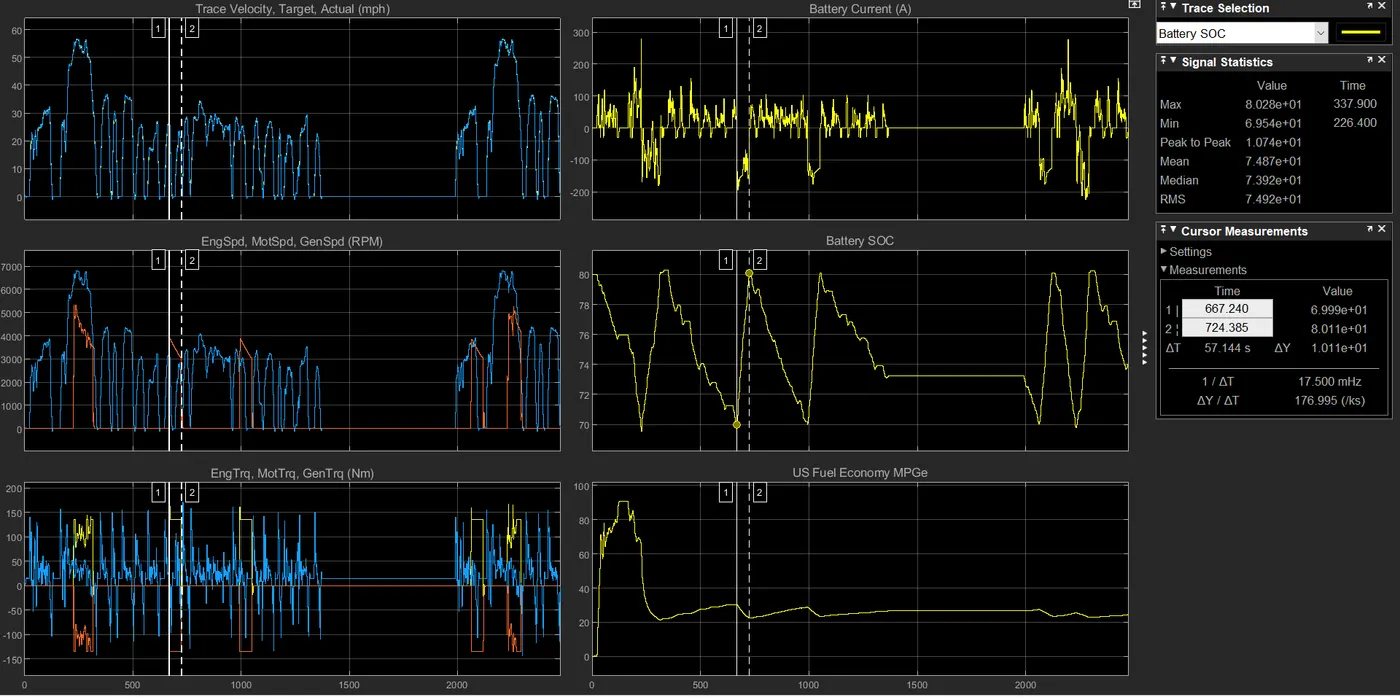
-->In the case of HEVs the control strategy implemented is basically thermosat type control strategy i.e on-off type controller exactly.On running the simulation and observing the results, it can be understood that the battery soc gets maintined between 70-80% .And from the torque plot of motor, engine and generator, it can be understood that the engine runs whenever the battery gets charged.
--> Positioning the cursors at the batery soc charging from 70 -80%, the battery charges from 70-80% with in 80 secs approx, during which the engine is activated.And during this period there is a drop in fuel economy , the reason for the mpg drop is obviously beecause the engine is running while the vehicle is charging and the engine fuel efficiency is lower in comparison with motor and generator.
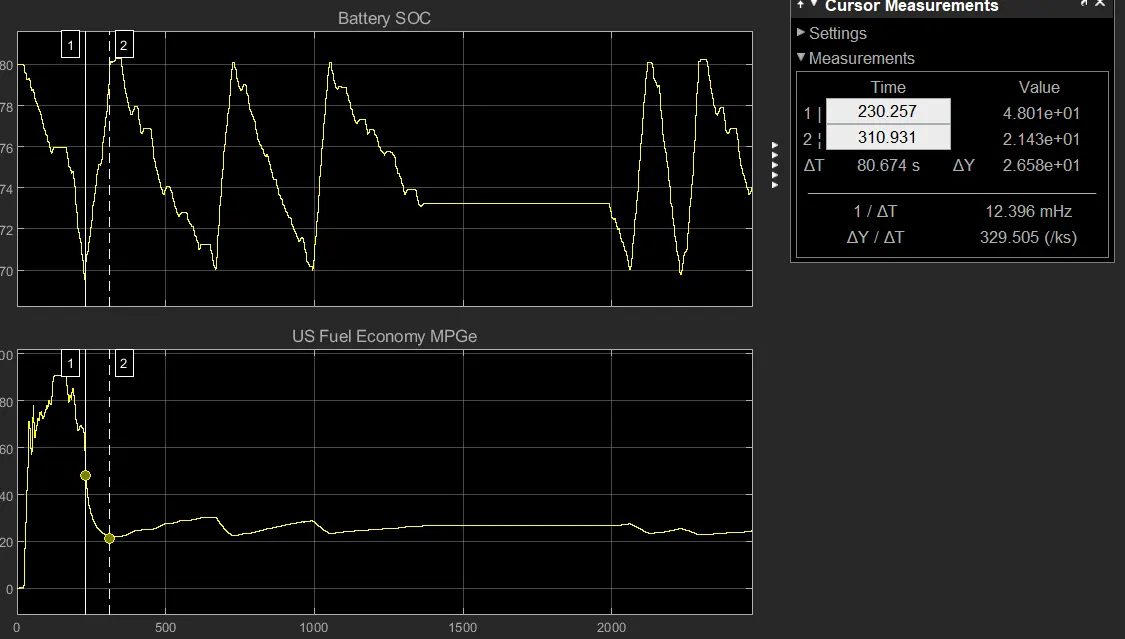
So, there is a drop in fuel economy to reaching 26 mpg approx.
3.) Wide open throttle test using HEVrefrenceapplication model:
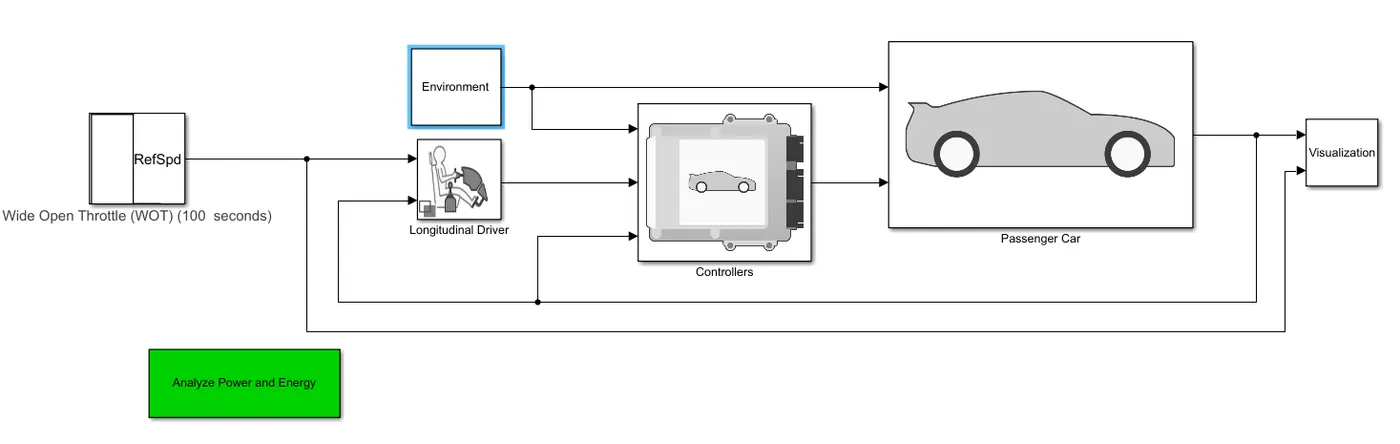
--> The structure of the Wide open throttle is such that, it essentially depicts the case of a driver pressing the throttle padel the fulllest and it is kept in the same position, generating throttle, this is known as wide open throttle mode or WOT mode.
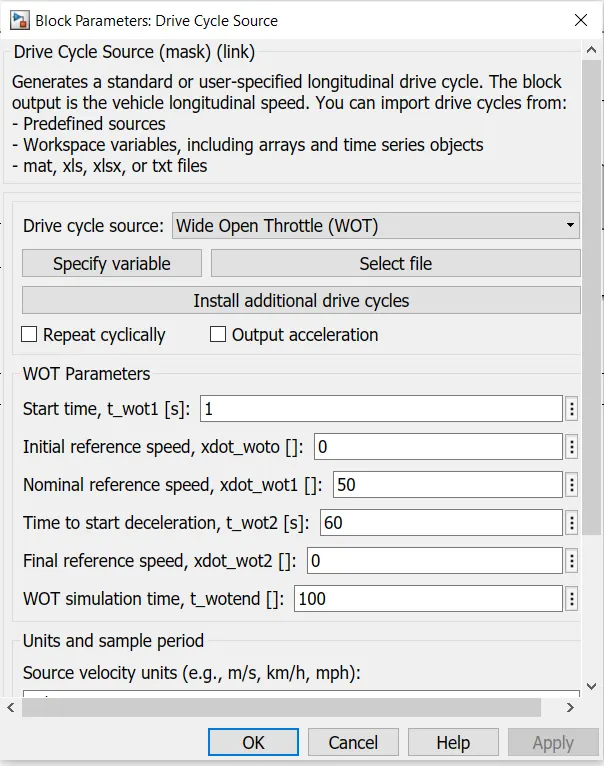
---> We set the drive cycle sorce as Wide open throttle(WOT) and set the block parameters as:-
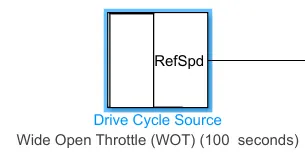
case 1:-
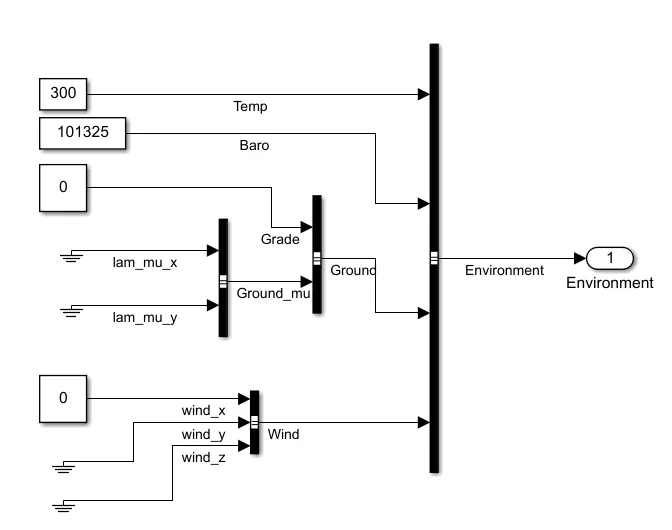
In the first case, we set the environment block data, as it is by by default:-
Then, we run the simulation, then.
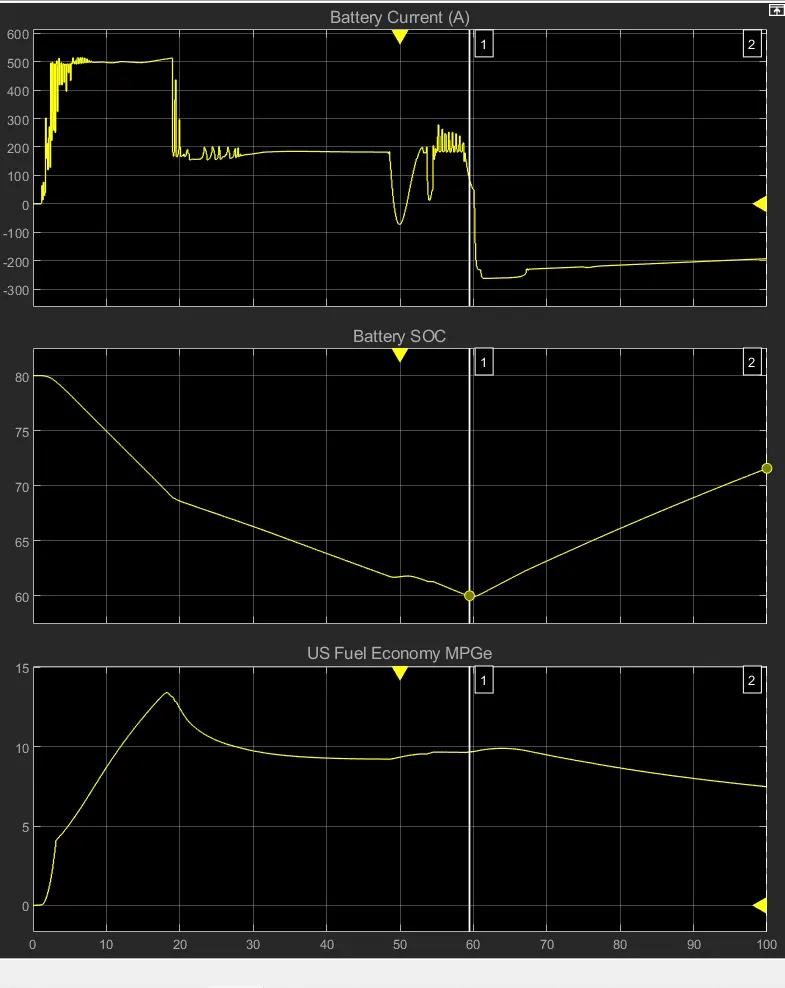
Simulation results are as follows in the scope window:-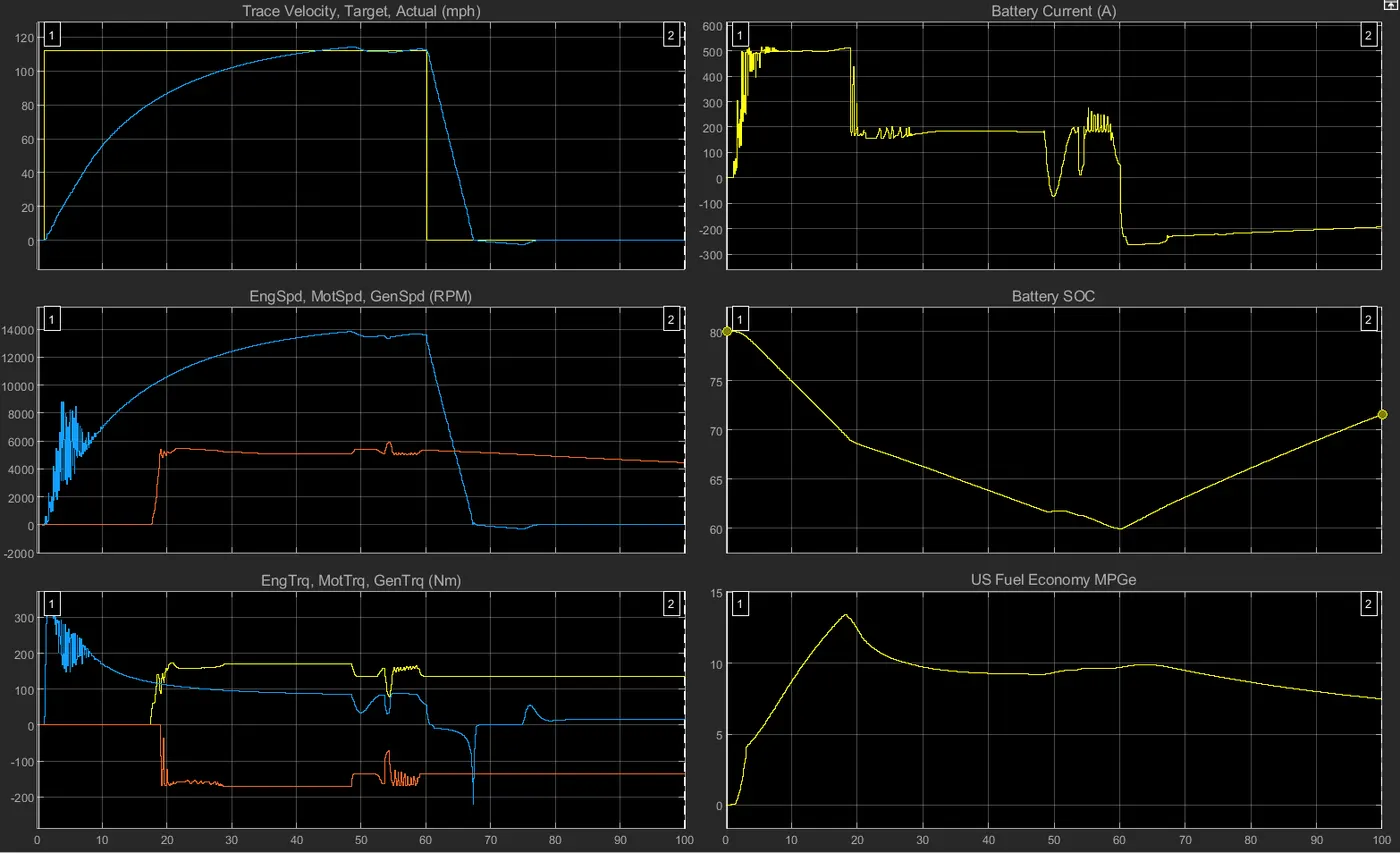
- Lets now look at the first graph depicting the plot of trace velocity, target velocity(mph). The target actual velocity is yellow plot, while input trace velocity is blue plot.In this graph the drive cycle we have applied is a step command or step function , due to which the vehicle should theoritically rech the max velocity in no time.Hence , it is called the Wide open throttle.
- Here the max velocity is 112mph , before the drive cycle decelerates.Despite this being the case , the trace velocity ia not moving quickly, it is aking more accelrating time.
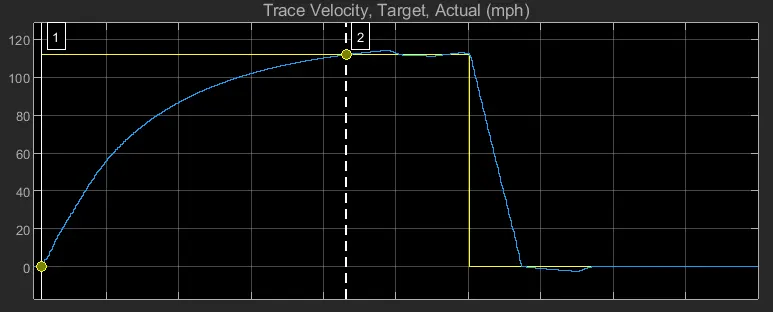
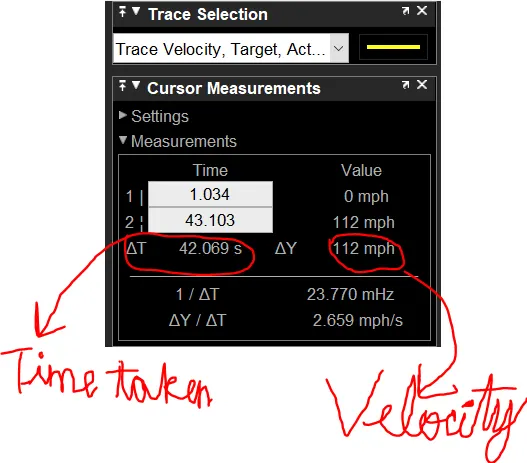
- So, the time taken by the trace velociy plot to reach the max speed of 112mph is approx 42 seconds. The reason for this maximum motor power.So, in this case of this hybrid vehicle the electric motor power is limited by the battery current(A).
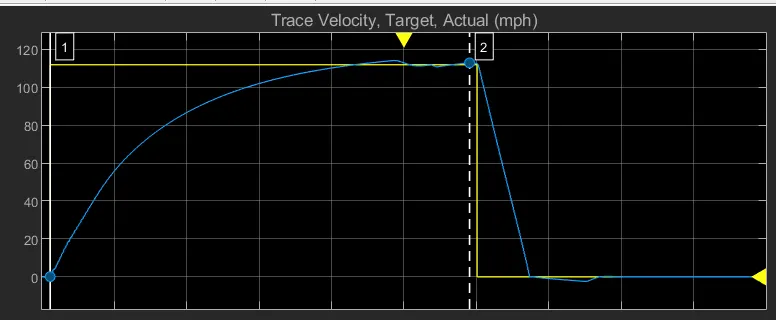
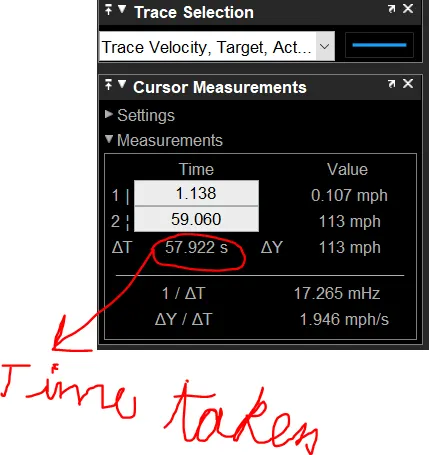
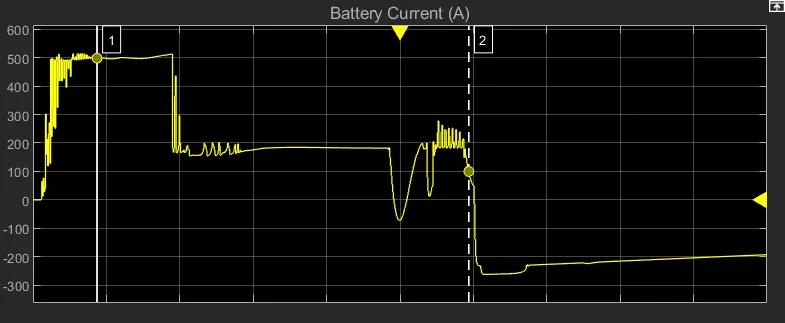
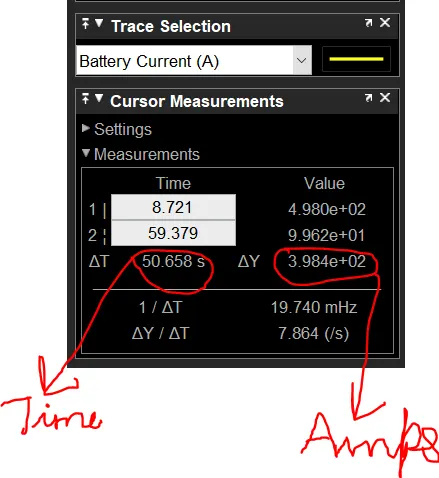
- We can observe in the battery current plotthat initially there is huge inrush current which could be attributed to the high starting torque of the electric motor, these fluctuations finally stabilize at a constant current value of approx 500 amps. Here we have set the WOT drive cycle to maintain a max speed for 60 secs after which the there is scheduled deceration. So, between this period there has been a considerable drop in the battery current , an approximate drop of nearly 398 amps. Clearly, indicating that battery current limitations increases the acceleration time.
- In case of the hybrid vehicle the control strategy is such that of thermostat type.Basically an on and off type control strategy, here the battery soc is maintained between a limit, which in this case is around 80-60% soc. So, based on this control strategy whenever the battery is depleted, the engine is started inorder to charge the battery.
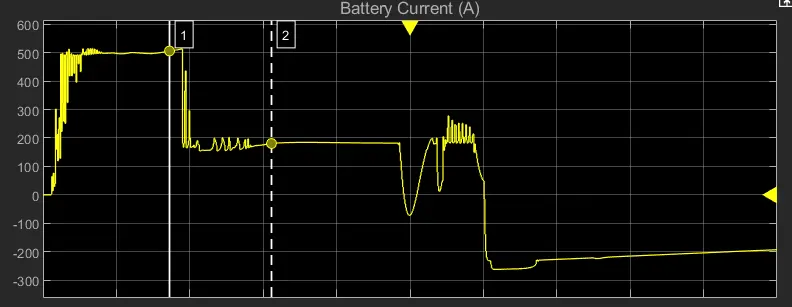
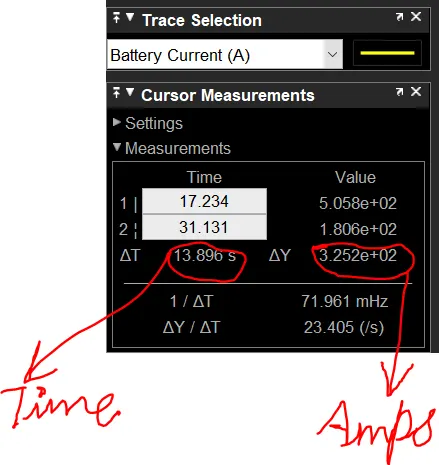
Here , 17 seconds into the simulation, there is a significant drop in the battery current ,within the next 13 seconds there is a drop in battery current from approximately 500 amps to 86 amps, which is a drop of almost drop of 325 amps in battery current.
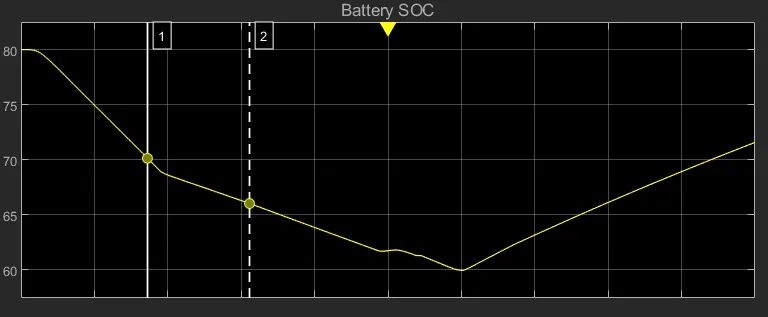
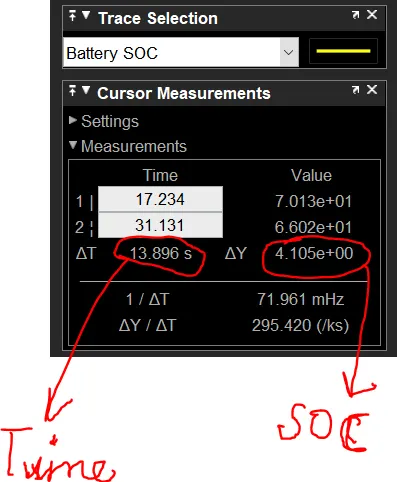
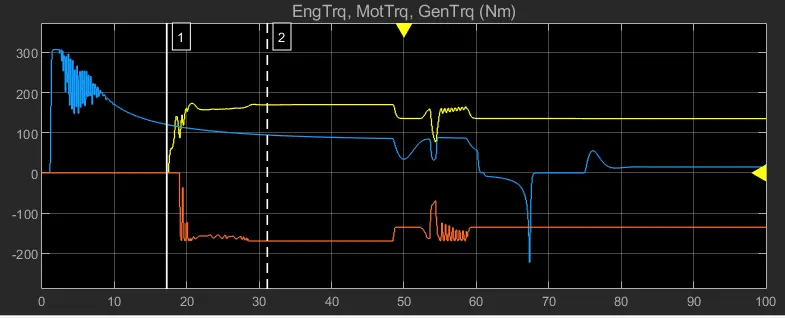
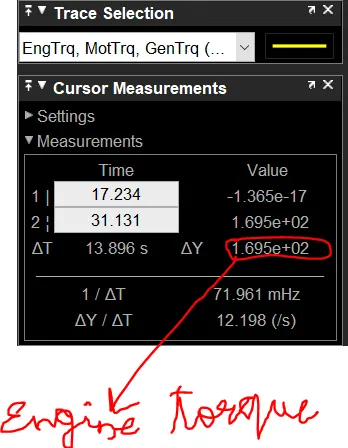
Here, as the battery soc drops close to 66 % and this is the engine starts to run parallely alongside with the electric motor in the hybrid mode, so as to compensate for drop in battery current.
On looking looking at the Fuel economy plot during this same time period,
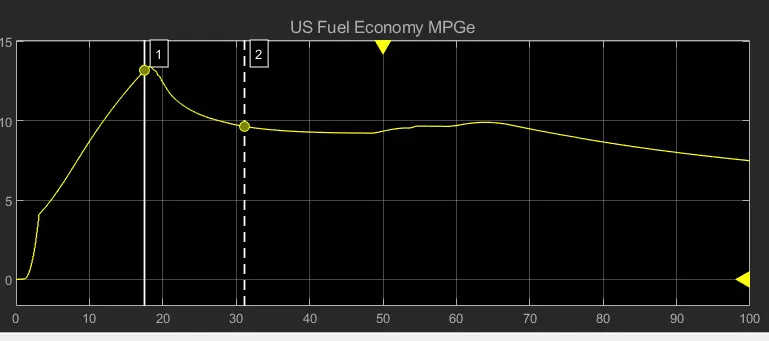
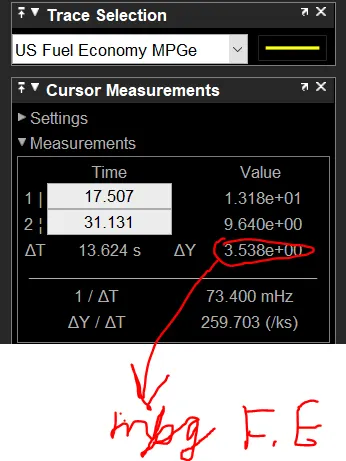
approximarely 31 secs into the simulation the fuel economy drops from 13 mpg to 9.6 mpg, roughly a 3mpg drop in fuel economy.
- This hybrid mode where where the engine is ruuning alongside the motor continues till the vehicle reaches the point where the actual drive cycle plot starts to decelerate and where the battery soc drops to 60. As, the drive cycle velocity drop, the trace velocity also decelerates and the electric motor is gradually turned off, since the thermostat control strategy is implemented which allows for the battery charge to be replenished by running the vehicle using the engine alone mode.
As the drive cycle approaches the point of deceleration, the motor torque is gradually reduced to zero, while the engine torque and generator torque keep running .
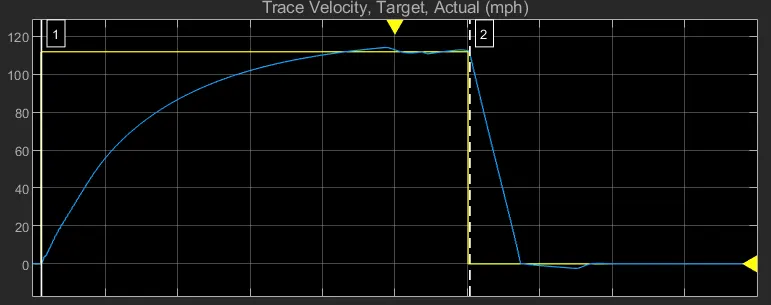
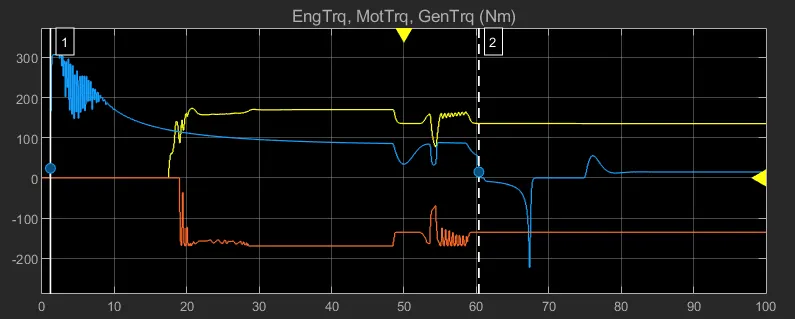
At the start of the deceleration, the battery current goes negative, essentially indicating the fact that the battery is getting recharged.Also the battery stae of charge during this decelration period reaches 60 % and it starts increasung and reaches 70 %. Also, there is further drop in fuel economy is observed , thus indicating that the engine is running, while the battery recharges.
Case 2:-
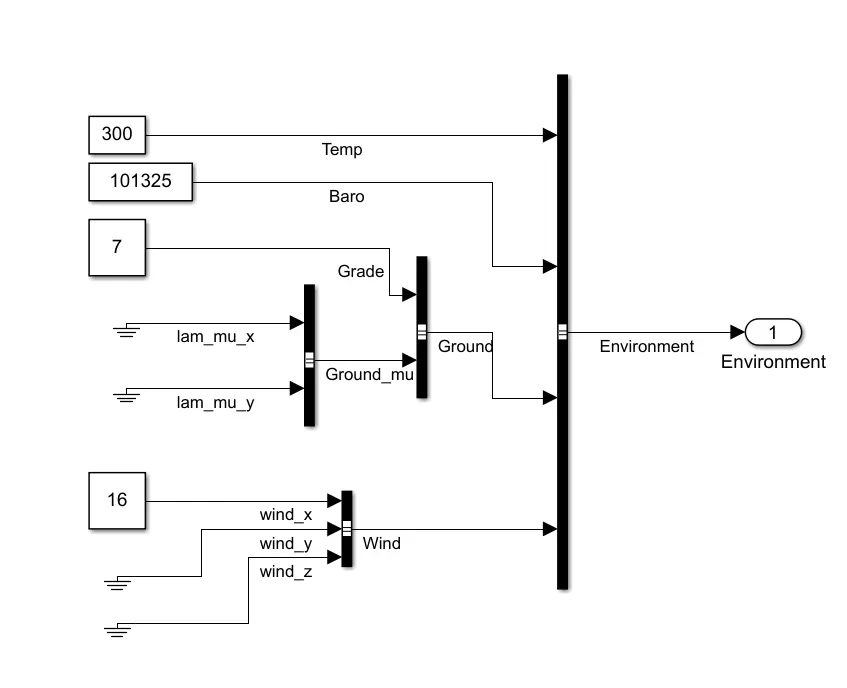
For the 2nd case we'll change the environment paraters, we'll increase the grade to 7% and we'll increase the wind velocity to 16units.
We, then run the simulation for the HEV model.Then the results of the simualtion are as follows:-
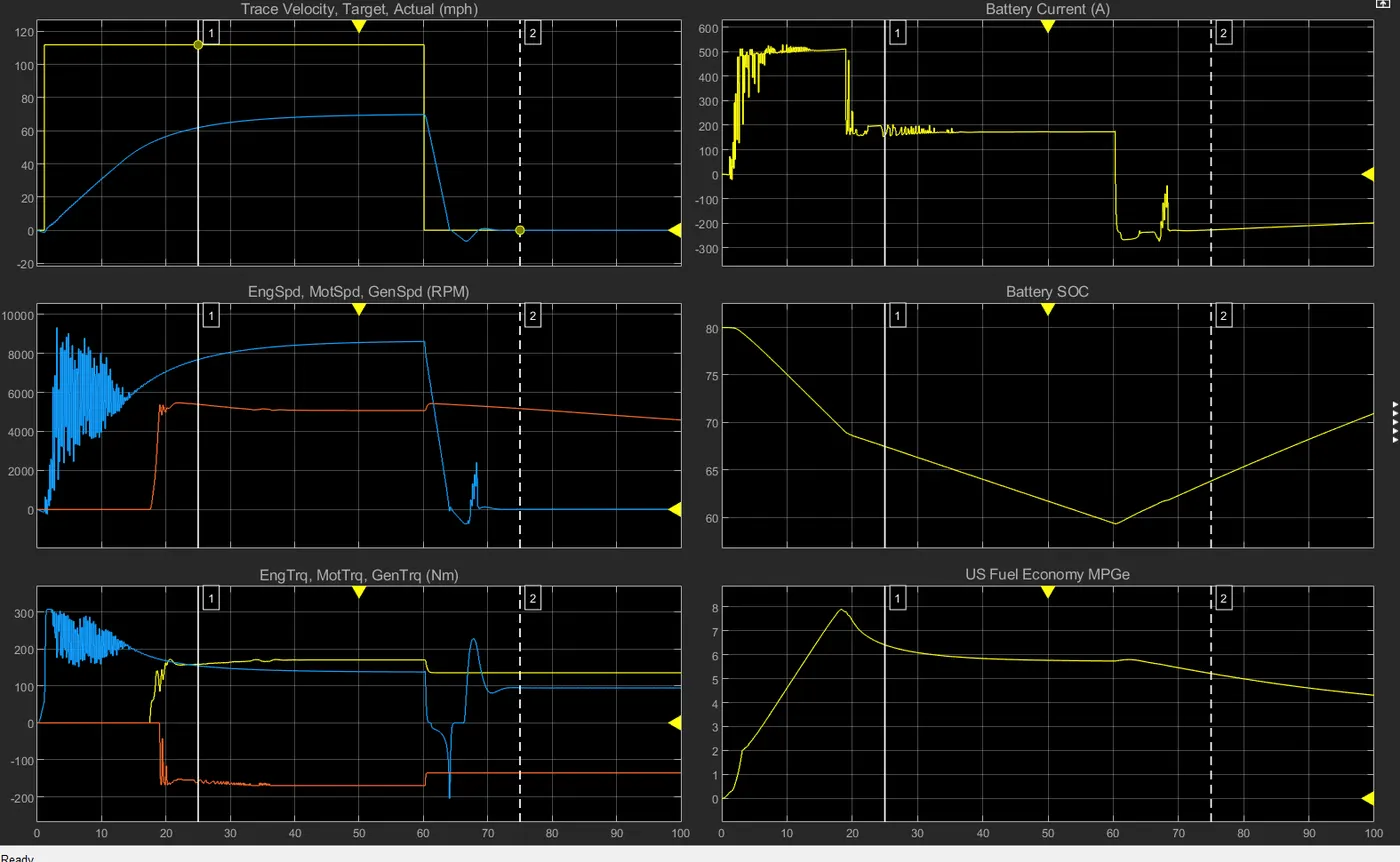
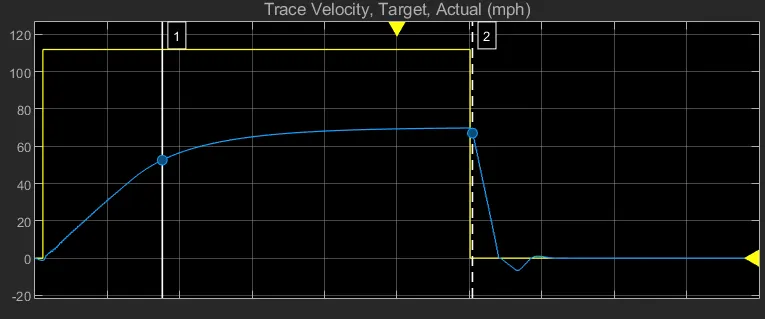
Here, the actual speed which is arounf 69 mph approx.In earlier case with zero gradeablity the vehicle's acutal speed would follow the drive cycle input.But, since the gradeablity has been increased by 7 units comparatively lower speeds are attained as a result.
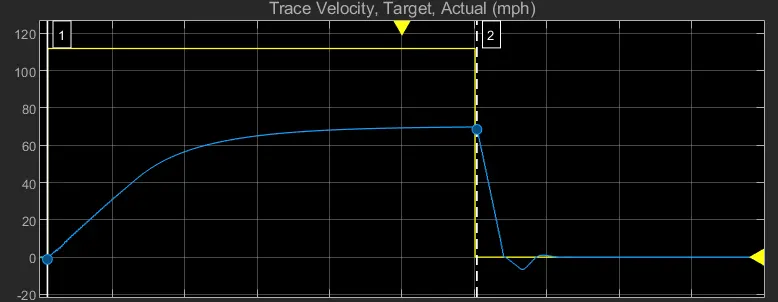
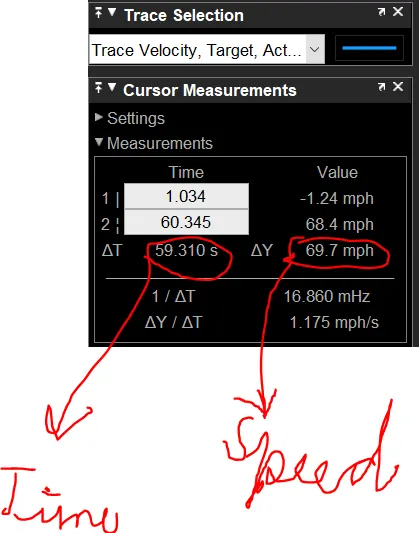
The reason for this lower speed can attributed to the fact that the battery current is limited by the battery management system.
Now, the vehicle's battery current drops 17 secs into the simulation and as a result this compensated by the engine which parallely runs alongside the motor, in hybrid mode in order for the vehicle to reach the decelration point.
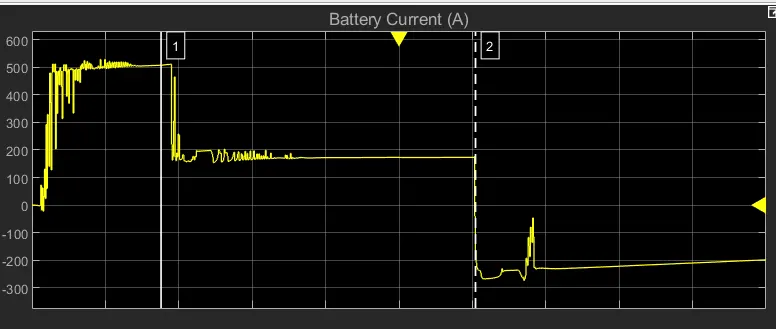
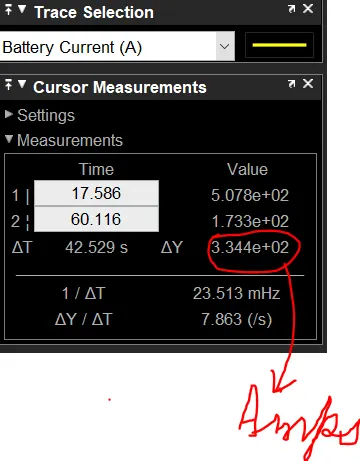
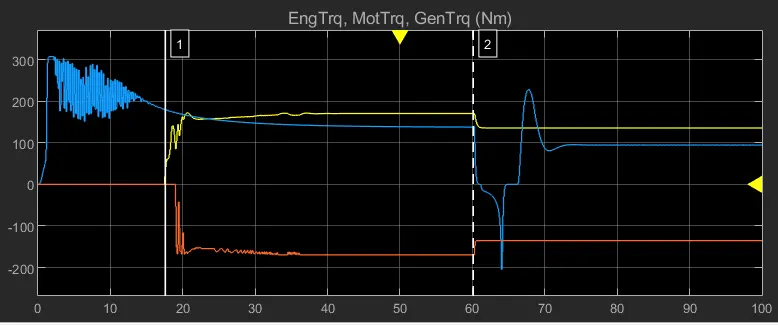
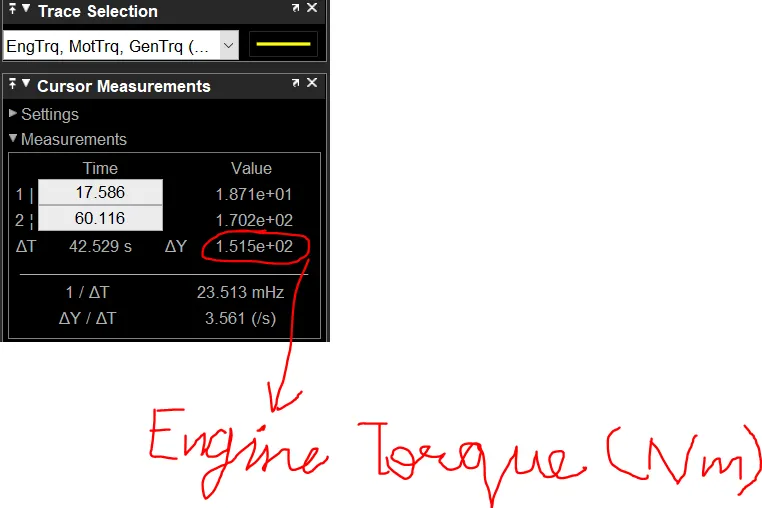
It could be observed that battery current starts to drop 17 secs into the simulation .Now in order to componsate for the drop in battery current, the engine runs alongside motor in a hybrid mode, maintaining a constant torque of 170 Nm approx, so that constant battery curent of 173 amps apprx is utilized from this point on to the point of decelration.
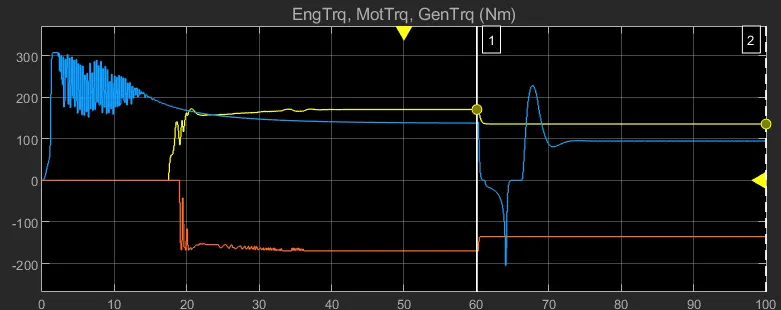
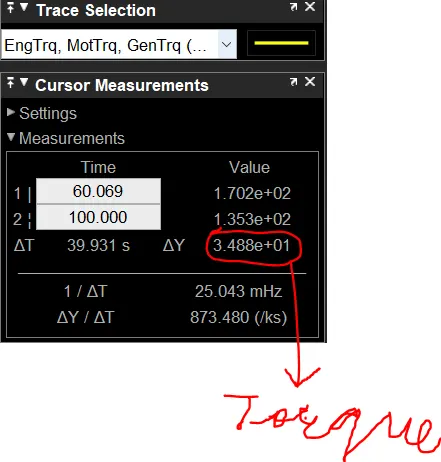
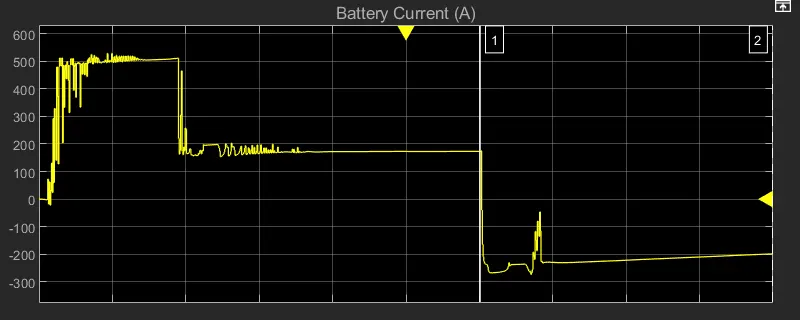
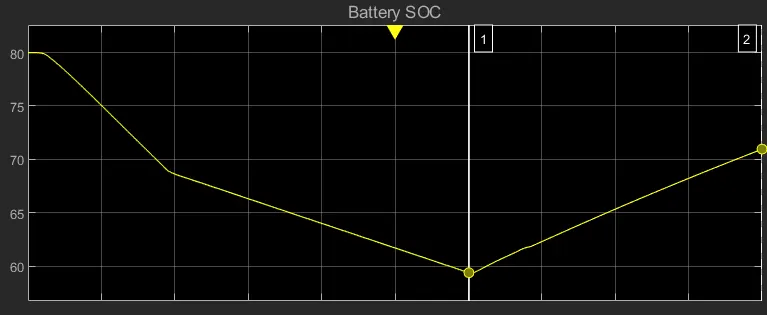
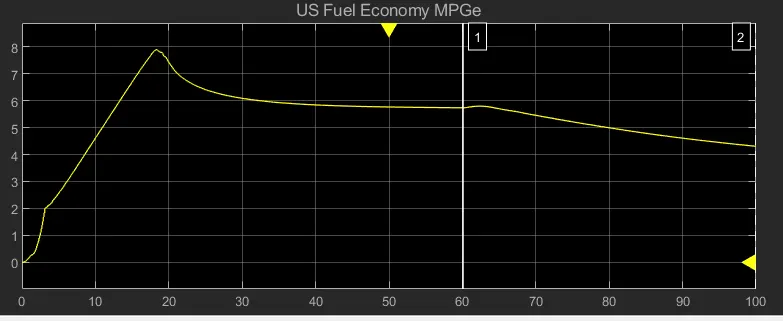
--> Now beyond the deceleration point, the the battery soc drops to 60 % , and and the motor torque graually decreases and so according to the control strategy the engine produces a contant torque , alongside the genertor torque. This battery getting charged could be inferred from the negative battery curent gernerated, the rise in battery soc from 60 % and from the frop in engine fuel economy here.
Constant engine torque is produced as the motor torque decreases to zero,
The current plot goes negative indicating tht the battery is getting charge,
Here the SOC increases from 60 %as the battery charges,
And the since the battery is getting charged the fuel economy goes down , since the engine is running genrating a constant torque.
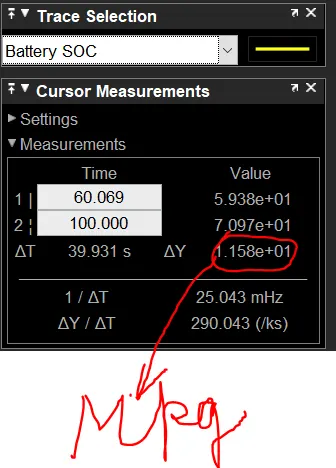
---> Hence, this was the comparaison between HEVrefrence application model with different grade and wind velocity.
4.)
Now, Lets perform the simulations for 7 % grade and ind velocity at 16 units.
for EV:-
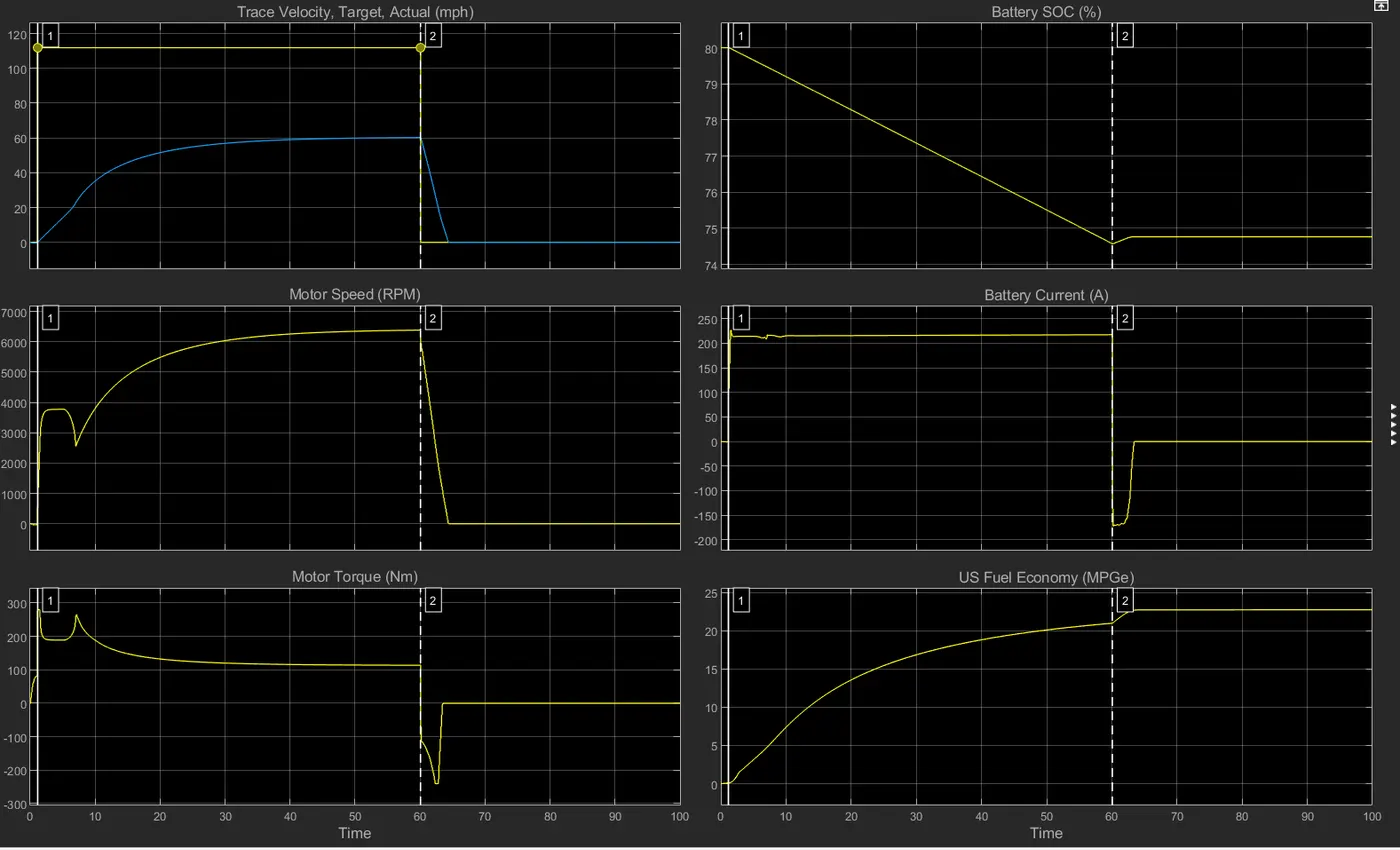
The results are as follows:
Now, lets look at the velocity plots:
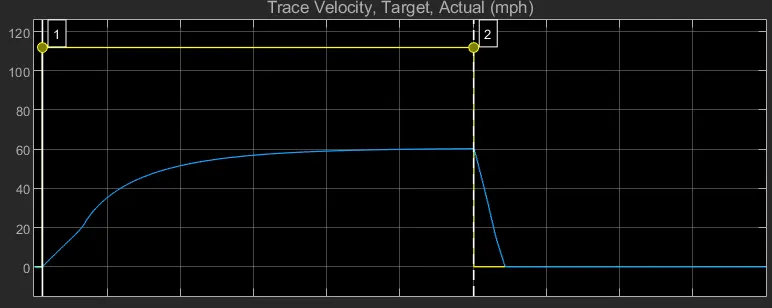
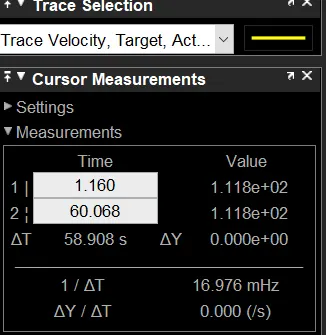
From this plot the maximum speed attained by the wide open throttle drive cycle is 111 mph approx in a matter of 60 secs, before the drive cycle decelerates.
But, the vehicle's actual trace velocity has a longer acceleration time and it is limited to 60 mph approx in 60 secs before the deceleration happens.
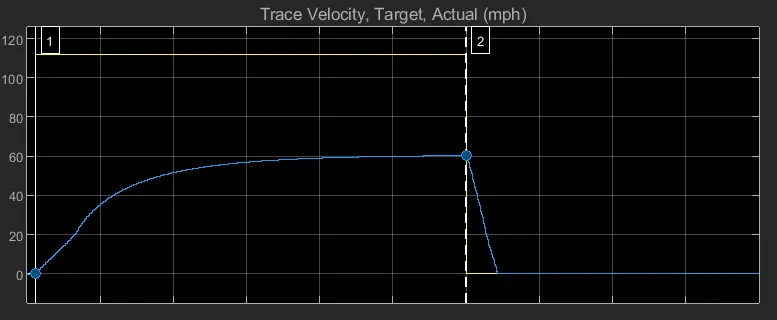
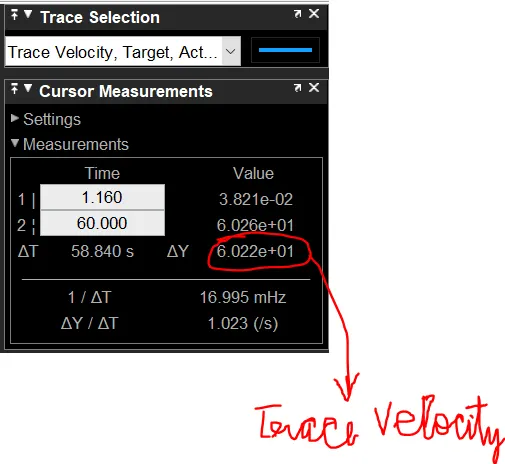
So, lower speed is obtained with the increase in the grade by 7 units. Obvious reasons for this is we do not have any higher battery current than which is already been provided by the battery management system. So, even if more power is demanded by the vehicle but, because of the battery current limit, more current cannot be provided.
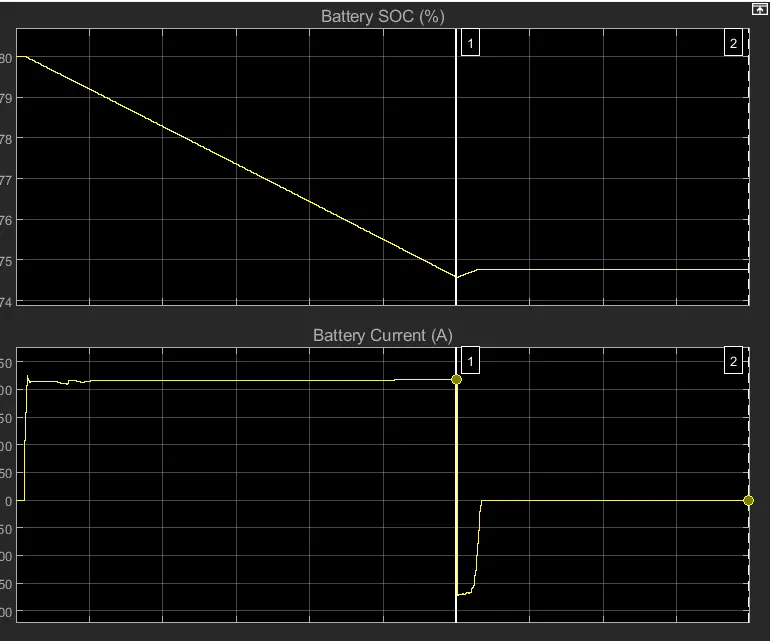
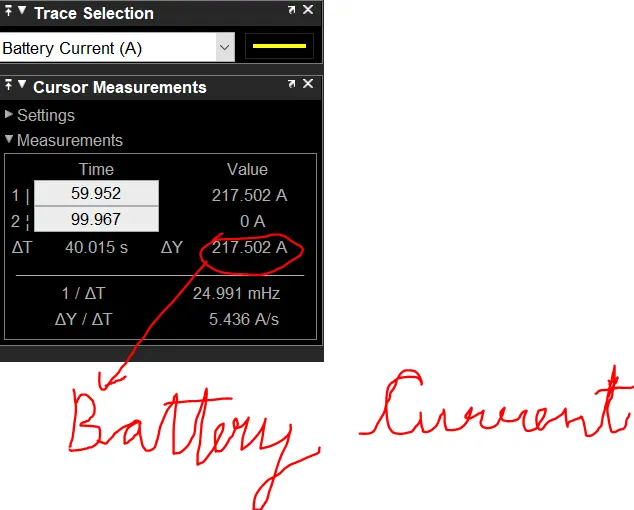
For a wide open throttle drive cycle almost a constant battery current of 215 amps provided by the battery pack, till the refrence time of 60 secs beyond which the vehicle decelerates.
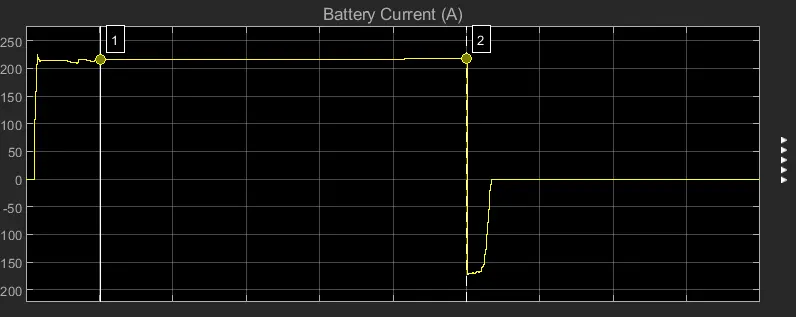
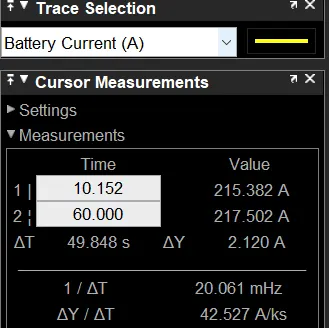
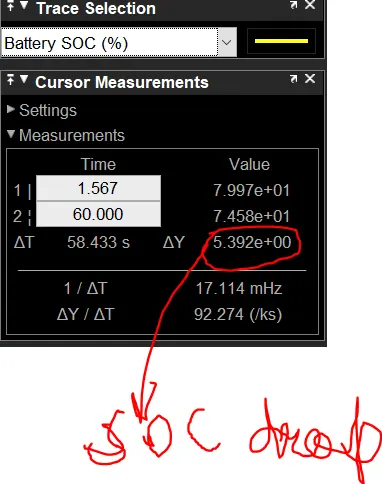
During this wide open throttle of cycle, when the refrence time of 60 secs before the deceleration, the vehicle battery soc drops from 80 to just below 75 %.
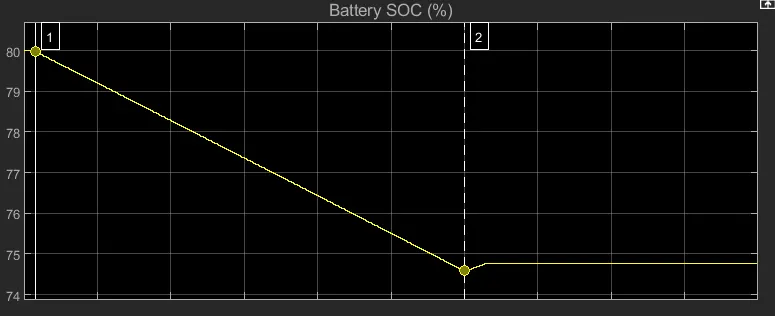
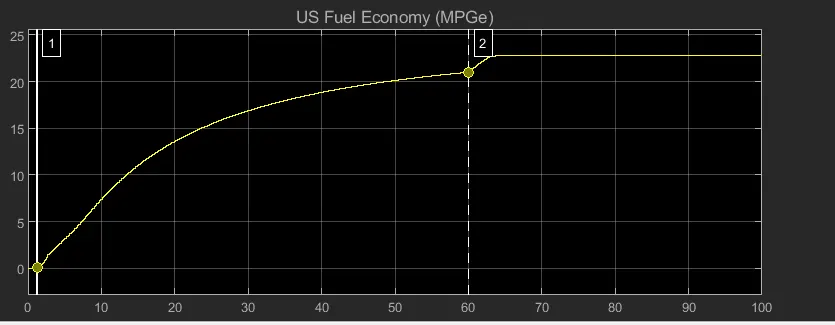
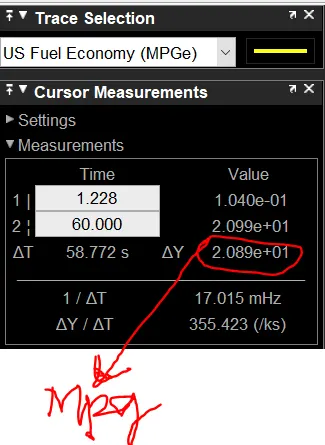
The equivalent fuel economy during this wide opeen throttle before deceleration point is around 20.9 mpg approx.
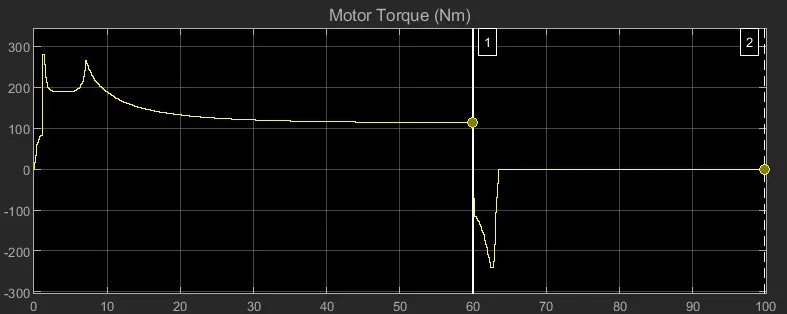
As the vehicle starts to decelerte , regenerative braking happens whichis inferred from the negative motor torque and the motor torque graually reduces to zero, likewise the battery current becomes constant and remains the same and so does the battery state of charge or soc, which reamains the remains just below 75%. This indicates that the vehicle has come to rest and has halted.
Regenerative braking generates -ve torque and gradually motor torque becomes zero,
The battery current (A) becomes zero and the State of charge(SOC) also becomes constant at their current values at the vehicle comes to a stop.
For HEV:-
Noew, we will be running the simulation for HEV moel with same environment bloack parameters of 7 units grade and 16 inits wind velocity.
On running the simulation, we obtain the following results:-
Here also the actual speed which is around 69 mph approx.In earlier case with zero gradeablity the vehicle's acutal speed would follow the drive cycle input.But, since the gradeablity has been increased by 7 units comparatively lower speeds are attained as a result.
The reason for this lower speed can attributed to the fact that the battery current is limited by the battery management system.
Now, the vehicle's battery current drops 17 secs into the simulation and as a result this compensated by the engine which parallely runs alongside the motor, in hybrid mode in order for the vehicle to reach the decelration point.
It could be observed that battery current starts to drop 17 secs into the simulation .Now in order to componsate for the drop in battery current, the engine runs alongside motor in a hybrid mode, maintaining a constant torque of 170 Nm approx, so that constant battery curent of 173 amps apprx is utilized from this point on to the point of decelration.
--> Now beyond the deceleration point, the the battery soc drops to 60 % , and and the motor torque graually decreases and so according to the control strategy the engine produces a contant torque , alongside the genertor torque. This battery getting charged could be inferred from the negative battery curent gernerated, the rise in battery soc from 60 % and from the frop in engine fuel economy here.
Constant engine torque is produced as the motor torque decreases to zero,
The current plot goes negative indicating tht the battery is getting charge,
Here the SOC increases from 60 %as the battery charges,
And the since the battery is getting charged the fuel economy goes down , since the engine is running genrating a constant torque.
---> So, when comparing the EV an HEV model with similar grade of 7 units and 16 units wind velocity, it could be interpreted that due to increase in grade more power is demanded by the vehicles in order to match WOT drive cycle speed. But since power is generally limited due to battery current provided by the battery management system, the trace velocity curve in both HEV and EV models is unable to match WOT drive cycle velocity. Although , the actual velocity atained by both EV and HEv may be similar, but HEV actually acchieves a slightly higher velocity than the EV.
This could be attibuted to the control strategy of the HEVs in general, where a thermostat type on/off strategy , turns on the engine for the HEV, in order to compensate for the scenario where the current is limiting the vehicle speeds, this allows the vehicle to run in a hybrid mode , where the engine runs parallely alongside the electric motor. Also once the vehicle starts to decelerate and as the battery soc drops, the electric motor then can be turned off , while the vehicle can be run with engine alone.The vehicle along side the generator would charge the battery while the vehicle is still running.
EV models on the other hand do not hve an engine to compensate for drop in battery currents, as a result the max speed speed attained by EV trace velocity curveis slightly lower than trace velocity of HEV. The EV model as it decelerates the regenrrative braking is used here to briefly increase the battery current and SOC , but soon after it must be stopped and recharged using an external power source in order to increase the battery soc and continue with the travel, due to the absence of an onboard engine to charge the battery while the vehicle is still moving.
But, despite this, theHEVs generally have a poor equivalent fuel economy because the Engines in general are inefficient by design. On the other hand the equivalent fuel economy of EVs is shown to be higher, since Evs use nxt to no fuel and since there are fewer moving parrts in electric vehicles , the power is instantly transmitted to the wheels with fewer loses.