Week-4 Challenge WOT Condition Part-2
1) What is the difference between mapped and dynamic model of engine, motor and generator? How can you change model type?
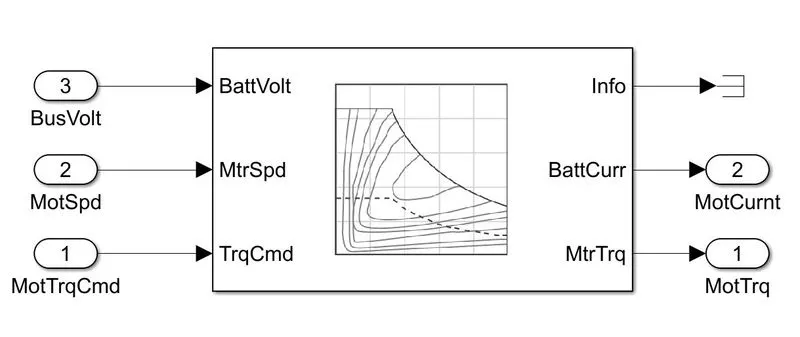
Mapped Model
In mapped model we use lookup tables for entering data within system to simulate the model. This data then configure with operational part and analysis is form. Lookup table values taken from previous experimental data.
As the lookup table used the time required for simulation is less compare to dynamic model
Example Mapped Motor
Dynamic Model
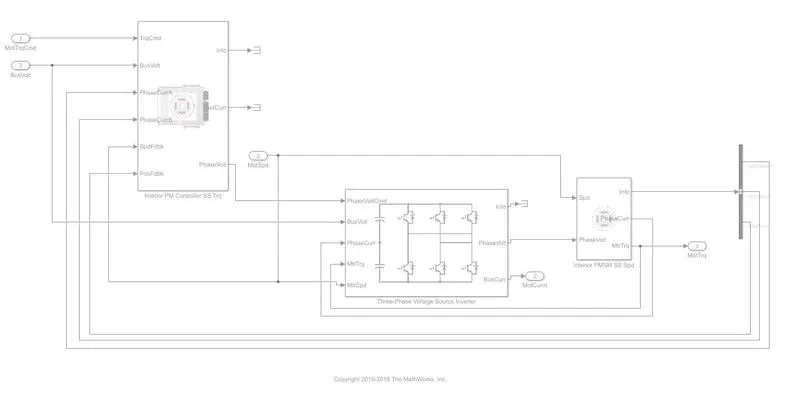
Dynamic models are used when the internal response to a model with respect to its components is needed. It simulates according to real time condition given to model.
Due to real time simulation time required is more as compare to mapped model.
Example Motor Model
Changing model type
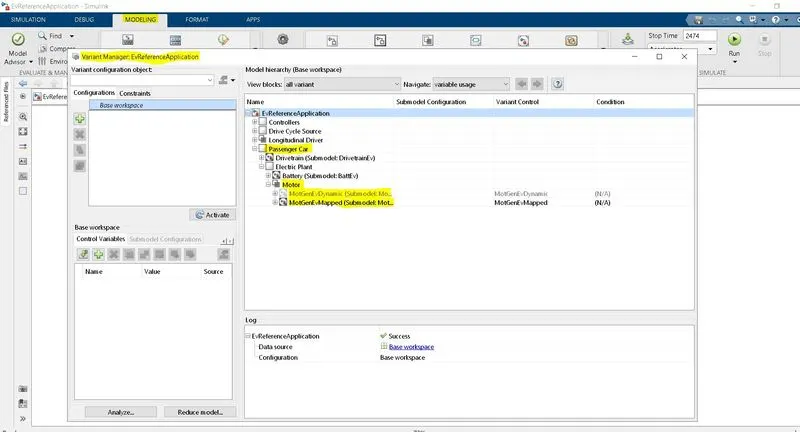
To change the model type we have variant manager in the modeling tab to find the variant systems we have. Right-click on the model you want and use set as Label mode active choice.
2) How does the model calculate miles per gallon?
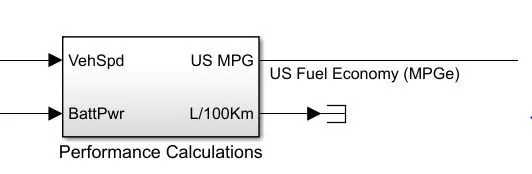
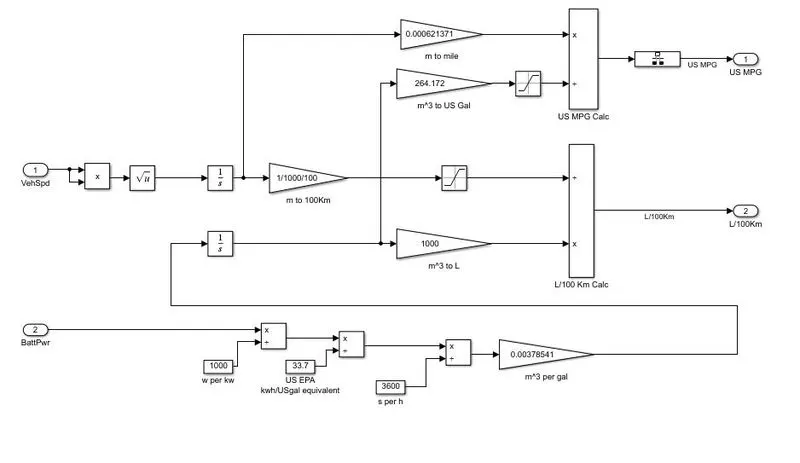
Vehicle speed is used to calculate the distance traveled in meters which is then converted to miles, Battery power is used to find power used in kWh which is then converted to gasoline-equivalent using US EPA value by dividing with 33.7. Dividing distance traveled in miles by the number of gallons, we can get miles per gallon. For HEV this gallon (gasoline-equivalent of battery power) is added with gallon used by IC engine then miles per gallon is calculated.
3) Run the HEV Reference Application with WOT drive cycle. Change the grade and wind velocity in the environment block. Comment on the results.
Within HEV Reference Application
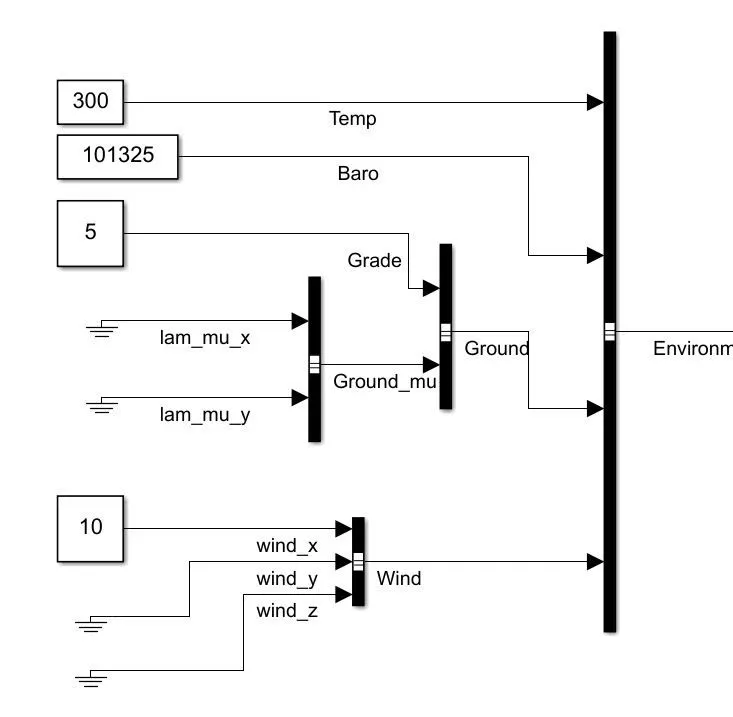
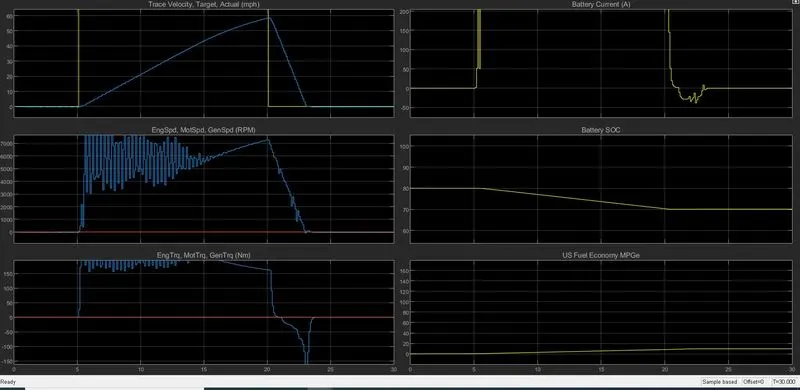
Grade - 5, wind velocity 10m/s
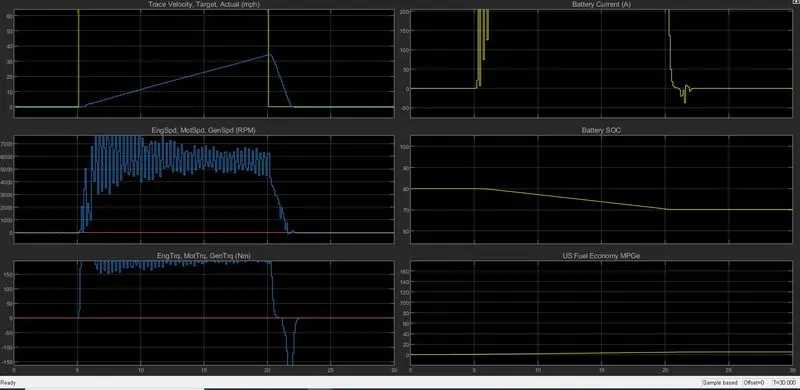
Grade - 10, wind velocity 20m/s
Grade - 15, wind velocity 25m/s
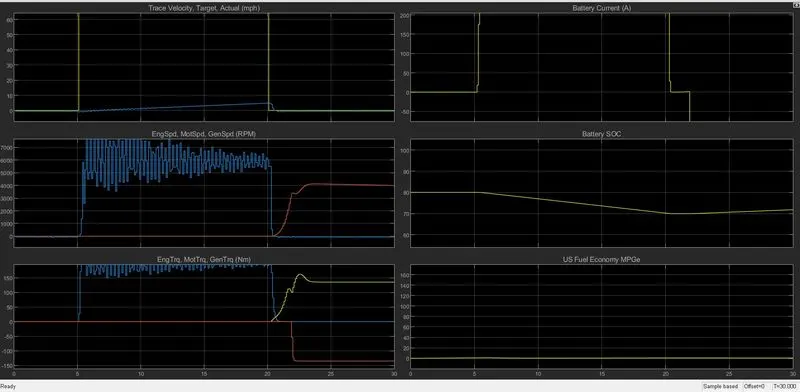
With the increase in grade and wind velocity
- Peak velocity achieved is reduced as gradient force and aerodynamic force becomes dominant.
- Fuel economy is also reduced because the distance traveled is reduced due to external forces.
- Deceleration time is reduced so battery recharging capacity is also reduced.
- Battery SOC at the end of WOT acceleration is similar but during deceleration battery is charged more is the grade and wind velocity is less.
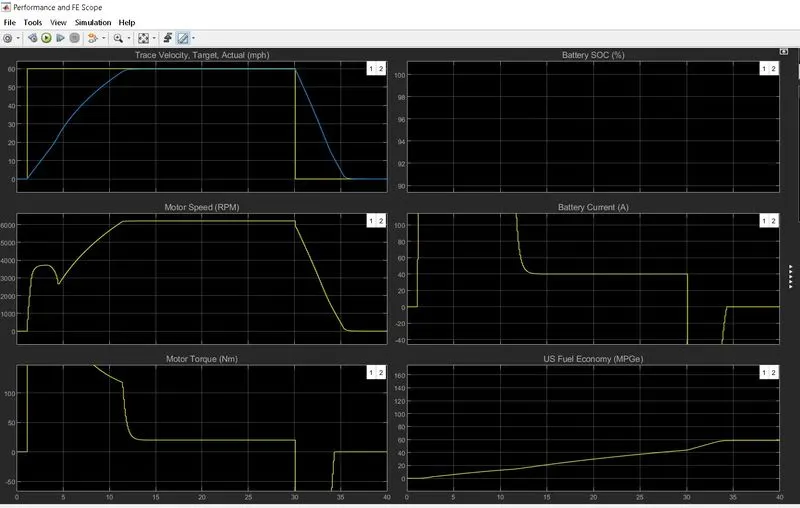
4) Keeping all other parameters same, compare the simulated results of hybrid and pure electric powertrains.
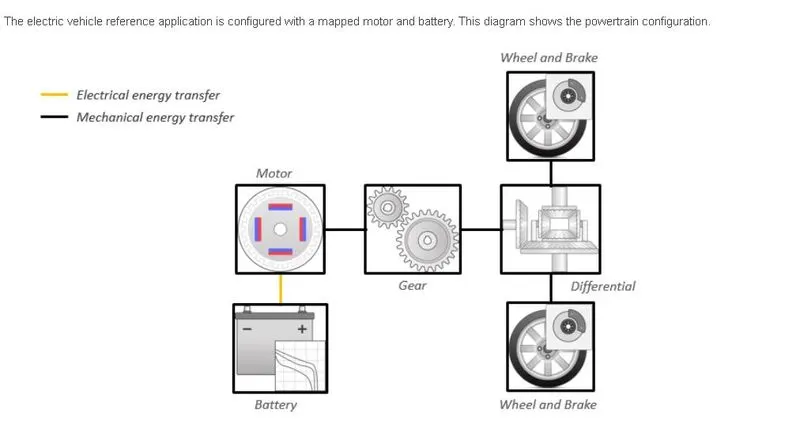
For EV model
Results-
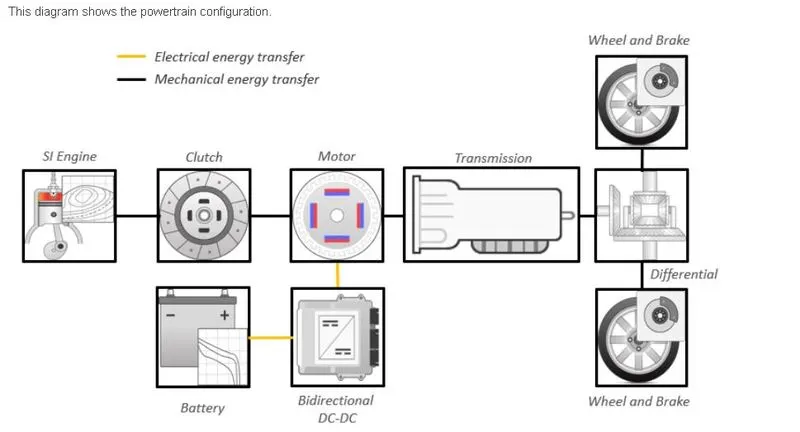
For HEV model
Results-
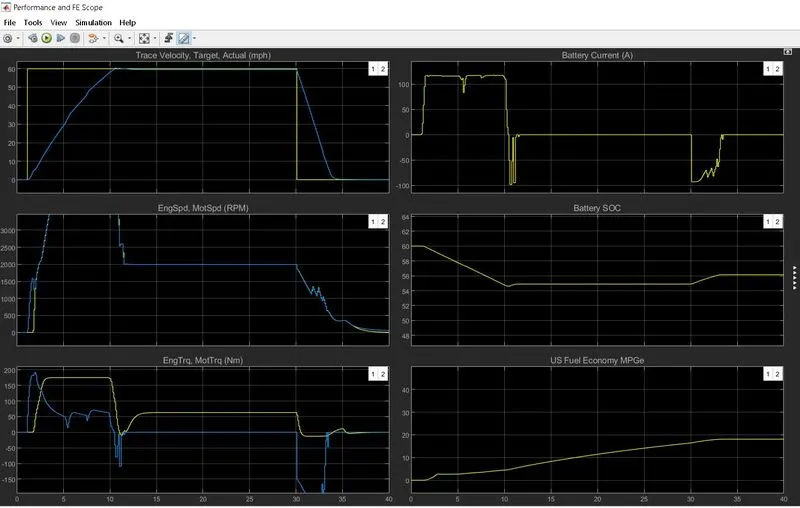
Results
- fuel economy is more for an EV compared to HEV
- Time taken to achieve the required peak velocity is less for HEV as compared to EV
- Deceleration time is also low for HEV as it has many moving frictional parts