Week-4 Challenge WOT Condition Part-2
- What is the difference between mapped and dynamic model of engine, motor and generator? How can you change model type?
|
Sr. No. |
Mapped Model |
Dynamic Model |
|
1. |
This is also known as ‘Static’ model. This model uses values which are stored in the look up table. |
This model uses actual values of components and accessories of motor, engine etc. |
|
2. |
The execution speed of this model is faster compared to dynamic model. |
More time is consumed in this model as it makes use of actual parameter values of the components. |
|
3. |
We can create lookup table to be used in mapped model if we have actual data from a manufacturer. |
It is used when we have more detailed model level data and component level data. |
|
4. |
We need to make many assumptions while creating data. |
In this model actual data is almost equal to the results obtained, as many mathematical calculations are involved in this. |
Following is the process to change the model type.
- Copy the link from ‘Information’ section
HEV Example Link: https://in.mathworks.com/help/autoblks/ug/hev-multimode-reference-application.html
Paste it into the web browser and copy the example link as shown in the below screenshot
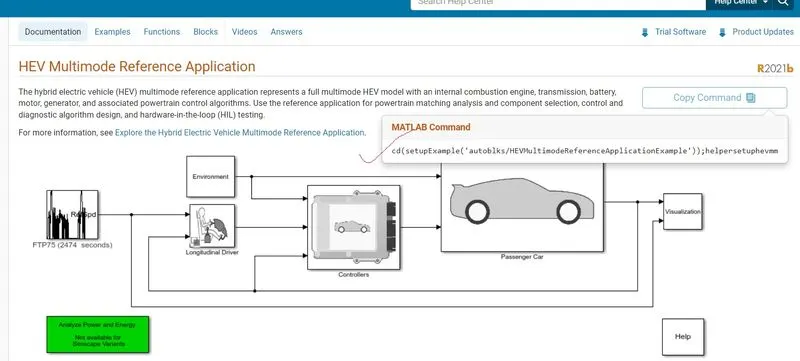
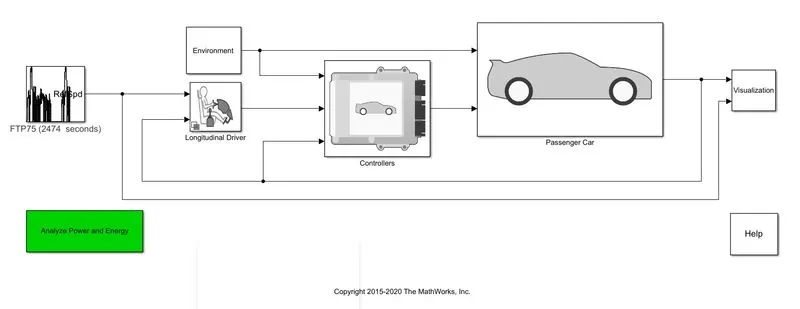
Copy the matlab command and paste it into the matlab , open the Simulink and the model will be opened as shown in below screenshot.
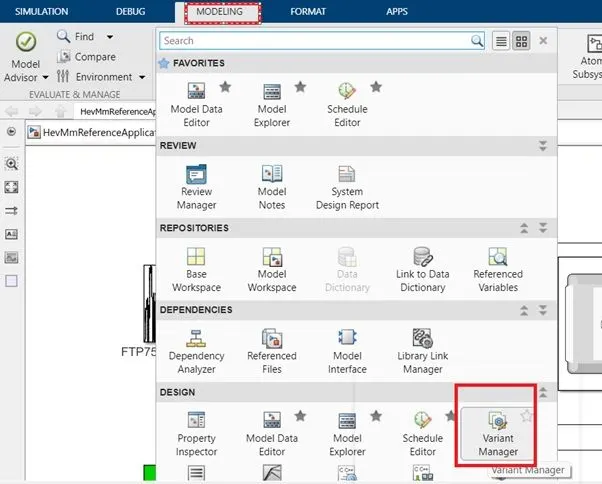
- Next step is to go to ‘modelling’ tab in Simulink, press drop down arrow in ‘design’ tab and locate ‘variant manager’ as shown in below screenshot.
- Open variant manager, you will see following window, choose generator so that wwe can make it active for mapped mode.
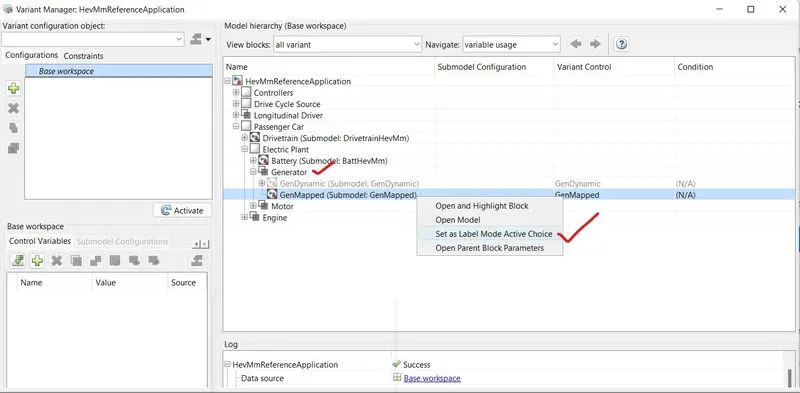
- Now it is necessary to click ‘activate’ button in the base workspace so that the change shall take place in the model.
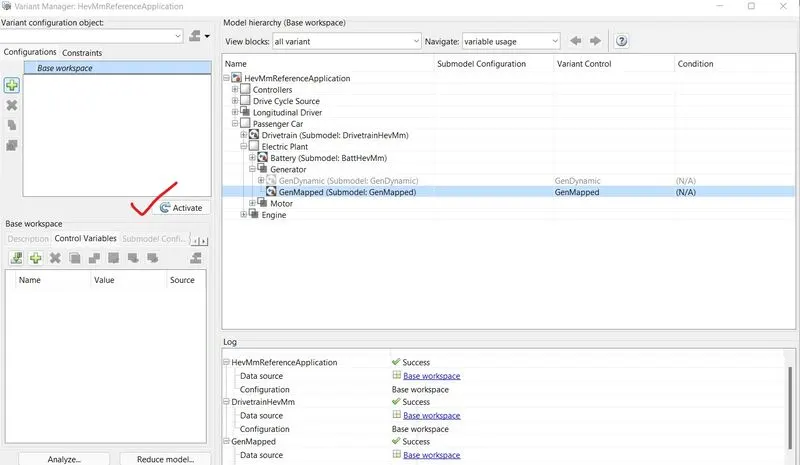
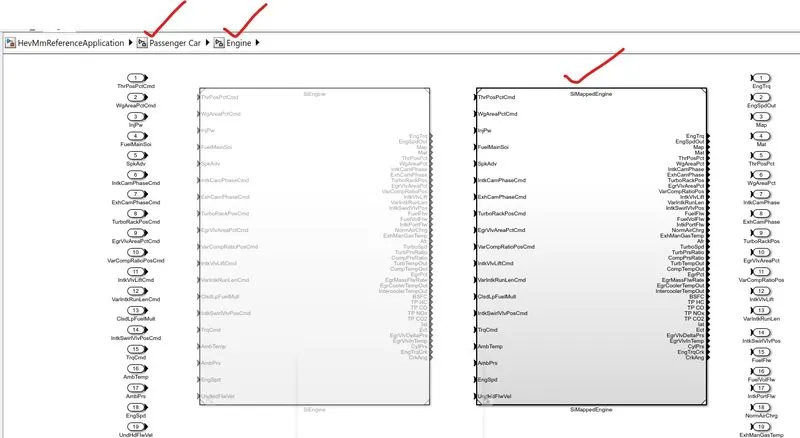
It will take some time to update this change, so wait for it to happen. You can verify the changes updated in the model.
- How does the model calculate miles per gallon? Which factors are considered to model fuel flow?
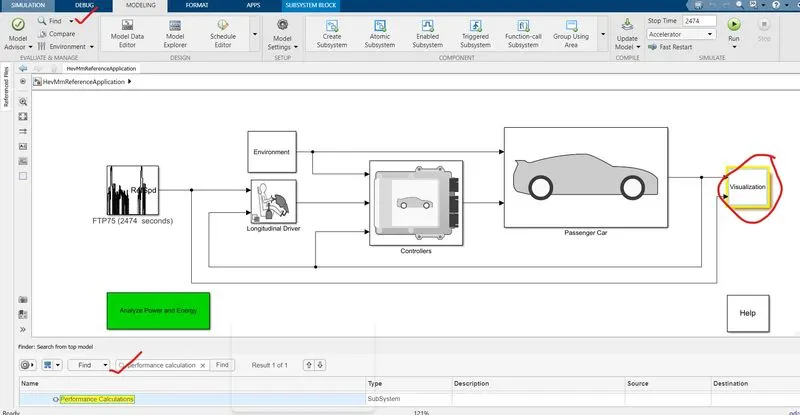
Miles per gallon is the term which gives ups the efficiency of a vehicle. It’s a measure of how much distance a vehicle covers in a given quantity of fuel. The same can be given as km per litre. In short this is efficiency of fuel. In the model of HEV, this is measured from a block ‘performance calculations’. Now to find this block we can make use of ‘find’ option in matlab. Following screenshot shows how to do this.
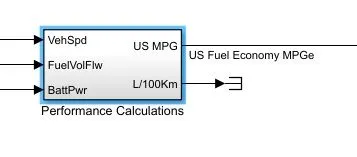
Once you double click on this block, you can see the performance calculations block as below
You can enter into this block by double clicking it to see what it comprises of
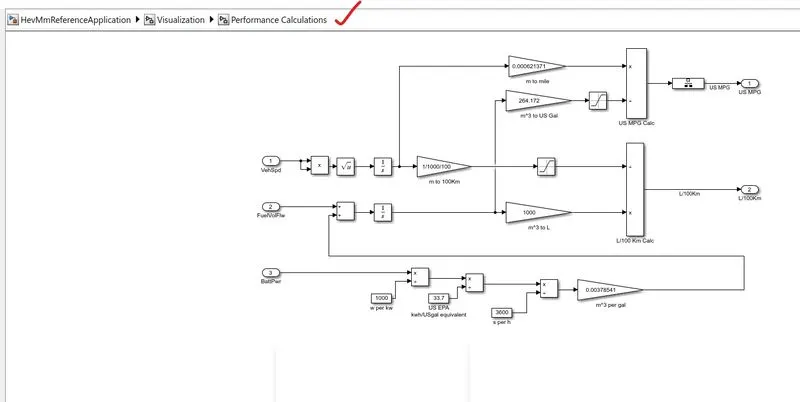
Let us discuss arrangement of this model in brief.
- Speed is read and it is integrated to get value of distance.
- Distance is converted into miles.
- It is divided by the fuel consumption value.
- Now we have two fuel sources, they are used and corresponding conversion of seconds is done.
- Run the HEV ReferenceApplication with WOT drive cycle. Change the grade and wind velocity in the environment block. Comment on the results.
Solution:
HEV Example Link: https://in.mathworks.com/help/autoblks/ug/hev-multimode-reference-application.html
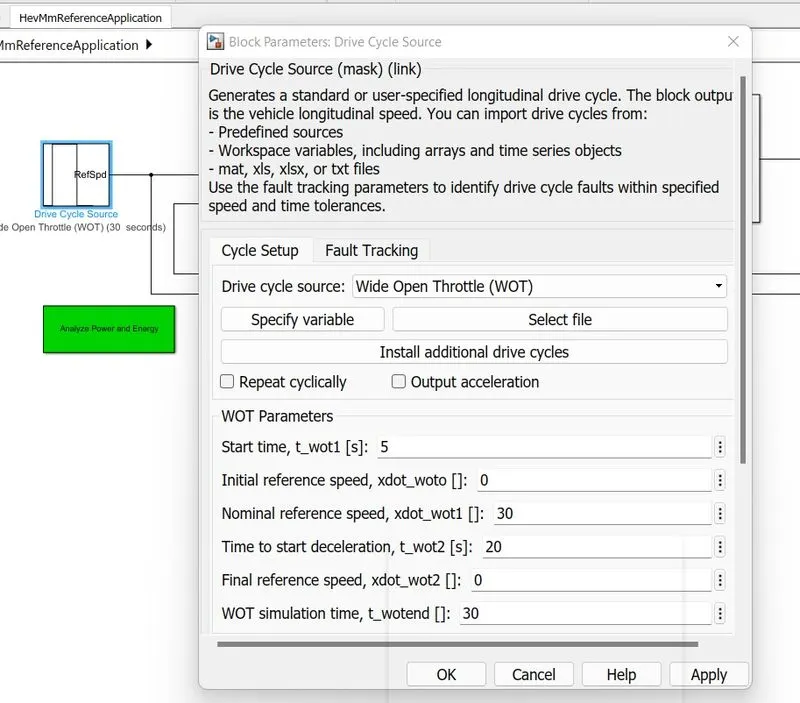
First of all it is necessary to change the drive cycle. To do so, double click on the drive cycle input block, select Wide Open Throttle cycle, keep the parameters by default and click apply and then ok.
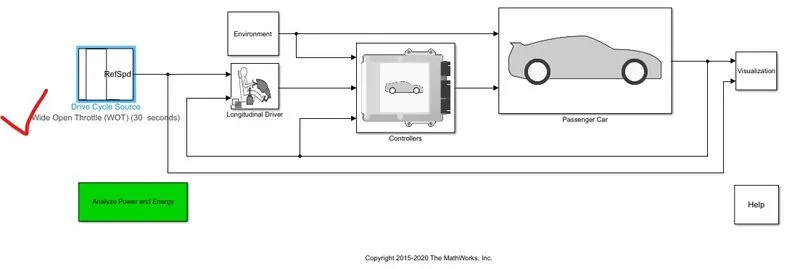
We have changed the input drive cycle as ‘wide open throttle’ now run the simulation for 100 seconds, it will take a while for the file to simulate. Once simulation is completed, output plot screen will open.
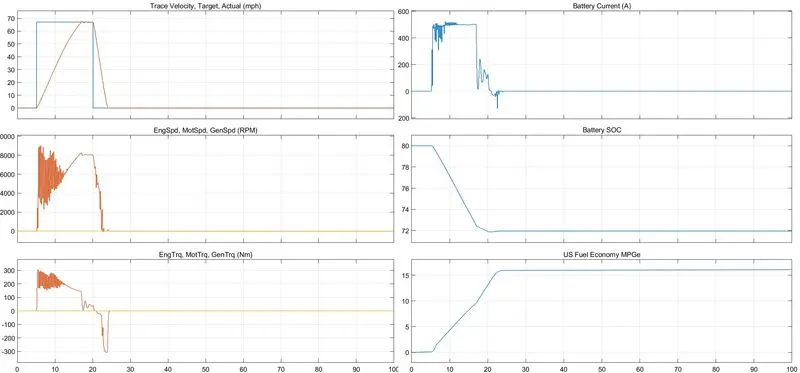
Now in the next part of question it is asked to change the grade and wind velocity in the environment block and check results.
Let us change the grade and wind velocity first. As we open the environment block, it can be seen that the wind velocity and grade are zero by default. Let us make some changes in their values.
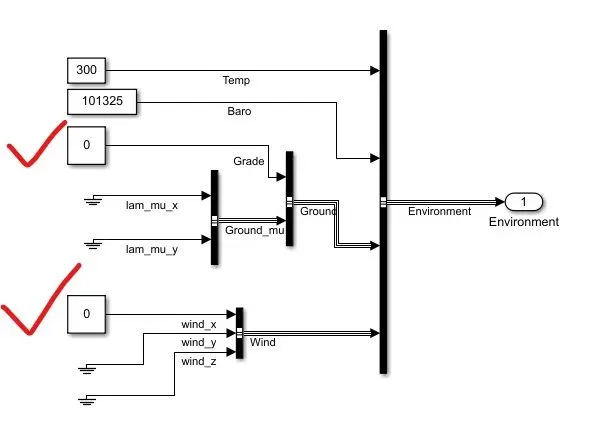
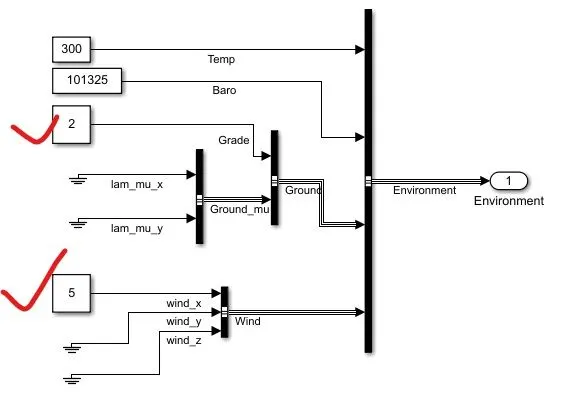
Let us run the simulation now,
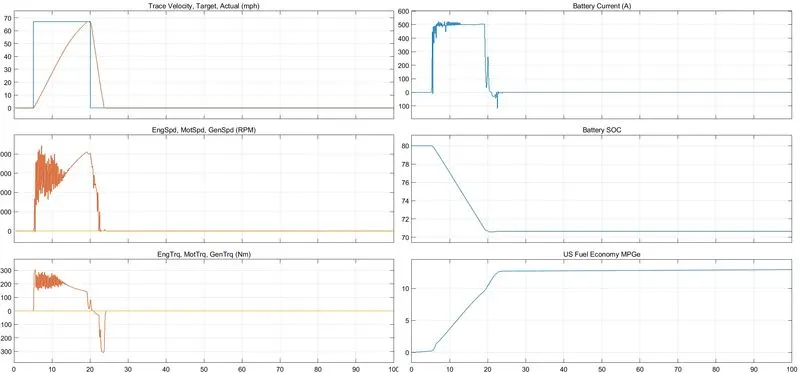
It can be seen from the comparison of above plots is that, the battery current varies little bit with the changes in the grade and wind velocity, also the SOC gets changed, rest of the plots are almost similar.
- Keeping all other parameters same, compare the simulated results of hybrid and pure electric powertrains.
Solution:
Here are the links for both the models:
- HEV Example Link: https://in.mathworks.com/help/autoblks/ug/hev-multimode-reference-application.html
- EV Example Link: https://in.mathworks.com/help/autoblks/ug/electric-vehicle-reference-application.html
Let us first open the HEV example
Keeping all the parameters by default, let us run the model and see the output plot.
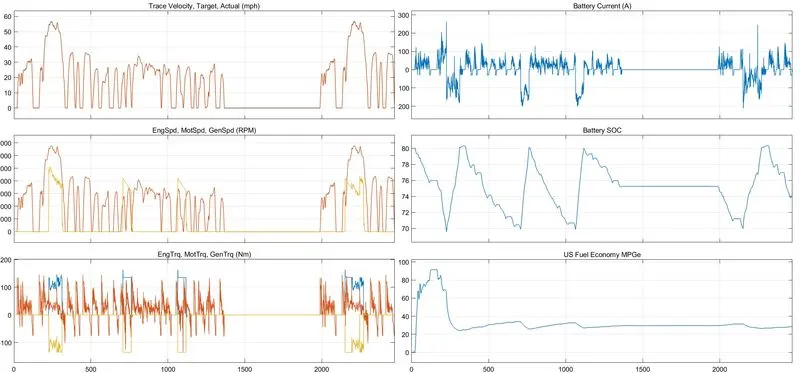
Next, let us open the EV model,
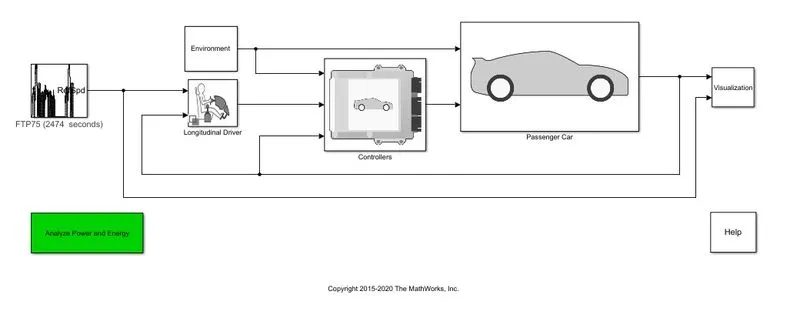
Let us run this model by keeping all the parameters by default.
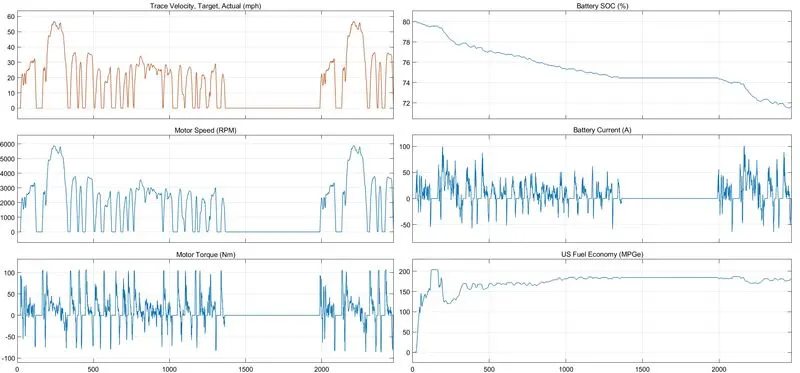
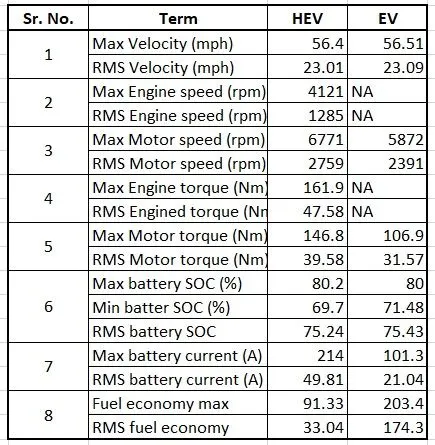
After a detailed analysis, following comparison table can be prepared to get an overview of both HEV and EV at a single glance.
Conclusion:
- Difference between mapped model and dynamic model explained.
- HEV model is run, output values are checked, wind velocity and grade has been varied, its effect on output analysed.
- HEV and EV models are run with default values and their outputs are compared.