Week-4 Challenge WOT Condition Part-2
Question 1
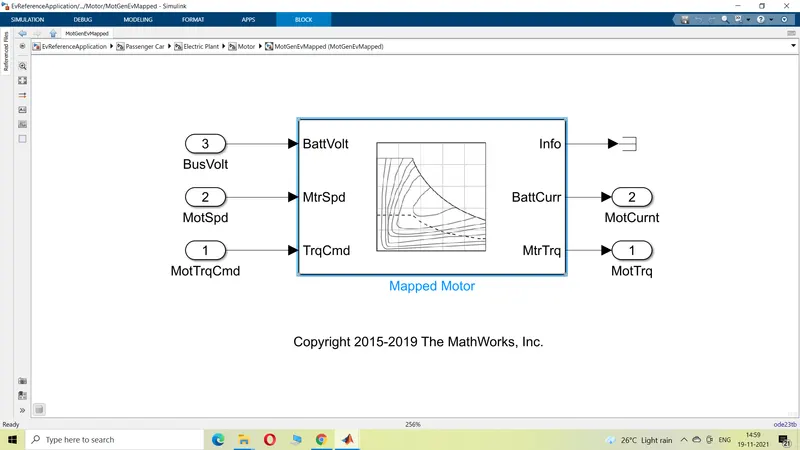
Mapped Motor
in this system the inputs are given from motor speed, motor torque and battery voltage.
and outputs results are battery current and motor torque,by looking up the model layout it the result are given through the help of lookup table.
-drive electrinics through torque control mode
-it is a fast level simmulation
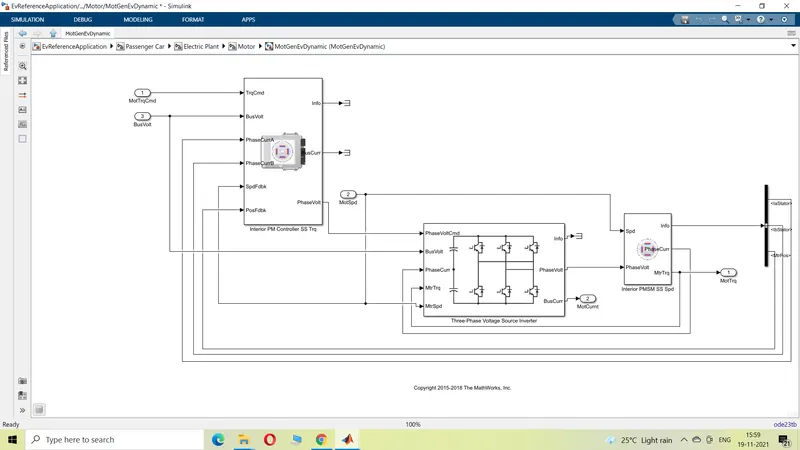
dynamic motor
-inputs are based upon output
-slow simulation as it is a real time simulation
-more accurate as compare to mapped
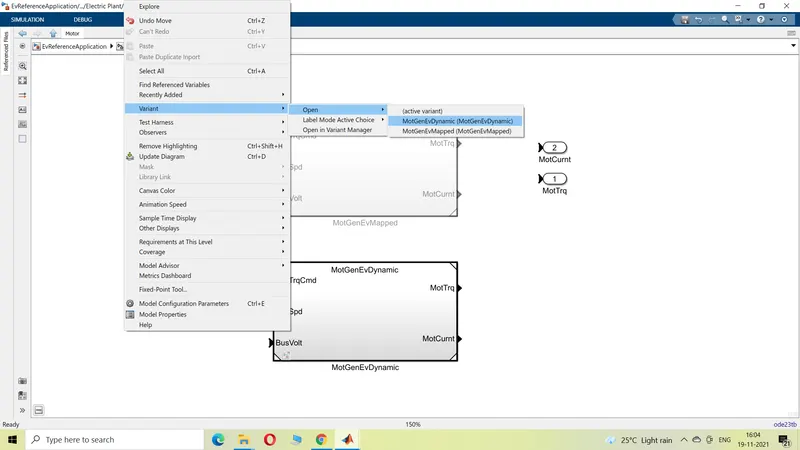
how to change the type of the block?
go to the model >go inside the passengervehicle blocl>then go inside the electric drive train block.>right click on the white area and refer the image.
question 2
Please refer to the image for ,mile per gallas
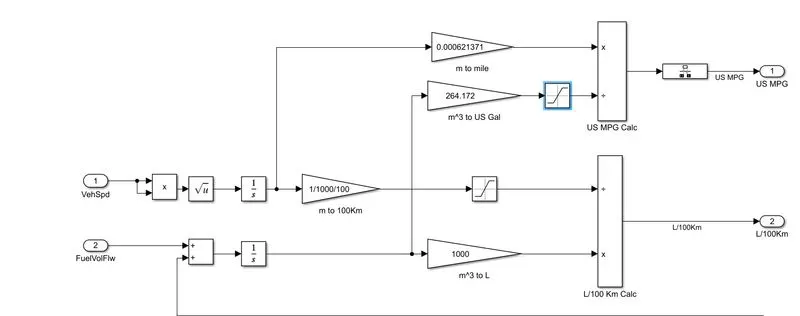
From the image you can see the integer has been taken of fuel volume flow ,from the inport block.
to convert it to litre a gain block is used in which the value is given 1000 for m^3,
the same data is aslo multiply by 264.172 to convert it to US gallon ,same data is trasnfer through saturation block it is aslo multiply by vehile speed paramters. vehile speed paramter are also converted to to the requried convertion of the unit to get the result in Per gallons mile .
battery power conversion (refer image)-

input is coming in watts that is converted into kilo watts ,to again convert it in US EPA KWH iit is further diveded by 33.7
to get the value in seconds per ,it is diveded by 3600 (1 hour contains 3600 seconds).
Question 3
WOT for Hybrid Electrical vehical ,in which Enviormental value ,wind and hill climbing angle are 0
the cycle runs for 60 sec.
(refer the graphs)
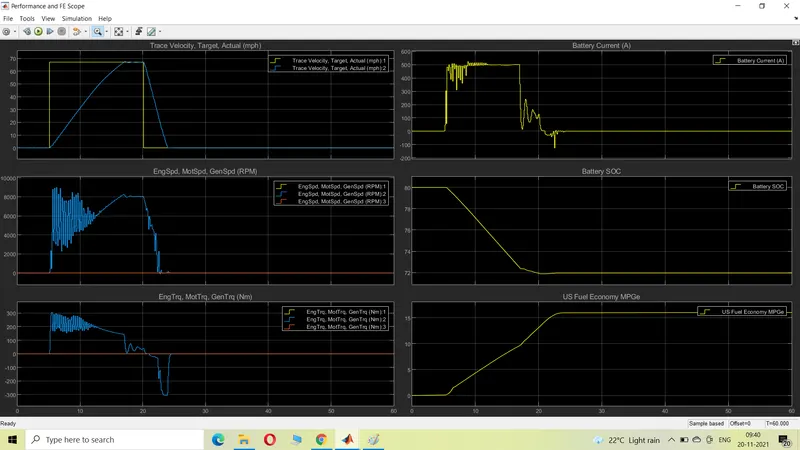
Graph1 (left side top most)- it is a velocity graph in which we can see the the actual velocity is trying to achive the target velocity,it is achive at 68 mile per h ,for 4 sec approx,there is sudden drop in velocity after the target velocity is achived.
garph 2- its a Engine MOTOR RPM,we can see a lot of flucuations in it because the engine is trying to achive max. RPM
graph3- its a torque related graph in Nm,there are flucuations in the graph, after acheving the target speed the torque slowly becames zero,
and goes into negative .
graph 4(right top most)- battery AMP while in WOT the batter gives its max amp current , once the target speed is acheived the current taken from the battery becomes less, it also goes in negative it meanes there is regerative braking is to appreaed.
graph 5 - battery STATE OF CHARGE (Soc),it operates between 80 to 70 but does not drop below 71.
graph 6- US fuel in mile per hour,after the certain limit the fule is constant ,when the target speed is achived.
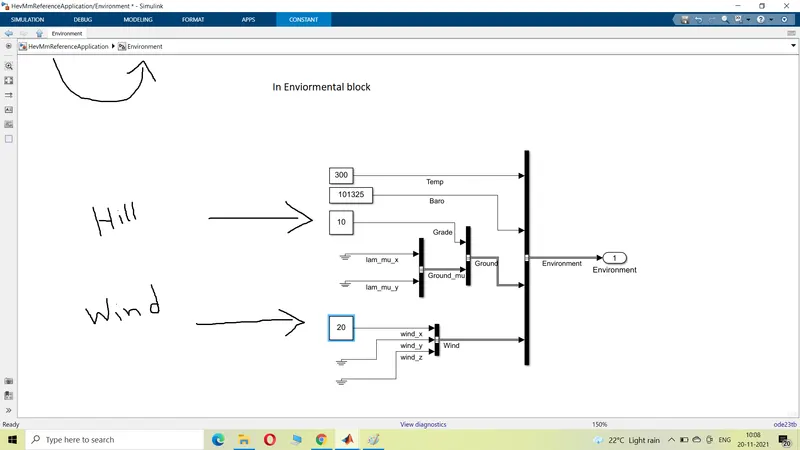
When the enviormental value like wind and hill angle are change in this cycle, wind =20 hill angle =10,(refer the image)
results -
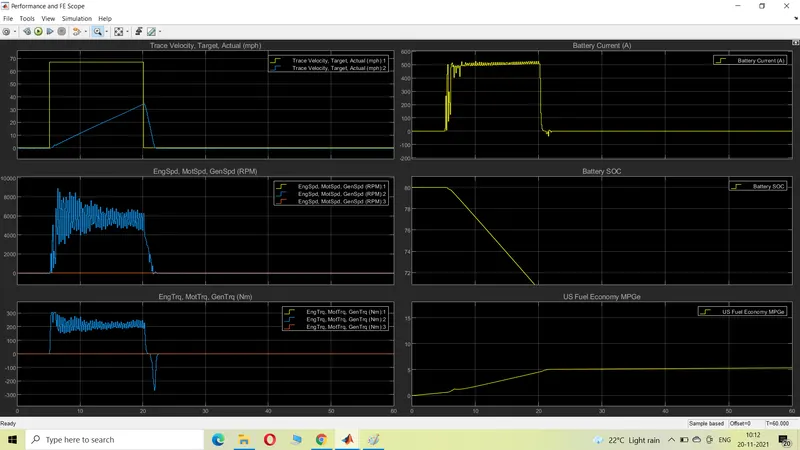
vehile cant acheive the target speed
more fluctuations in engine RPM and Torque observe the graph.
battery taking to much current as compare to normal one .
battery Soc drops below 70 as its taking more power from the battery
mile per hours becomes very less due vehicle climbing the Hill.
Question 4
{go to maths works site search for the HEV referance application , copy the command ,and paste the command in the command window of the matlab software and run the simulation for the resulst, same follow for the EV referance application.}
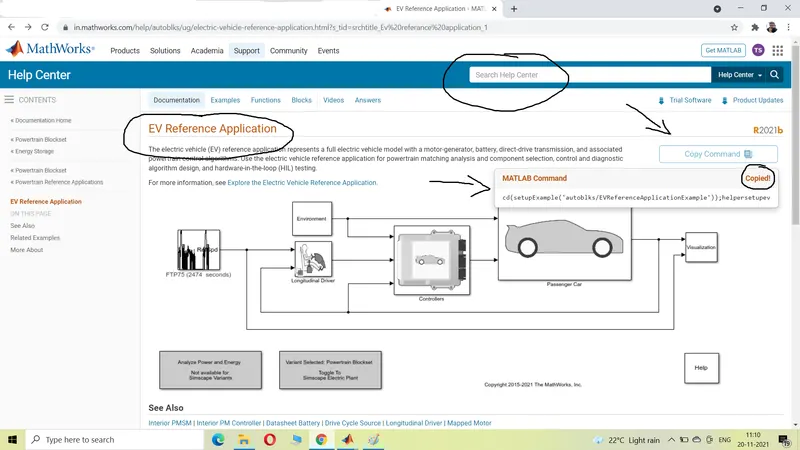
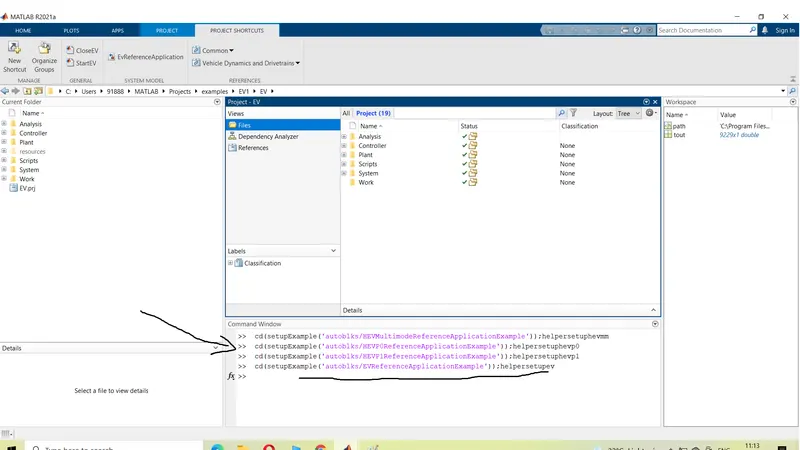
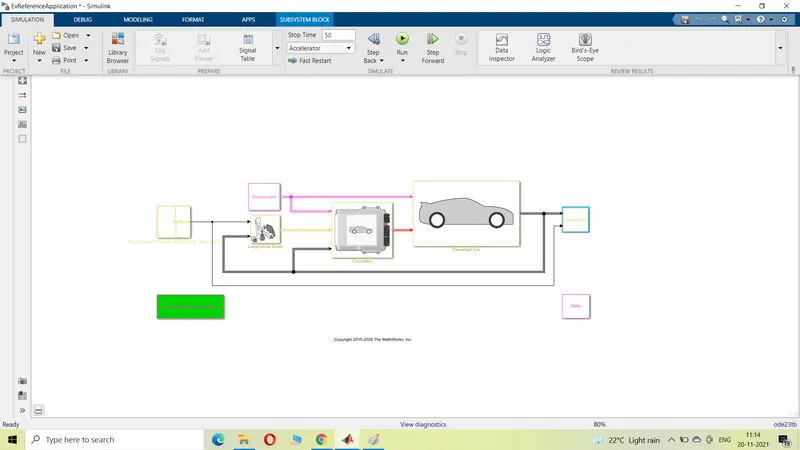
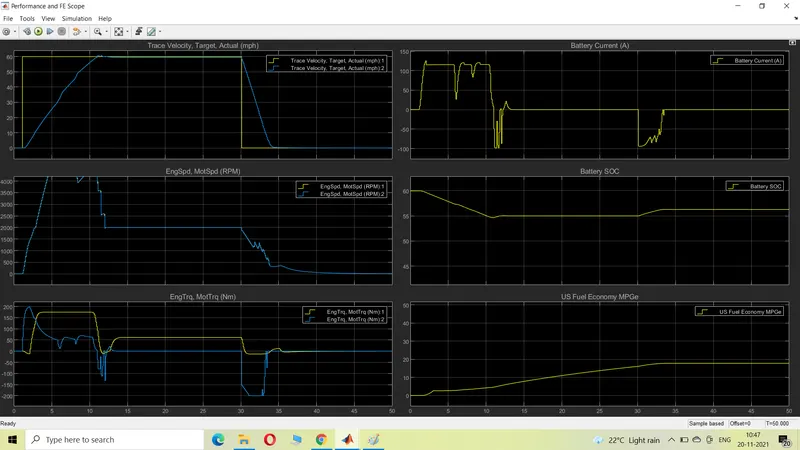
Below are the result of the HEV AN EV Vehicle Running for the WOT cycle, for 50 seconds.
graph for HEV
graph for EV vehicle
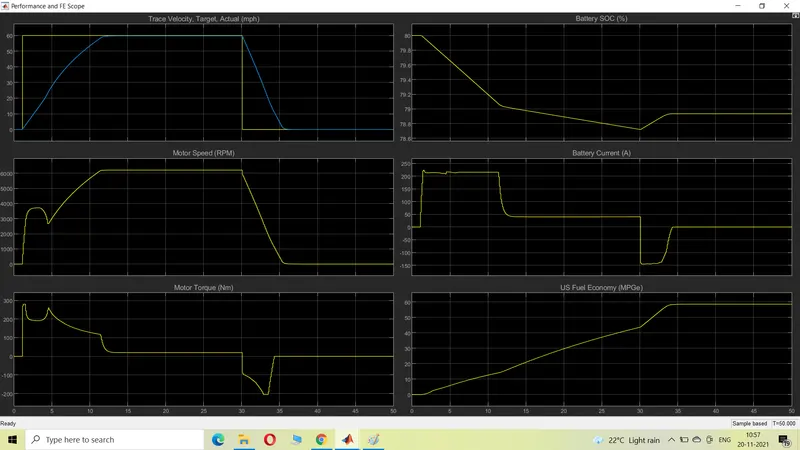
Observations-
HEV takes the power from engine motor and gnerator while Ev only takes the power from the battery to run the motor .
Torque in the HEV has more flucuations as compare to EV ,
ENgine RPM of the HEV is varing while there is a smooth working in the EV motor.
in the HEV there is the rise and fall int he battery current bcz there is aslo a engine to provide the power, while there is a onlya fall in the battery of the EV vehicle Bcz the battery is only power source in EV
as compare to the miles per hour the EV has more efficicency than the HEV .