Week-4 Challenge WOT Condition Part-2
OBJECTIVES :
- What is the difference between mapped and dynamic model of engine, motor and generator? How can you change model type?
- How does the model calculate miles per gallon? Which factors are considered to model fuel flow?
- Run the HEV ReferenceApplication with WOT drive cycle. Change the grade and wind velocity in the environment block. Comment on the results.
- Keeping all other parameters same, compare the simulated results of hybrid and pure electric powertrains.
AIM : 1.What is the difference between mapped and dynamic model of engine, motor and generator? How can you change model type?
To change model type from mapped to dynamic or dynamic to mapped:
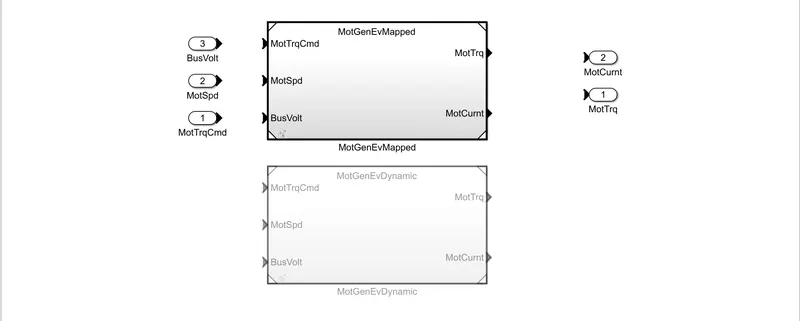
After entering into passenger block > electric plant > motor will get this first window where MotGenMapped is by default selected as a model type for motor
To change from MotGenEvMapped to MotGenEVdynamic first we open our reference model into MATLAB here choose EV as an example
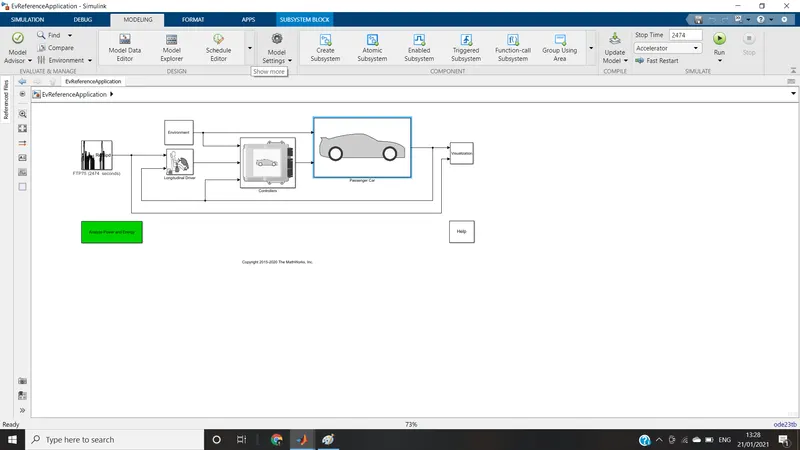
then after clicking on the modeling selection and after in the design block select the variant manager option after the varient manager window gets opened
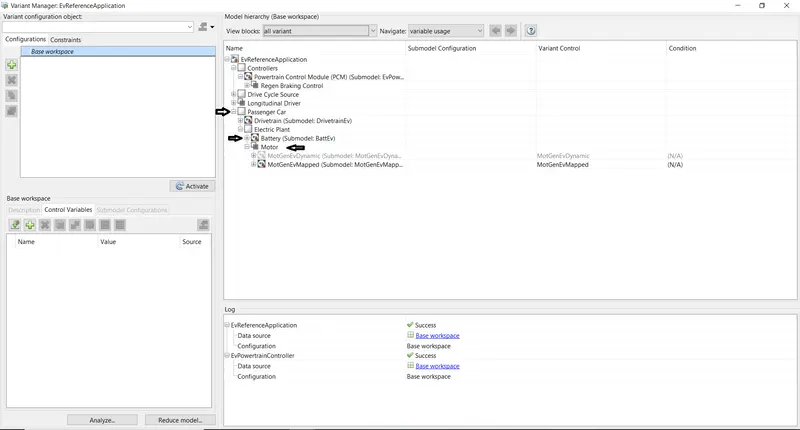
Then by clicking on the passenger car expand option there will electric plant will expand that too in that get both battery and motor. Take motor as a example so after expanding the motor option we will get
1) MotGenEVdynamic
2)MotGenEVmapped
so the default one is MotGenEVmapped to change into MotGenEVdynamic
We need to right click on our preference amd after that a pop will show up in which we need to select 'set as label mode active choice' and after that our motor variant will be MotGenEVdynamic
same we can do for the battery to. To verify whether its change or not will return to our model and open passenger block>electric plant>motor.
And on clicking we get this window.
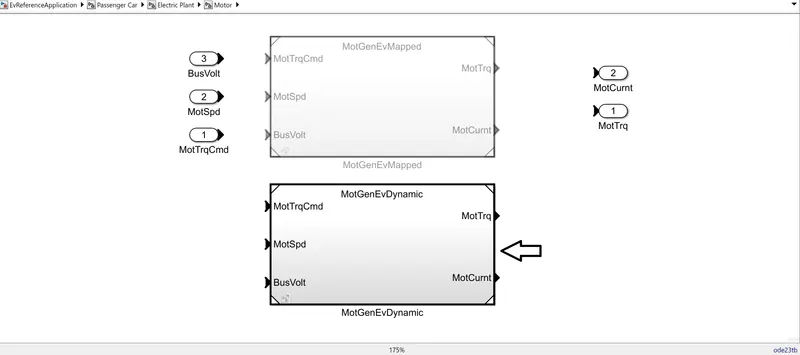
As we can see we changed our variant from MotGenMapped to MotGenDynamic. Same procedure we can do for changing variant from MotGenDynamic to MotGenMapped for both battery and motor. That's how we can change our model type.
AIM 2: How does the model calculate miles per gallon? Which factors are considered to model fuel flow?
The factors considered for indicating the fuel efficiency are mentioned below
(1) Vehicle speed
(2) Battery power
(3) Fuel low
The conversation to miles per gallon and the fuel is as mentioned with steps below
Conversion form cubic to gallon(m^3 to gallon)
As we know 264.172 US gallons is 100L
The reference model taken here for consideration is HEV and as it operates on both the battery and the fuel injection Engine. The final output/Fuel efficiency is calculated by keeping in consideration of the battery output, fuel output and the vehicle speed/kilometers Driven. Therefore the fuel efficiency is calculated and it is converted after the saturation thus the FE is calculated.
AIM 3 : Run the HEV ReferenceApplication with WOT drive cycle. Change the grade and wind velocity in the environment block. Comment on the results.
HEV - WOT Drive cycle input (Data input)
The cycle was carried out for 60seconds.
Performance scope- WOT Cycle
Observations :
- Plot 1 (Trace Velocity target vs Actual) - Though this plot it is denoted that the desired velocity has not been met by actual vehicle velocity. The desired velocity was ranging from desired velocity was ranging from about 140 mph but the actual velocity achieved was near to 110mph
- plot 2 (Engine speed, Motor speed) rpm - This plot gives the detailed analysis for the achieved Engine and motor Speed in rpm. The contribution of both the power generating sources for meeting the required Velocity.
- Plot 3 (Engine Torque, Motor Torque, and Generator torque) Nm - This plot gives the detailed analysis of the engine, motor torque and generator torque
- Plot 4 (Battery current) - This plot denotes the power produced by the battery and the readings are in Ampere.
- Plot 5 (Battery SOC) - This plot denotes the State Of Charge of the battery, this denotes the range of charge used for the achievement of the velocity/
- Plot 6 (US Fuel Economy) MPGe - This is the Fuel efficiency or the range of the drive and the same is denoted in miles per gallon equivalent
WOT Cycle With The changes In Grade And Wind Velocity :
The variables input for the change in these aspects are as given below.
The observations form the results are compared below as follows,
Comments/ Comparison of results obtained
- Plot 1 (Trace velocity vs Actual) - This is clearly visible that as the grade and the wind velocity is increased compared to the normal state the vehicle is not able to reach the target velocity.
- plot 2 (Engine speed, motor Speed) rpm - In this plot comparing with the normal plot the engine speed has reduced to a steep slope on the negative side as compared to the normal situation the grade is increasing the load on the engine and thus the targeted engine speed is not met.
- Plot 3 (Engine Torque, Motor Torque, Generator Torque) Nm - There are multiple variations in all aspects and the same is visible in both the results of Normal and with the grade and Wind velocity.
- lot 4 (battery current) - Battery current has been fluctuating at a higher range as compared to the normal after the vehicle is reaching near to the steady peace fluctuation starts and is simulated.
- Plot 5 (Battery SOC) - The battery State Of Charge remains more or less similar in both the cases and are resulted at 65% after the end of WOT cycle.
- Plot 6 (US Fuel Economy) MPGe - The average fuel economy differ in the range of 6 and 9 mph in both scenarios.
AIM 4 : Keeping all other parameters same, compare the simulated results of hybrid and pure electric powertrains.
Below mentioned vehicle is simulated for EV reference
The Performance and FE results obtained are as follows,
Below mentioned vehicle is simulated for HEV reference
The Performance and FE results obtained are as follows,
REMARKS : The overall difference in both these simulations are their vehicle operations where the EV is completely operated based on Battery as the power source and on the other hand the HEV has two power sources SI/CI engine Battery. The results obtained are varied and the parameters are also differentiated accordingly.