Week-4 Challenge WOT Condition Part-2
1.
Difference between Mapped model and Dynamic Model of Engine, Motor and Generator.
Mapped Model:-
- The mapped model is one type where the data points are pre-assigned in lookup tables.
- The engine or motor torque required is sensed and the motor or engine block generates the required torque output just as required simply without considering the real-time motor or engine, parameters.
- The output values are stored for the corresponding given input values of the engine. motor and generator.
- The accuracy of this type is not that high but the simulation will be done in much less time as it does not run by real-time parameters.
Dynamic Model:-
- The dyanamic model in other hand uses the combination of the outputs from various subsystems to generate the output.
- It runs by real time simulation where the required input from the drive cycle is taken and for that individiual real time simulation gets performed and summing all the results of the subsystem gives the output for the simulation.
- As per the drive cycle requirements the initial Bus voltage ,current is given along with the vehicle feedback so that it runs the actual simulation at that particuclar moment throught the drive cycle.
- The accuracy of this model is very high as it considers the real outputs from all the subsystem to generate the output.
- The simulation will take very long time to complete as it has so many individual simulations running by all the subsystem of the engine , motor/generator.
- The figure below shows the working phase of the dyanamic model.
2.
Miles per gallon:-
Miles per Gallon is a fuel economy rating determined by how far a car can travel on a gallon of petrol or Diesel for an Engine powered car.
In the case of an electric vehicle, it tells us the energy which is equivalent to that of an engine-powered car to propel the car through a distance.
The amount of Fuel Energy required to move an engine-powered car through a distance is determined and then it is compared to the equivalent amount of electric energy required to move the car through the same distance and is expressed as the miles per gallon.
Factors that are considered to model fuel flow are:
1.Vehicle speed & Fuel flow:-
- Vehicle speed is an important factor while considering the fuel consumption at that particular time, so to determine the fuel consumption throughout the drive cycle.
- To convert speed to Distance we can Integrate with time and we are doing the same of converting the velocity to get distance covered by integrating.
- Then the Fuel flow is expressed as the mass flow rate (i.e) the amount of fuel at each moment in Kg/Sec. Now integrating this will result in the mass of the fuel and by using this 1/(1000*0.739) we convert it to the volume and multiply by 1000 to get it in Litres.
- By comparing the two results we can get the amount of liter consumed to Run for 100km.
2.Battery Power:-
- The amount of energy from battery power required to propel the vehicle Equivalent to that of the Engine is calculated here.
- The battery power is given in watts and it is converted to Kw by dividing with 1000.
- Then we convert the Energy from kWh to equivalent energy in US gallon of automotive gasoline by dividing with 33.7.since we get the energy in US Gallons equal in KWh we are trying to get the energy of equivalent US Gallons per seconds and we do this by dividing with 3600 and we convert the hour to seconds.
- Then multiplying with 0.00378541 we convert the US Gallons per sec to the volume of the fuel flow in (m^3/ s) and then we multiply with 739 (California Phase II Gasoline density) (i.e) m^3/s * kg/m^3 which gives the result as mass flow rate kg/s.
- Then finally the Battery energy equivalent in kg/s is given as an input for the fuel flow parameter in order to find the equivalent US Gallons energy and estimate the Miles per Gallons.
Calculating Miles per Gallon:-
- The inputs from the vehicle speed (i.e) the Distance we found (in meters) are taken into the calculation and it is converted to the miles by multiplying with 0.000621371.
- Then the inputs from fuel flow (Battery energy + Fuel energy) taken in m^3 and are converted into equivalent US Gallons by multiplying with 264.172.
- Then the two inputs Miles covered and equivalent US Gallon are further divided and the result is got in Miles / Gallon.
3.
HEV Reference Application:-
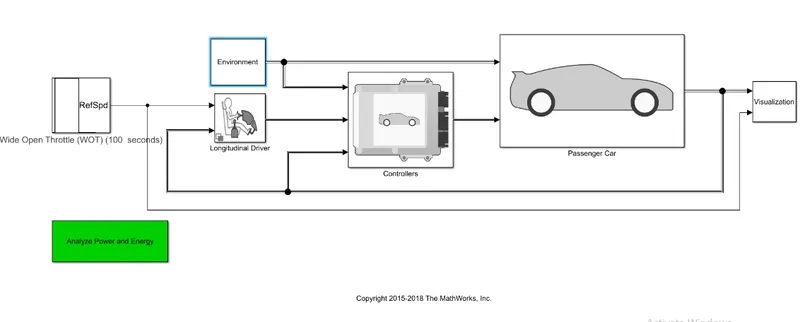
Simulation of HEV Reference Application without changes in Environment blocks:-
In Drive cycle source block source is changed to Wide Open Throttle(WOT) and change the required parameters.
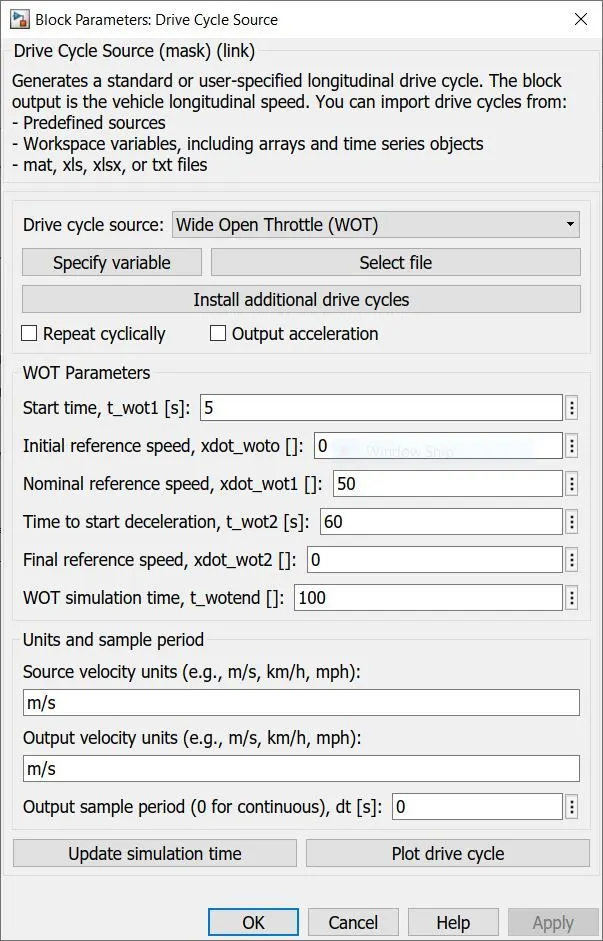
As we made WOT simulation time as 100sec, we change the stop time to 100sec and Simulate.
OUTPUT:-
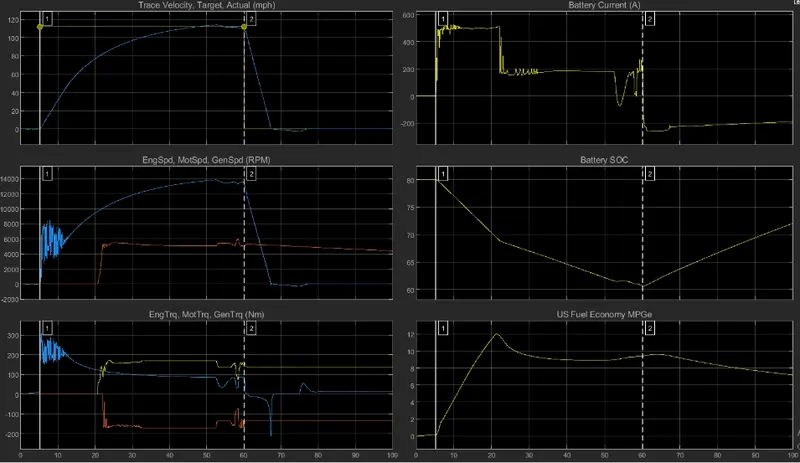
Output consists of 6 plots.
Plot1:-Target speed vs Actual speed in mph.
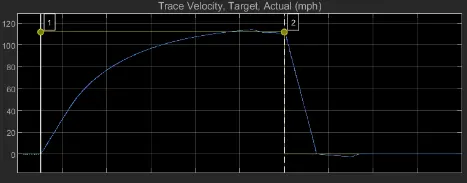
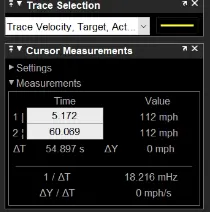
The top speed of 112 mph was achieved in 54.8 seconds.
The deceleration from 112 mph - 0 mph was achieved in 7 seconds.
Plot2:-Speed curve of engine , motor speed and generator speed.
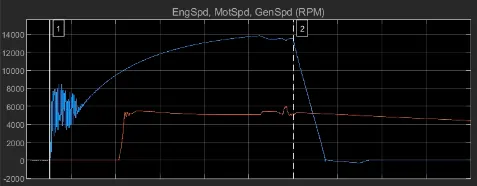
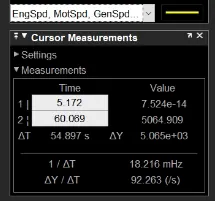
This shows the speed of the engine, motor and generator at various points.
Max motor is 13500rpm.
Plot3:-Torque curve of engine, motor and generator in N-m.
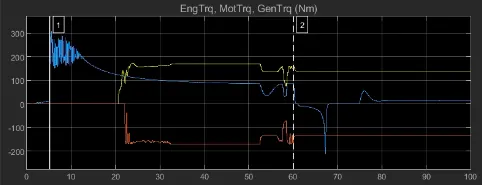
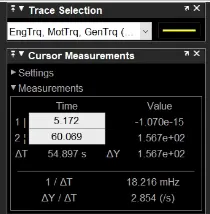
The torque of generator is in negative at 22 sec of the simulation, which shows that the battery is getting recharged.
The torque of engine is reduced gradually as the power increases, due to the speed requirement of the vehicle.
Plot4:-Battery current.
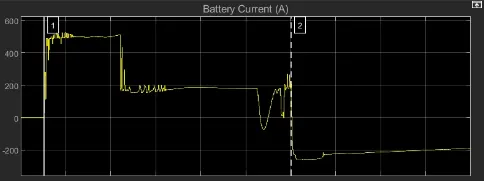
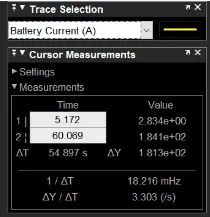
Initially the current required to run the motor is high and reduces when the speed of the vehicle increases.
The motor is used mainly for the starting torque of the vehicle since, the current requirement of the motor is also high.
Plot5:-Battery state of charge.
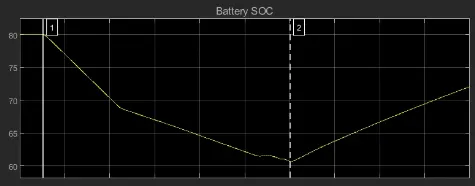
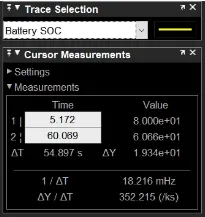
Initially the state of charge is at 80%. At the end of acceleration the SOC becomes 61%. This change in SOC shows the use of motor while acceleration. At 22 sec of the simulation the generator starts recharging the battery. Therefore two different discharging slopes occur during the acceleration of the vehicle.When the vehicle starts decelerating, the state of charge gradually increases as there is no usage of motor and the generator continues to recharge the battery.
Plot6:-Fuel economy.
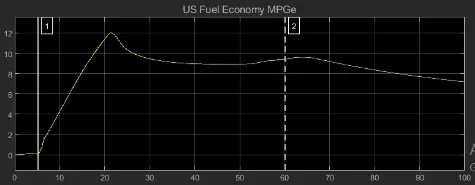
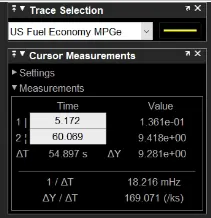
The fuel economy in US MPG which is calculated in the performance calculation block of the model is shown in this plot.The fuel economy was high until the motor was used to accelerate the vehicle. When the power requirement of the vehicle increases the fuel economy decreases respectively.
The maximum fuel economy was 12 MPG.
The minimum fuel economy obtained was 7 MPG.
Simulation of HEV Reference Application with changes in Environment blocks:-
Change the wind and grade parameters in Environment block and keep the other parameters same.
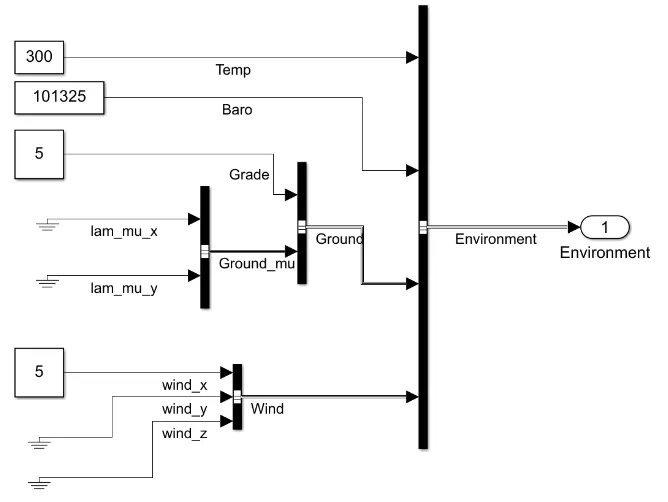
The Grade value is set to 5 degrees.
The Wind velocity is set to 5 m/s in x axis direction.
OUTPUT:-
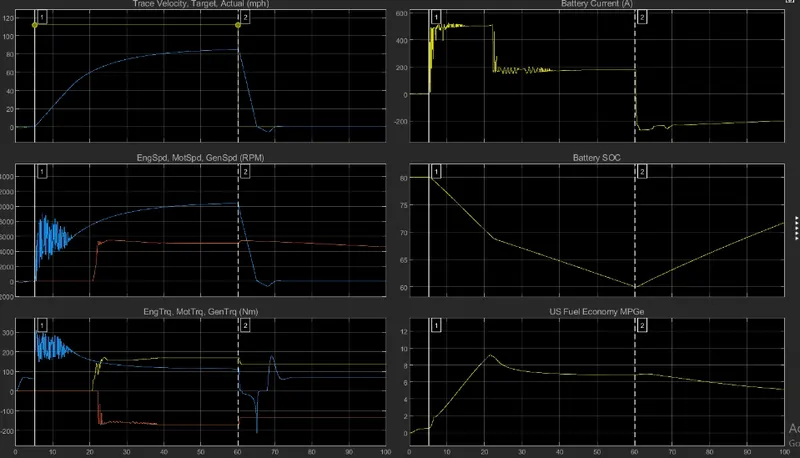
Plot1:-Target speed vs Actual speed in mph.
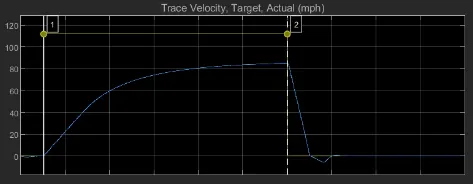
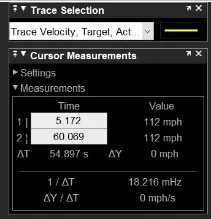
The top speed of 85mph was achieved in 55 seconds.
The deceleration from 85 mph - 0 mph was achieved in 5 seconds.
Plot2:-Speed curve of engine , motor speed and generator speed.
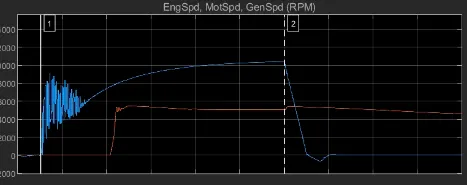
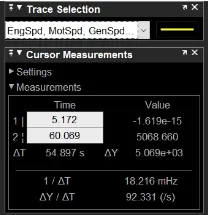
This shows the speed of the engine, motor and generator at various points.
Max motor is 10500rpm.
Plot3:-Torque curve of engine, motor and generator in N-m.
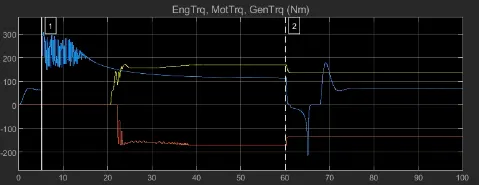
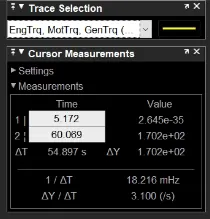
The torque of generator is in negative at 22 sec of the simulation, which shows that the battery is getting recharged.
The torque of engine is reduced gradually as the power increases, due to the speed requirement of the vehicle.
Plot4:-Battery current.
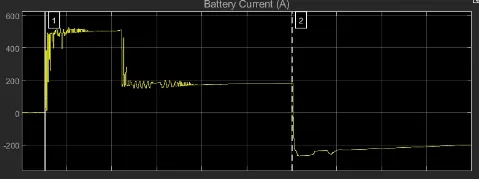
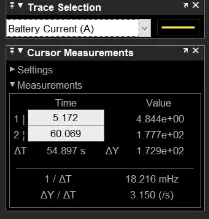
Initially the current required to run the motor is high and reduces when the speed of the vehicle increases.
The motor is used mainly for the starting torque of the vehicle since, the current requirement of the motor is also high.
Plot5:-Battery state of charge.
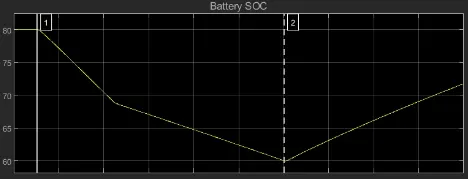
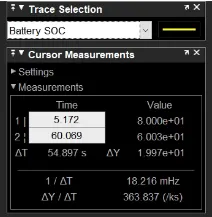
Initially the state of charge is at 80%. At the end of acceleration the SOC becomes 60%. This change in SOC shows the use of motor while acceleration. At 22 sec of the simulation the generator starts recharging the battery. Therefore two different discharging slopes occur during the acceleration of the vehicle.When the vehicle starts decelerating, the state of charge gradually increases as there is no usage of motor and the generator continues to recharge the battery.
Plot6:-Fuel economy.
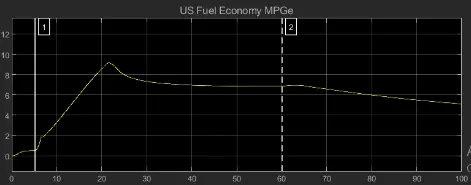
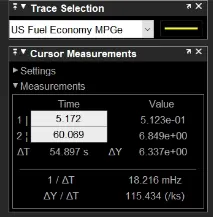
The fuel economy in US MPG which is calculated in the performance calculation block of the model is shown in this plot.The fuel economy was high until the motor was used to accelerate the vehicle. When the power requirement of the vehicle increases the fuel economy decreases respectively.
The maximum fuel economy was 9MPG.
The minimum fuel economy obtained was 5 MPG.
Comparison of HEV WOT without and with changes in Environment block:-
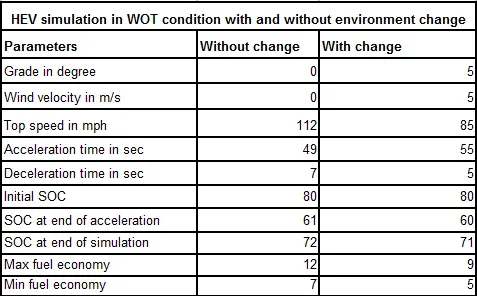
Comparison of HEV WOT without and with changes is shown in a table below:-
Conclusion:-
From the above comparison we can conclude that when there is wind and grade values are increased,
- Fuel efficiency is decreased.
- To reach High speed time takes longer.
- Deceleration time decreases.
- Top speed decreases.
- SOC decreases.
4.
Pure EV Reference Application:-
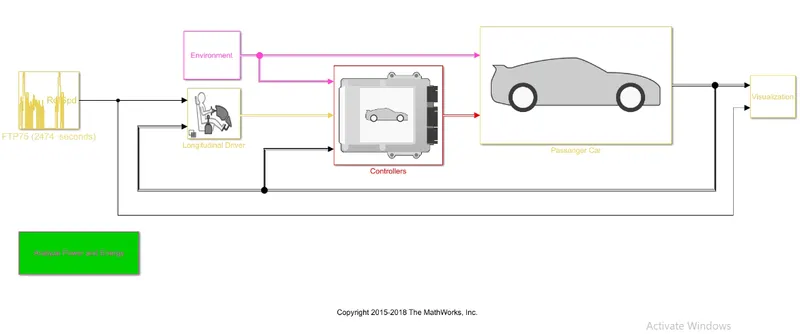
Simulation of Pure EV Reference Application without changes in Environment blocks:-
In Drive cycle source block source is changed to Wide Open Throttle(WOT) and change the required parameters.
As we made WOT simulation time as 100sec, we change the stop time to 100sec and Simulate.
OUTPUT:-
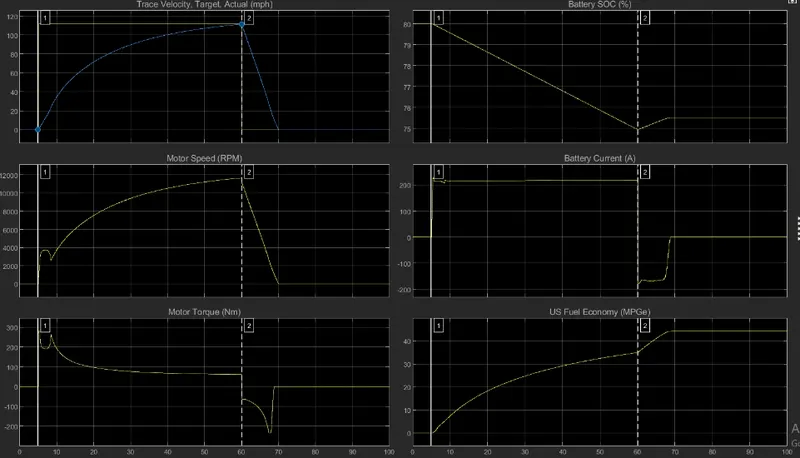
Plot 1 :- Target speed vs Actual speed in mph.
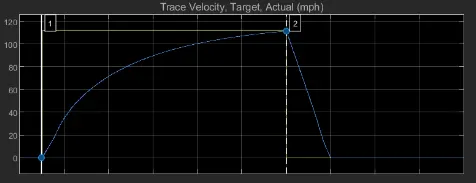
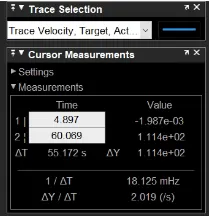
The top speed of 111 mph was achieved in 55 seconds.
The deceleration from 111 mph - 0 mph was achieved in 10 seconds.
Plot 2: - Speed curve of motor
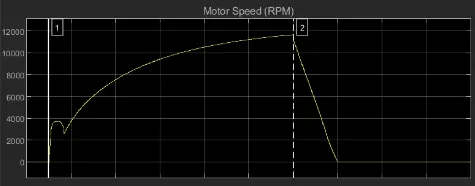
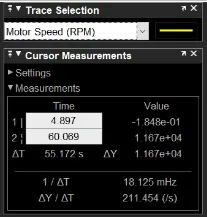
This shows the speed of the motor at various points in rpm.
Maximum motor speed - 11750 rpm.
Plot 3: - Torque curve of motor in N-m
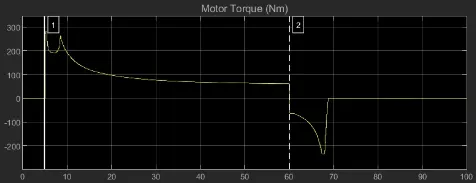
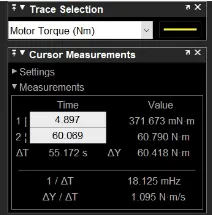
The torque of motor is in negative from 60 sec - 70 sec, which shows that the vehicle is decelerating and the battery is getting recharged.
Plot 4: - Battery current
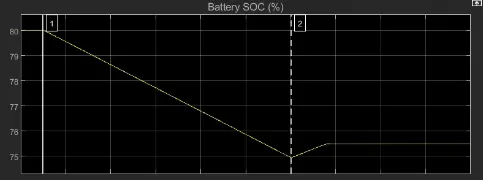
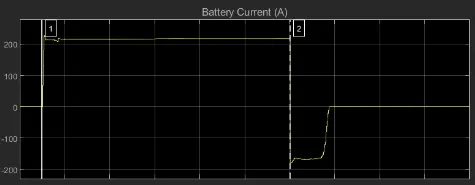
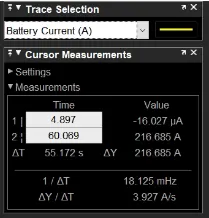
The battery current requirement in the WOT condition for the vehicle was constant until the acceleration of the vehicle stops.During deceleration, the current value goes negative which shows that the battery is recharged during that period of time.
Plot 5 :- Battery state of charge
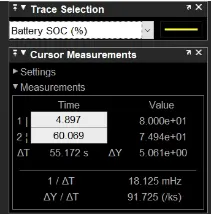
Initially the state of charge is at 80%. At the end of acceleration the SOC becomes 74.94%. This change in SOC shows the use of motor while acceleration. During the 10 sec deceleration period, from 60 sec - 70 sec of the simulation the battery got charged by 0.56%. therefore the SOC at the end of simulation was 75.50%.
Plot 6 :- Fuel economy
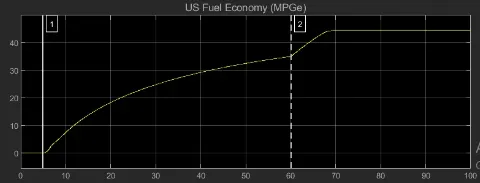
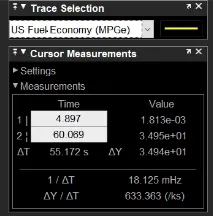
The fuel economy in US MPG which is calculated in the performance calculation block of the model is shown in the plot.
The maximum fuel economy was 45 MPG.
The minimum fuel economy obtained was 35 MPG.
Simulation of HEV Reference Application with changes in Environment blocks:-
Change the wind and grade parameters in Environment block and keep the other parameters same.
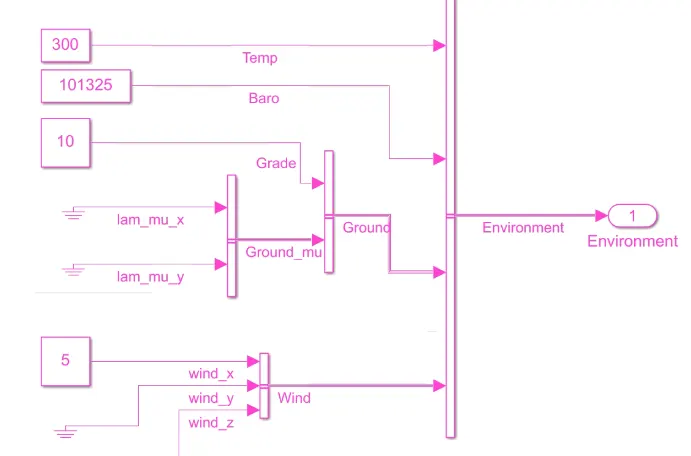
The Grade value is set to 5 degrees.
The Wind velocity is set to 5 m/s in x axis direction.
OUTPUT:-
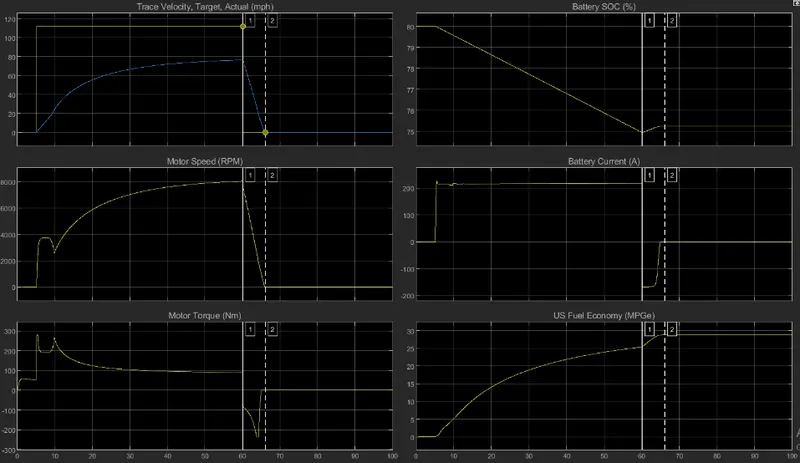
Plot 1 :- Target speed vs Actual speed in mph.
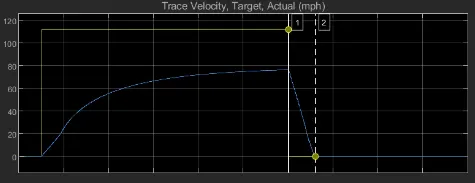
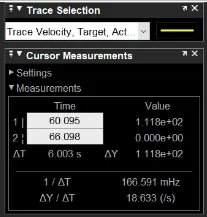
The top speed of 75mph was achieved in 55 seconds.
The deceleration from 75 mph - 0 mph was achieved in 6 seconds.
Plot 2: - Speed curve of motor
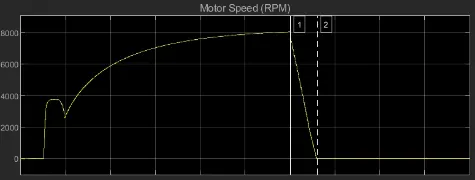
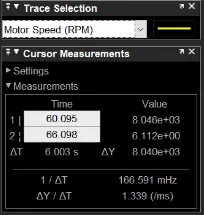
This shows the speed of the motor at various points in rpm.
Maximum motor speed - 8000 rpm.
Plot 3: - Torque curve of motor in N-m
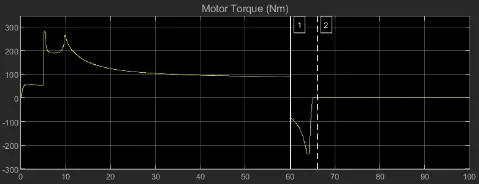
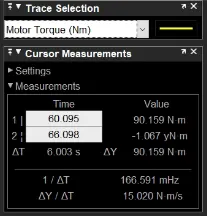
The torque of motor is in negative from 60 sec - 67 sec, which shows that the vehicle is decelerating and the battery is getting recharged.
Plot 4: - Battery state of charge
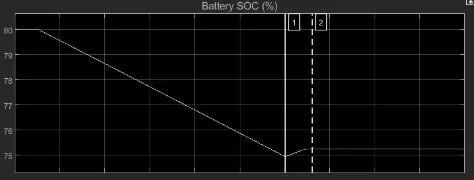
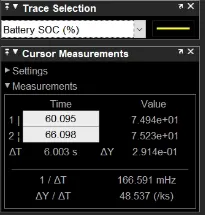
Initially the state of charge is at 80%. At the end of acceleration the SOC becomes 74.94%. This change in SOC shows the use of motor while acceleration. During the 10 sec deceleration period, from 60 sec - 70 sec of the simulation the battery got charged by 0.56%. therefore the SOC at the end of simulation was 75.50%.
Plot 5 :- Battery current
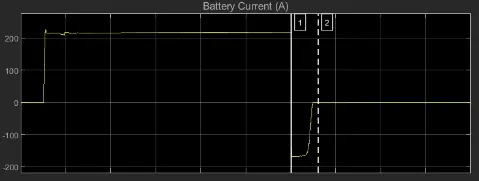
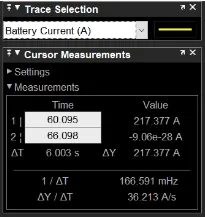
The battery current requirement in the WOT condition for the vehicle was constant until the acceleration of the vehicle stops.
During deceleration, the current value goes negative which shows that the battery is recharged during that period of time.
Plot 6 :- Fuel economy
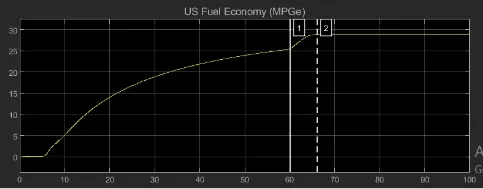
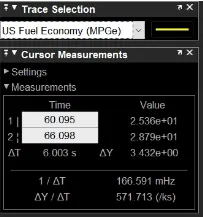
The fuel economy in US MPG which is calculated in the performance calculation block of the model is shown in the plot.
The maximum fuel economy was 29 MPG.
The minimum fuel economy obtained was 25 MPG.
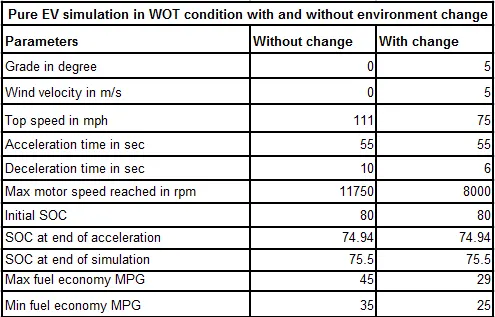
Comparison of Pure EV WOT without and with changes in Environment block:-
Comparison of Pure EV WOT without and with changes is shown in a table below:-
Conclusion:-
From the above comparison we can conclude that when there is wind and grade values are increased,
- Fuel efficiency is decreased.
- To reach High speed time takes longer.
- Deceleration time decreases.
- Top speed decreases.
- SOC decreases.
- Due to high deceleration time, the recharging time of battery is also high.
Comparison of simulated results of HEV and Pure EV Electric Powertrains:-
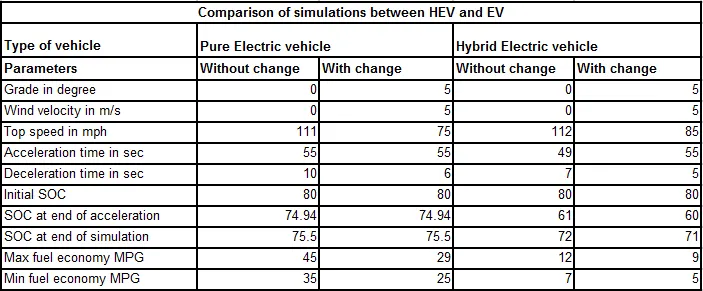
From above comparison we can conclude that,
- HEV with changed environment parameters has the lowest deceleration time.
- Pure EV with unchanged environment parameters has the longest deceleration time.
- HEV with changed parameters has the lowest fuel economy.
- HEV and EV without changed parameters have approximately equal top speeds.
- Initial SOC of all the vehicles are same.
- At the end of acceleration EV has better SOC compared to the HEV simulation.
- SOC at the end of all the simulations is approximately equal.
- HEV has good acceleration time.
- Pure EV without changed parameters has high fuel economy when compared to other simulations.