Week-4 Challenge WOT Condition Part-2
Question-1: What is the difference between mapped and dynamic model of engine, motor and generator? How can you change model type?
answer:
Mapped model- in this type motor or engine torque required are sensed then according to that motor or generator will generate that much torque without any real time parameters. the input parameters are given in the form of lookup tables. time taking for simulation output is very less as it doesnt use real time values & result is also not very accurate. the value given is like array same device with different parameters, we give parameters like rpm, efficiency, torque, temperature, power etc. its not using real time values.
Dynamic model- in this type of model real time values of devices are used for simulation. which give real accurate results and take more time for output result. powertrain system is an example . inputs from drive cycle is taken for real time simulation to be performed & all the subsystem output results in real time output with high accuracy. here feedback from output is again given in input to compare to minimise the difference & increase accuracy.
Steps to change model type-
1. open powertrain system in help option. their we have to select vehicle model hybrid or EV .
2. open its blockset it will look like this, its EV model
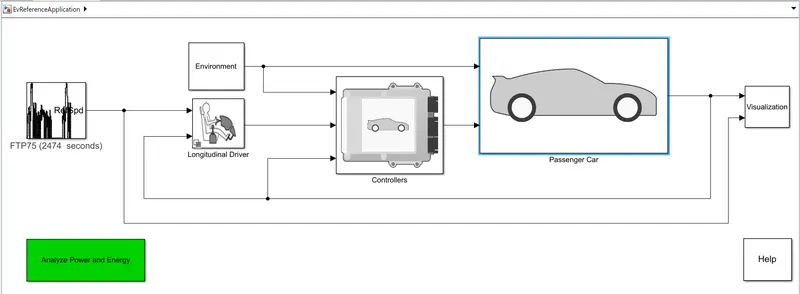
3. open passenger car block
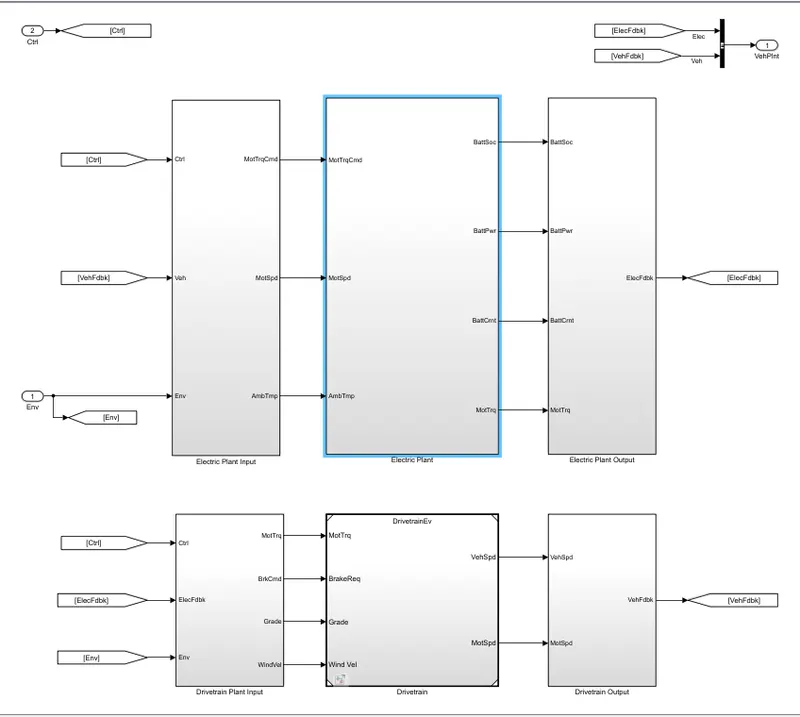
4. open electric plant block
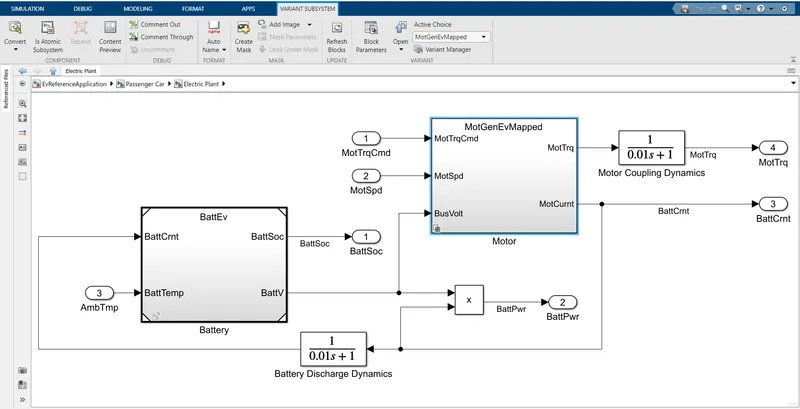
5. we can see motor generator ev mapped model, single click on it, then look on top options we can see varient subsystems, click on it we will see motgenmapped, click on it we will get dynamic option to select. as shown below

Question-2: How does the model calculate miles per gallon? Which factors are considered to model fuel flow?
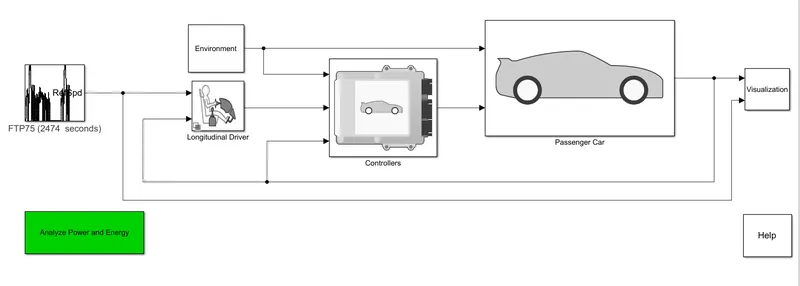
answer: select any powertrain reference application , suppose HEVmultirole it will look like this
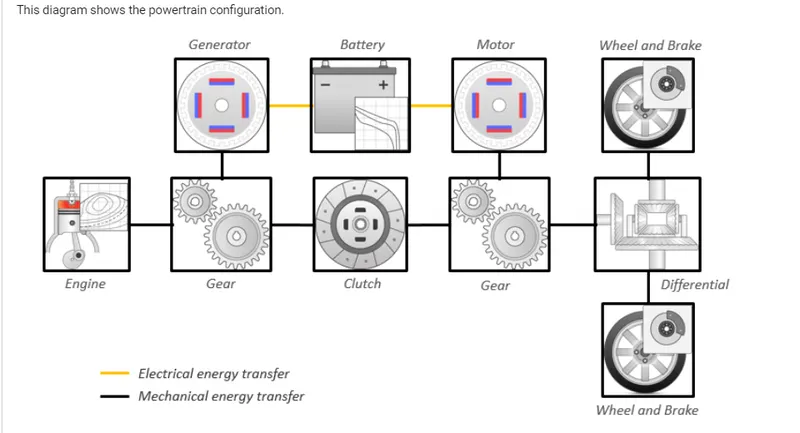
then open its blockset
open visulization block
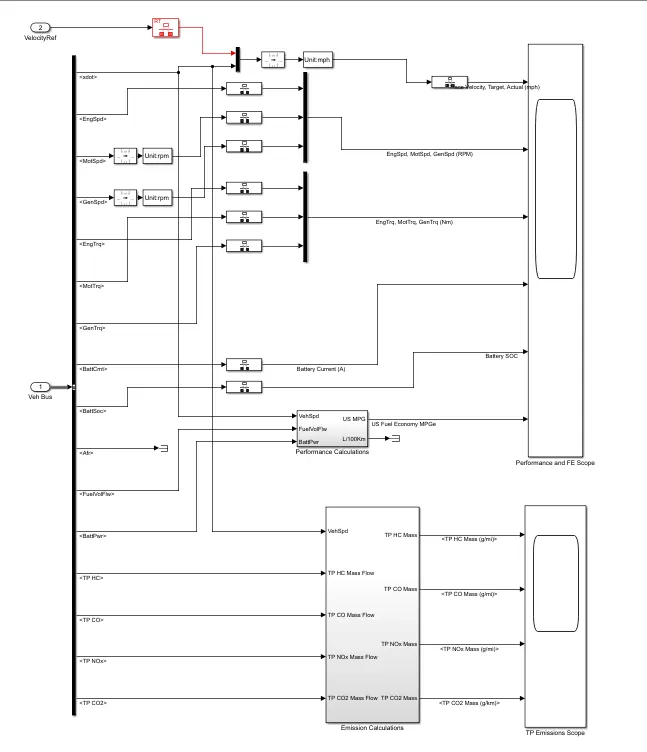
open performance block
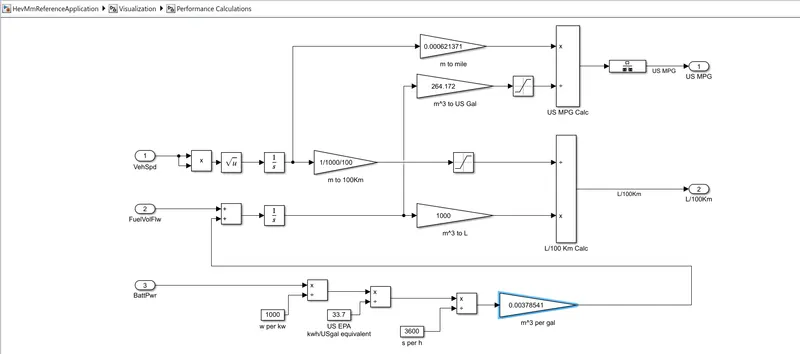
in above subsystem we can see both miles per gallon & fuel flow calculation. for both calculation the factors consider for fuel flow model are vehicle speed, battery power & fuel volume flow.
for miles per gallon, vehicle speed is converted to distance from meter to miles by integrating with respect to time then multiply with 0.000621371 to get miles, then fuel flow & battery power output are added then integrated to get fuel volume in meter cube , multiply with 264.172 to get in us gallon,then divide with vehicle speed to get miles per gallon.
for fuel flow, battery power in watt hour is converted to kilowatt hour then divide by standard constant us epa 33.7 to get kwh/USgal equivalent then divide by 3600 to convert hour in seconds then multiply with 0.00378541 to converrt gallon into meter cube. battery power output & fuel flow is added to integrate, multiply with 1000 to get in liters from m^3, then divide with vehicle speed in km to get fuel flow in L/100 km.
Question-3: Run the HEV ReferenceApplication with WOT drive cycle. Change the grade and wind velocity in the environment block. Comment on the results.
solution: open HEV reference application
then open its blockset
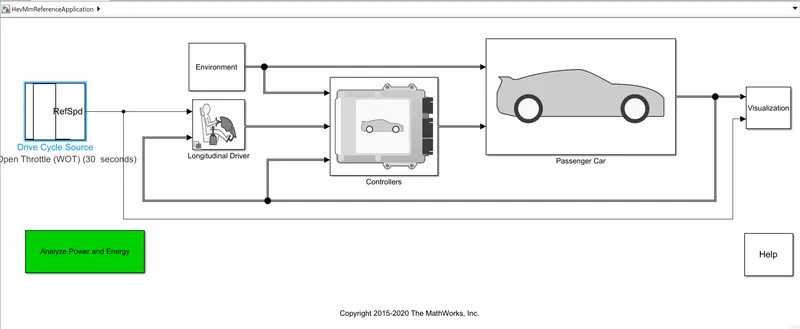
then select the drive cycle to WOT. i have kept run time for 50 sec. for both condition.
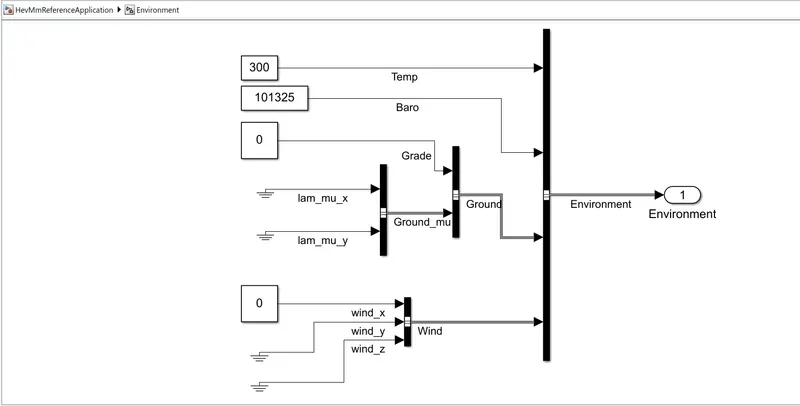
then open environment block, here we can see grade & wind velocity is kept zero.
run the simulation, it will take some time after running successfully open visulization block. then open performance and FE scope.
we will get result in the form of graph.
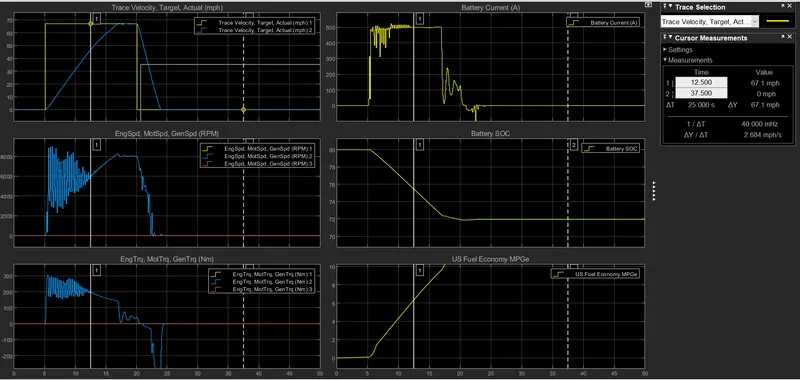
plot-1: here target velocity got 67mph at 5 sec and remain constant till 20 sec duration is 15sec, then it get drop suddenly to zero in 20 sec, remain constant . actual velocity reach the target at 17 sec, drops down at 20 sec slowly got zero at 24sec. it remains constant at target velocity till duration of 3 sec.
plot-2: at 5sec rpm gets increasing to 9000 rpm at 6sec then it goes fluctuating till 23000rpm for duration of 7sec. then it got ramp constantly till velocity reaches its target mph it remains constant till 20 sec then drops down to zero in 22.79sec.
plot-3: heighest torque reach to 300NM at 5sec then it goes fluctuating to 150NM till 12 sec for duration of 7sec. it become zero at 17 sec but go to 70NM fluctuating at 21sec become zero then -300NM at 24sec become zero constantly.
plot-4: at 5sec battery current increase nearly to 500amps then started fluctuating to 300amps till 12 sec for duration of 7sec. then becomes constant for 5sec duration then drops down fluctuating becomes zero at 23 sec constantly.
plot-5: battery SOC is 80 till 5esc when vehicle got accelerated battery discharges uniformly become 72 at 20 sec & become constant 72 after 24 sec.
plot-6: when started at 5sec fuel economy started rising till 23 sec & becomes constant it covers 16MPG during the the process.
now if we change grade & wind velocity in environment block, suppose grade=6 & wind=10 then click on apply & ok.
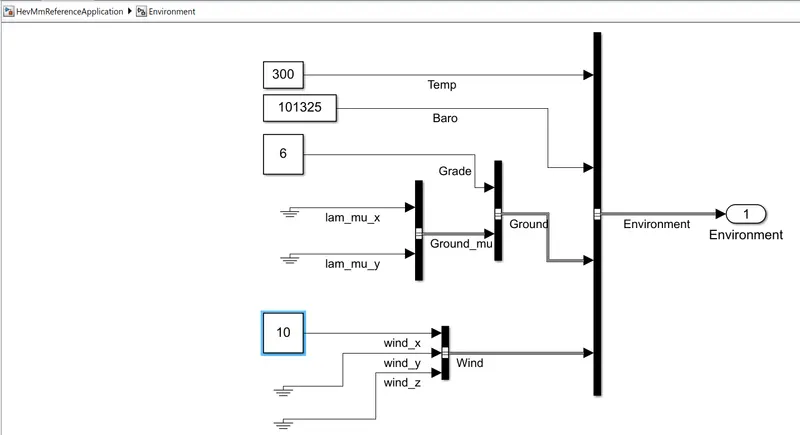
then again run the simulation. open performance& FE scope in visulization block, we will get this result.
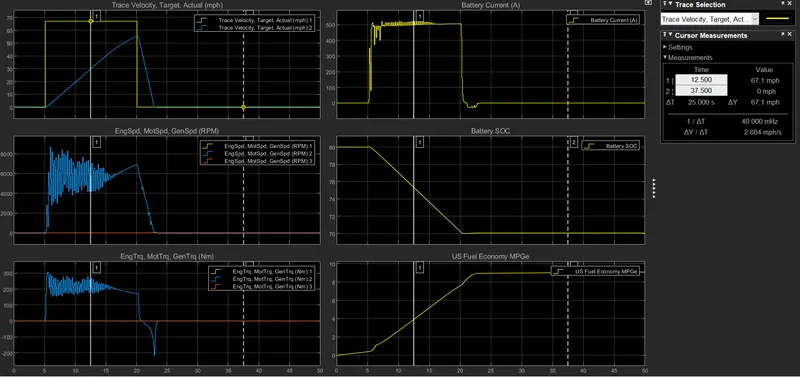
plot-1: in this graph we can see highest target velocity is 67.10 mph & actual velocity achived is 55 mph. at 5 sec the target velocty suddenly achieved the highest velocity & suddenly drop down to zero at 20 sec. but actual mph accelerate gradually increase after 5 sec & at 20 sec it receive its highest mph, then mph drop , got zero at 23 sec.
plot-2: in this graph motor rpm increased after 5 sec reached its highest rpm 8620 and get zero at 23sec.
plot-3: here we can see heighest torque of motor gets to 306NM after 5 sec , then its fluctuating it goes to zero at 21 sec then goes to negative till 210NM got zero at 23 sec.
plot-4: battery current use highest 510 amps till 23 sec its nearly to 500 amps.
plot-5: state of charge started from 80 when velocity stared it getting decrease to 70 in 20 sec as battery got discharge when vehicle stops at 23 sec charge got constant at 70 .
plot-6: for starting 0.35 mpg use till 5 sec, then its velocity got icreased its fuel got increasing till 9mpg till 23 sec.
link:- https://drive.google.com/file/d/18PQ3U0BHddLqncI9eL_Pmvn7iU4fRXPV/view?usp=sharing
Question-4: Keeping all other parameters same, compare the simulated results of hybrid and pure electric powertrains.
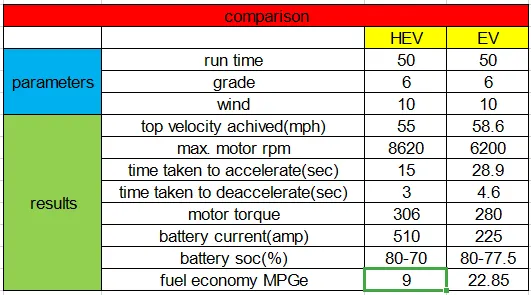
answer: here we select the drive cycle as WOT, taken grade value as 6 & wind value as 10 in environment block & run time is 50sec for both HEV & EV simulation.
for HEV, procedure is same as answer no.3 , so result is shown below
for EV, select EV powertrain reference application
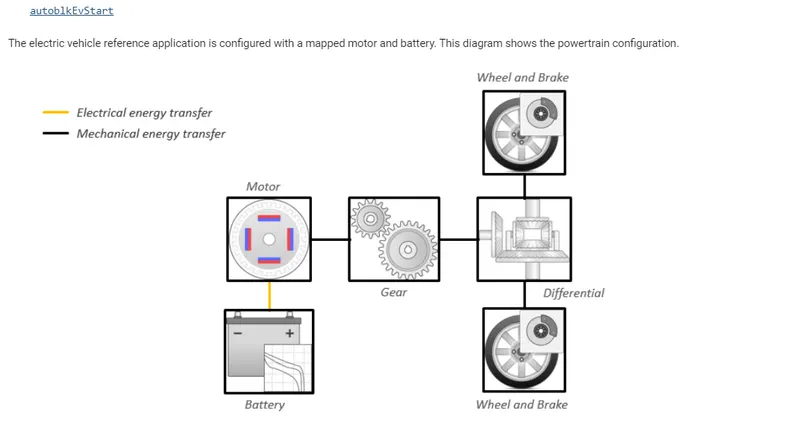
open its blockset
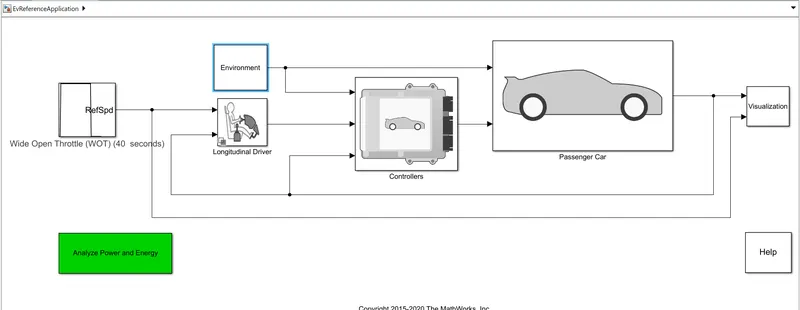
WOT drive cycle is selected, then open environment block
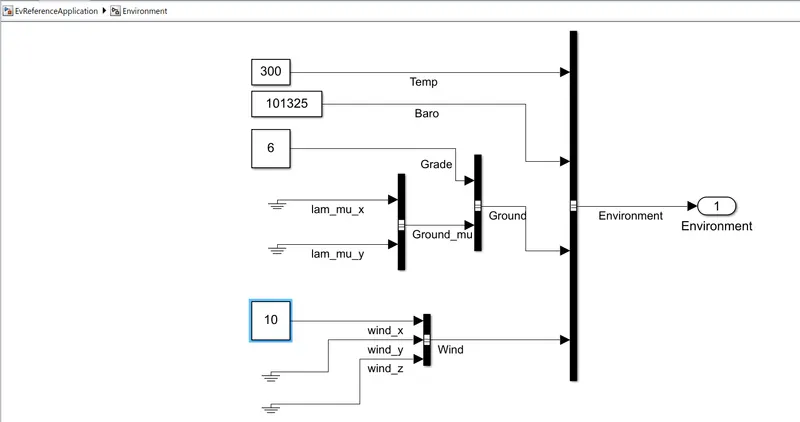
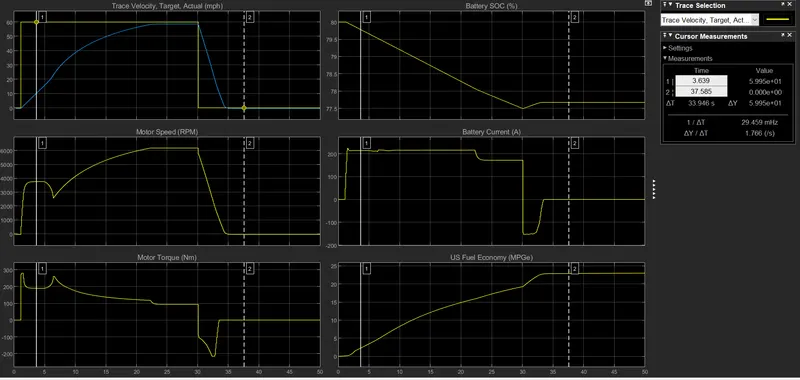
grade is kept 6 & wind is 10, run the simulation with run time 50 sec., then open visulization block
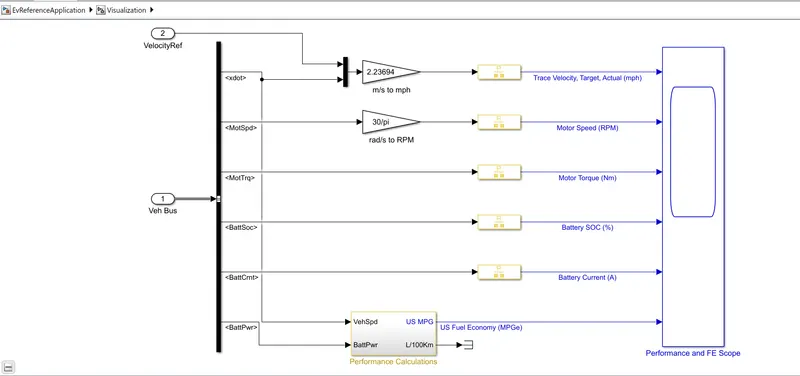
open performance&FE scope to get result
observation:-
1. more velocity is achieved by EV as compared to HEV but time taken for acceleration & deacceleration is also more in EV.
2. max. motor rpm is more in HEV.
3. HEV has achieved more motor torque.
4. battery current drawn by HEV is more than double of EV.
5. EV battery discharging is less than HEV.
6. EV US Fuel economy(MPGe) is more than double of HEV.
link:- https://drive.google.com/file/d/1sZXBl33okJuCHXtLhFuyNirUW3RZXRt8/view?usp=sharing
link:- https://drive.google.com/file/d/18PQ3U0BHddLqncI9eL_Pmvn7iU4fRXPV/view?usp=sharing