Week-4 Challenge WOT Condition Part-2
Q1. What is the difference between the mapped and dynamic models of engine, motor, and generator? How can you change the model type?
A: Mapped SI Engine:
The mapped SI Engine model uses power, air mass flow, fuel flow, exhaust temperature, efficiency, and emission performance lookup tables. The lookup tables are functions of commanded torque, brake torque, and engine speed.
Calibration maps are the key part of the Mapped CI Engine and Mapped SI engine Blocks. These Mapped Engine blocks which are used in Vehicle Dynamics Blockset represents engine behavior and stores optimal control parameters. These calibration mapping with engine in control design provides flexible, efficient control algorithms and estimators which are suitable for electronic control unit (ECU) implementation. Mathworks has worked with Gamma technologies to provide processes that how to calibrate an engine performance after studying data from 1.5L SI and CI engine models. The data required for calibration typically comes from engine dynamometer tests or engine hardware design models.
The mapped Engine implements the following calibration maps---
- Engine brake torque map- used for Engine brake torque in look-up table as a function of commanded fuel mass and engine speed.
T brake=f(F,N) where T brake is engine torque, in N-m
F is commanded fuel mass, in
Mg per injection
N is engine speed, in rpm
- Engine air mass flow map - used for Engine air mass flow in air mass look up table as a function of commanded fuel mass and engine speed.
M intk=f(Fmax,N) where m intk is air mass flow, in kg/s
Fmax is commanded fuel mass,
mg per injection
N is engine speed, in rpm
Like-wise mapping can be done with look-up tables for engine exhaust temperature, Brake-specific fuel consumption efficiency, engine-out(EO) hydrocarbon emissions, EO carbon-monoxide emissions, EO nitric oxide and nitrogen dioxide, EO carbon dioxide emission for both CI and SI engine.
Mapped Engine can be used by engineers when the engine data from a dynamometer or a design tool like GT-POWER are available and also used for quasi steady-state engine simulations.
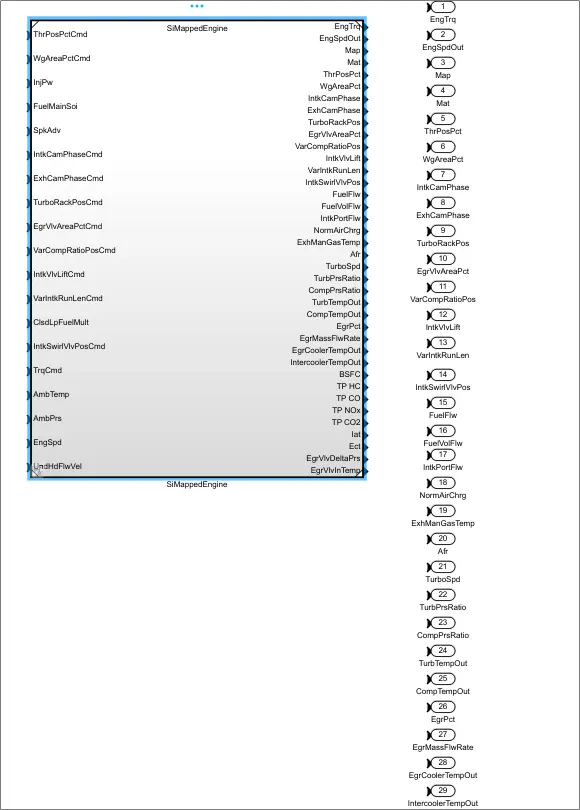
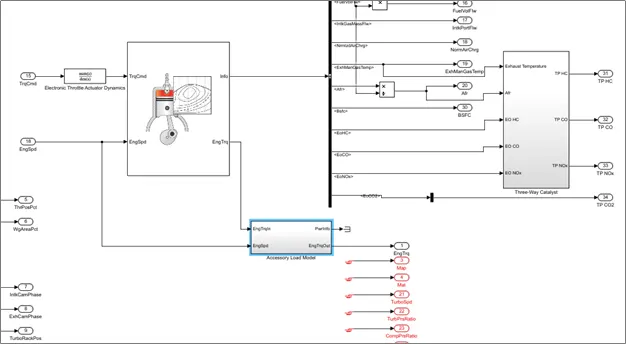
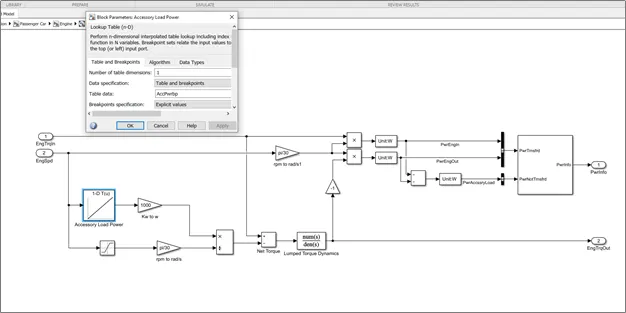
Dynamic Engine(SI engine or CI Engine): Dynamic engine is real-time engine behavior. Model decomposes the engine behavior into engine characteristics that are separated into lower-level components. By combining components, the models capture the dynamic effects. We can use this type of dynamic engine model is when we need a detailed dynamic model and have component-level data. we can also analyze the impact of individual engine components on the overall performance.
HevMmReferenceApplication→Passenger car →Electric Plant
In this application reference model, by default mapped Motor and Generator will be there along with dynamic SI or CI engine.
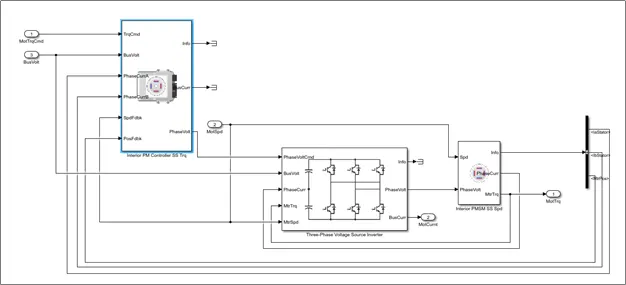
In the electric plant block, we find Mapped generator and MappedMotor blocks. On clicking Mapped Motor block we can see the MotMapped and MotDynamic blocks where by default MotMapped is in active state.
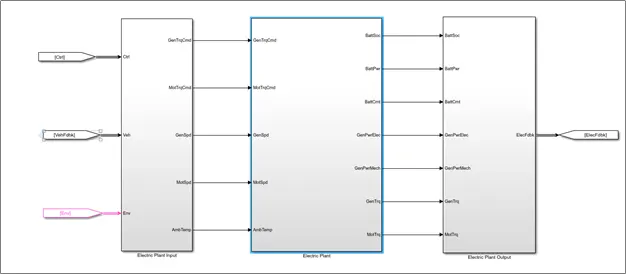
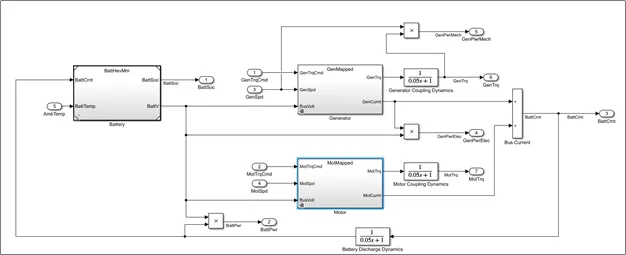
Mapped Motor: It drives electronics in torque-control mode. The output torques track the torque reference demand and include a motor-response time constant. We can use this mapping method via block when detailed parameters of the motor was not known and the block assumes the speed fluctuations due to mechanical load which does not affect the motor torque tracking.
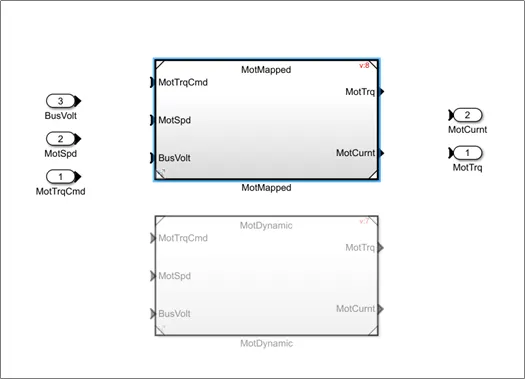
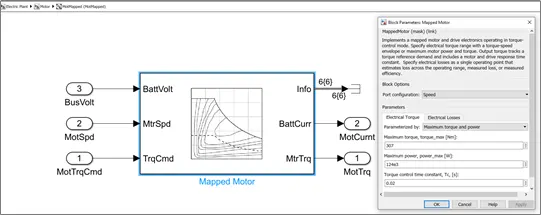
Dynamic Motor: How to change Mapped Motor to Dynamic Motor:
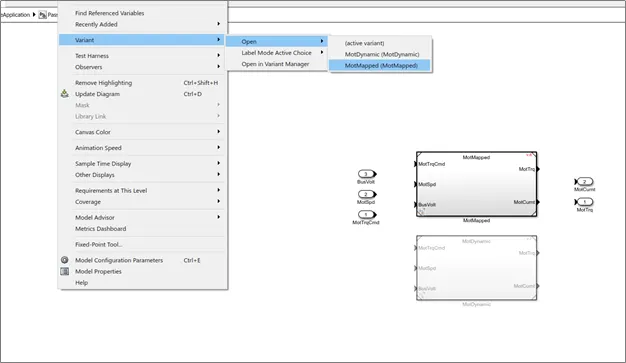
If we right-click on the blank space we can see a popup that shows variant option. The variant option can be used to change the activation of the motor from mapped to dynamic and vice versa.
Mapped Generator:
HevMmReferenceApplication→Passenger car →Electric Plant
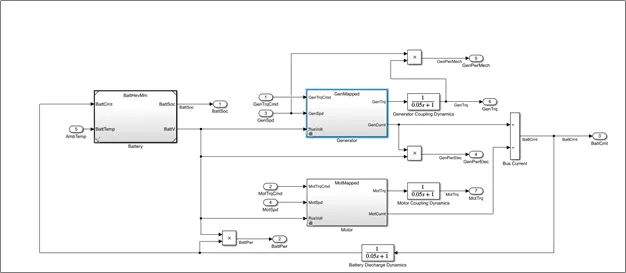
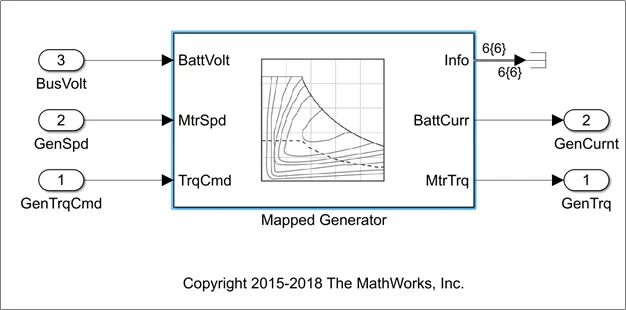
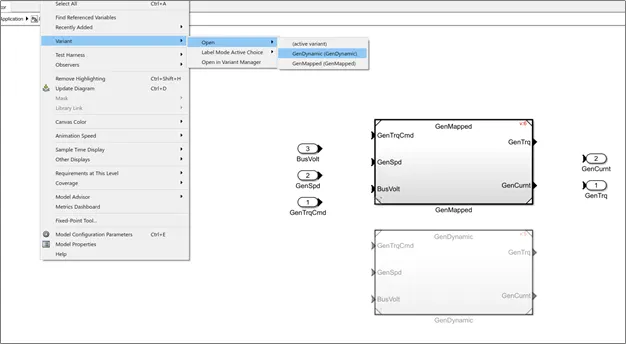
In the electric plant block, we find Mapped generators and Motor blocks. On clicking the Mapped generator we can see the GenMapped and GenDynamic blocks where by default GenMapped is in active state. If we right-click on the blank space we can see a popup that shows variant option. The variant option can be used to change the activation of the generator from mapped to dynamic and vice versa.
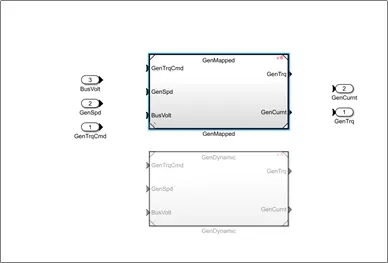
Dynamic Generator: How to change Mapped Generator to Dynamic Generator:
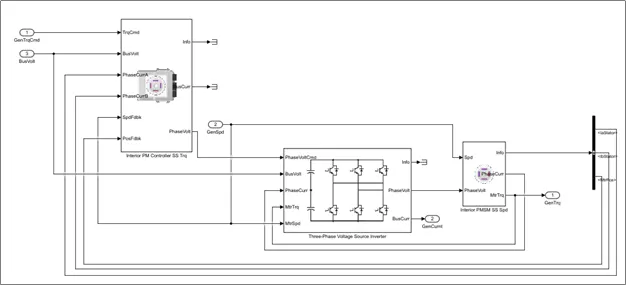
Dynamic Generator:
Q2. How does the model calculate miles per gallon? What factors are considered to model fuel flow?
A.
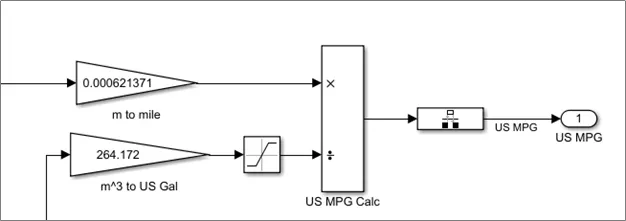
The factors to model fuel flow is shown in the model for the calculation of fuel consumption in miles per gallon
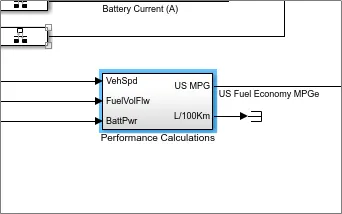
The model showed how the conversion of energy consumption in miles per gallon
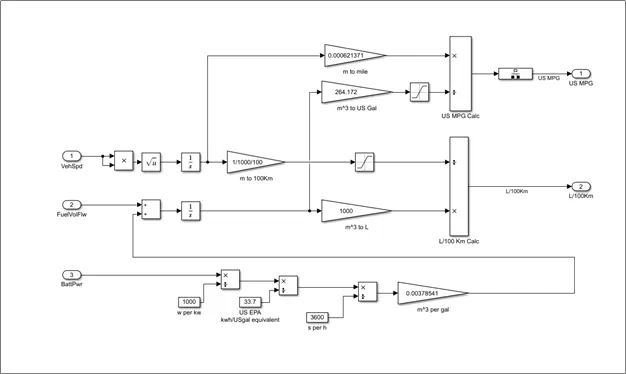
In transportation, the unit of energy is usually kilowatt-hour. The energy consumption per unit distance in KWh/Km is used to evaluate the vehicle energy consumption. In the U. S., the distance per unit volume of fuel is expressed in miles per gallon (mpg). Energy consumption is an integration of the power output at the battery terminals.
The factors to be considered are vehicle speed, Battery Power, and fuel volume flow. The vehicle speed is multiplied by time and then integrated to get the range of distance. This value is multiplied by factor 0.0000621371 to convert into distance, mile. Both the battery cell fuel and FuelVolFlw are then integrated. The total volume value is multiplied by factor 264.172 to convert the volume from m3 to US Gallon. Then the distance is divided by total Fuelvolflw to get miles per Gallon, US MPG
Q3. Run the HEV Reference Application with WOT drive cycle. Change the grade and wind velocity in the environment block. Comment on the results.
A: A vehicle’s driving performance is evaluated by acceleration time, maximum speed and gradeability
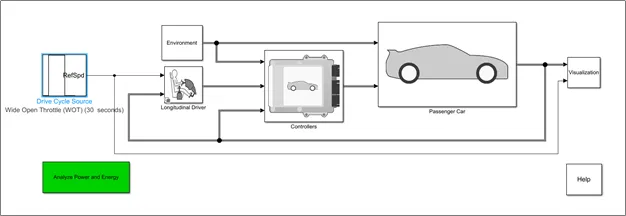
Hybrid electric Vehicle Multiple reference Model:
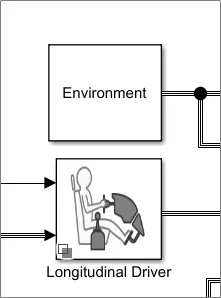
Environment Block
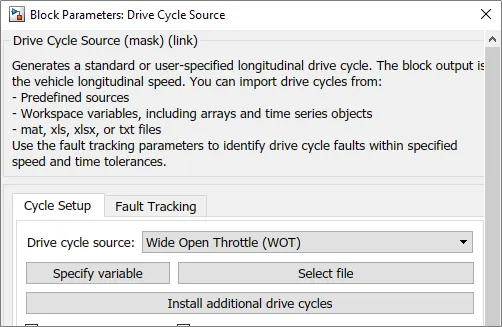
Drive Cycle Component:
Observation1:
Drive Cycle Input: WOT Drive cycle with start time, initial reference speed, Nominal reference speed, reference speed, WOT simulation time are given as below
Environment Input: Gradeability=7, wind speed=100m/s
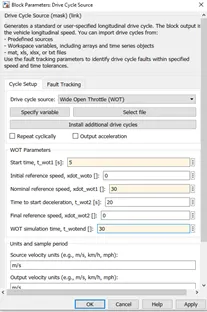
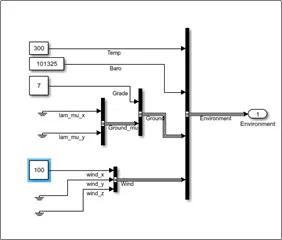
Drive Cycle Environment
Simulation results:
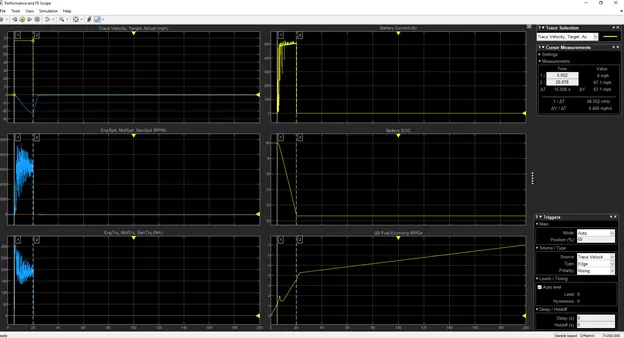
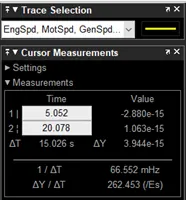
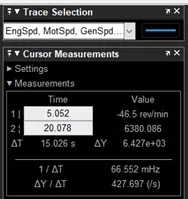
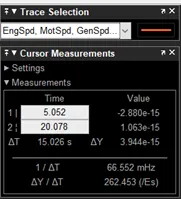
While giving WOT drive cycle as input to the vehicle, after 5seconds the velocity of the vehicle increases to a maximum speed of 60m/hr and remains constant for 15 seconds. Then by applying brakes, the vehicle starts decelerating to zero velocity. The yellow line shown in the first graph is the target velocity given by the drive cycle. But the blue curve which is the actual behavior of the vehicle does not follow the target velocity due to some energy losses. Because of the given gradability and wind speed, the vehicle takes a negative value which can be observed from the graph to explain the traction power is not enough supplied by the battery. Battey power input is completely consumed by the vehicle and so no regenerative energy is provided by the motor to charge battery SOC, it shows even though there is a maximum battery input of 500A but battery state of charge is decreased to 70 units during 15 seconds. Engine speed is not much increased but 3 units, motor runs at a speed of 6380.086rpm. Even engine torque has not increased much to provide enough battery power. The generator torque has zero rates of increase. Fuel consumption per gallon also increases during these 15 seconds. It may be because of more aerodynamic force i.e., wind velocity.
Observation 2:
Drive Cycle Input: WOT Drive cycle with start time, initial reference speed, Nominal reference speed, reference speed, WOT simulation time are given as below
Environment Input: Gradeability=7, wind speed=20m/s
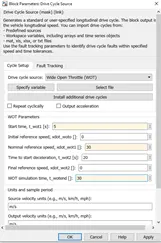
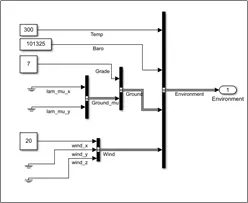
Drive Cycle Environment
Simulation results:
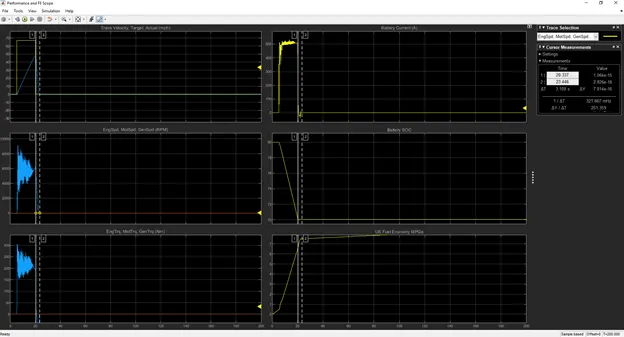
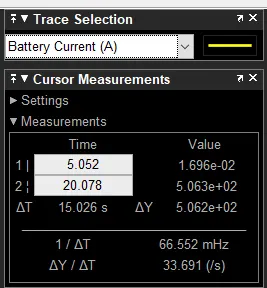
At given WOT drive cycle input, the yellow line in velocity, time graph, the target velocity of the vehicle has to be increased to a maximum speed of 67mph within 5 seconds. It should remain at the same speed for the next 15 seconds and apply brakes which brings the vehicle to retard suddenly decreases to zero velocity. The blue curve shows the actual behavior of the vehicle shows there is an increase in velocity of 50mph which then maintains for 15 seconds and when brakes are applied the vehicle retards slowly to zero velocity in the time span of 2 or 3 seconds.
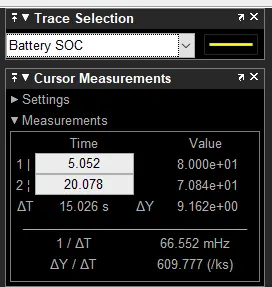
During retardation, regenerative brakes are applied and the motor torque takes negative values means energy is being utilized to charge the battery SOC. Therefore the battery SOC has a slight down curve and again attains the terminal value to 70A between points 1 and 2 which increases the battery power from negative value to positive value. The generator will be in the off state. The fuel consumption is also relatively high.
Observation3:
Drive Cycle Input: WOT Drive cycle with start time, initial reference speed , Nominal reference speed , reference speed , WOT simulation time are given as below
Environment Input: Gradeability=7, wind speed=20m/s
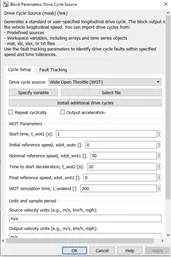
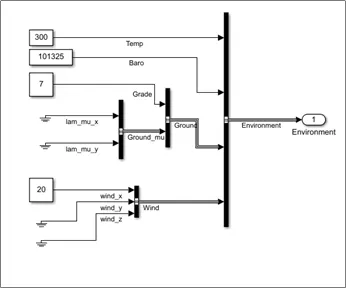
Drive Cycle Environment
Simulation results:
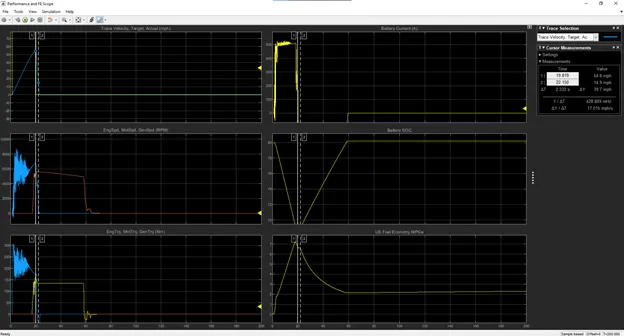
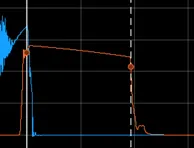
Here for the taken WOT drive cycle, the start time taken is 1 second, nominal reference speed is 50 mph, time to start deceleration is the 20s, and simulation time is 200s. The target vehicle velocity (yellow line) increases to 112mph within 1 second and remains in that speed till the 20s and then retards to zero velocity. The blue curve which is the actual behavior of the vehicle has an increase in velocity up to 50mph within the 20s and slowly retards to zero velocity within 2 s.
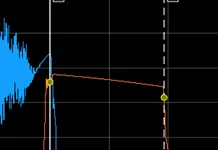
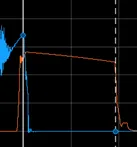
Engine speed Motor speed Generator speed
There is a decrease in engine speed, motor speed, and generator speed during vehicle retardation. While the engine torque and motor torque decrease moderately but generator takes negative values. This regenerative braking energy is utilized to increase battery SOC 80A so the battery power increases to the nominal value. The fuel consumption per gallon also decreases.
Q4. Keeping all other parameters the same, compare the simulated results of hybrid and pure electric powertrains
A.
Pure Electric Vehicle:
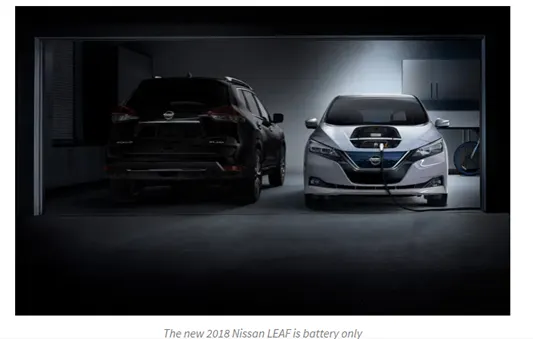
Electric vehicles operate only on Electric Motor and Battery. There will be no fuel tank instead a battery is used to store the required energy to run the electric motor which takes just 7 seconds to run the vehicle at 0-100kmph.
Hybrid Electric Vehicle:
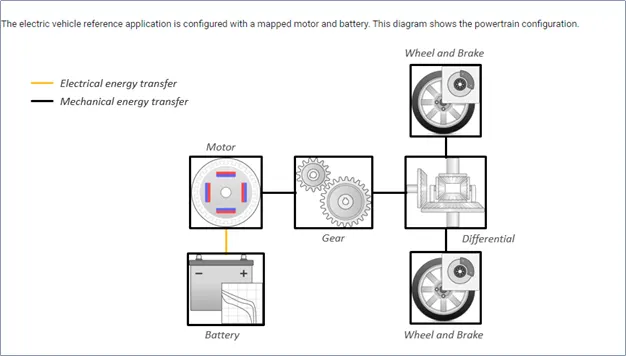
Hybrid vehicles use both an electric motor and traditional engines to drive the car. To improve vehicle performance or fuel-efficiency, it can easily switch from electric motor to fossil fuel engine and drive the car.
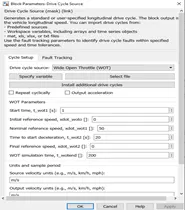
Inputs are given to Electric Vehicle power train, while remaining all other features are kept same.
Drive Cycle Input: WOT Drive cycle with start time, initial reference speed, Nominal reference speed, reference speed, WOT simulation time are given as below
Environment Input: Gradeability=7, wind speed=100m/s
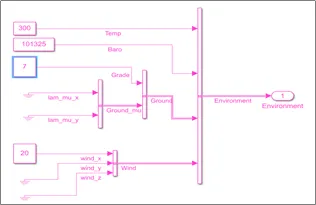
Simulation results:
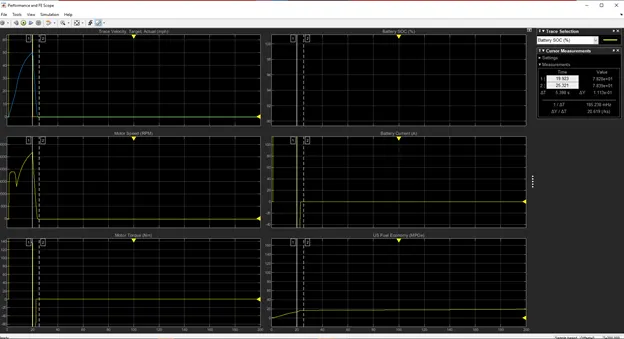
In Electric Vehicles the time taken for simulation is less when compared to Hybrid Electric vehicles as there will be no generator and Engine. EV‘s provides more battery power and consumes less fuel energy which can be observed from the graph. It achieves high velocity at very little time compared to HEV vehicles.
When regenerative braking is effective on an EV, a part of that braking energy wasted in conventional vehicles can be recovered by operating the motor drive as a generator and restoring it into the batteries. From the graph, we can see the regenerative braking power is negative and the energy is utilized to charge the batteries and the battery power has increased which is actually completely drained by total battery energy consumption.
conclusion: Pure Electric vehicles are more efficient than hybrid EV's but in Hybrid vehicles we have different options to improve the performance of the vehicle. there will be zero emissions and have high energy efficiency. For Ev vehicles operation range performance will be less compared to HEV's.