Week-4 Challenge WOT Condition Part-2
1.1) What is the difference between mapped and dynamic model of engine, motor and generator?
1. Mapped
- Model uses a set of steady-state lookup tables to characterize engine performance.
- The tables provide overall engine characteristics, including actual torque, fuel flow rate, BSFC, and engine-out exhaust emissions.
WHEN TO USE
- If you have engine data from a dynamometer or a design tool like GT-POWER.
- For quasi steady-state engine simulations.
2. Dynamic
- Model decomposes the engine behavior into engine characteristics that are separated into lower-level components. By combining components in this way, the models capture the dynamic effects.
WHEN TO USE
- If you need a more detailed dynamic model and have component-level data.
- To analyze the impact of individual engine components on the overall performance.
1.2) How can you change model type?
- We can change the model type by navigating to engine or electric plant block set under passenger car block set.
- Depending on the model type eg. full electric, hybrid etc. model could be changed between mapped and dynamic.
- right click on motor/generator/engine -> variant -> label mode active choice -> dynamic or mapped.
2.1) Which factors are considered to model fuel flow?
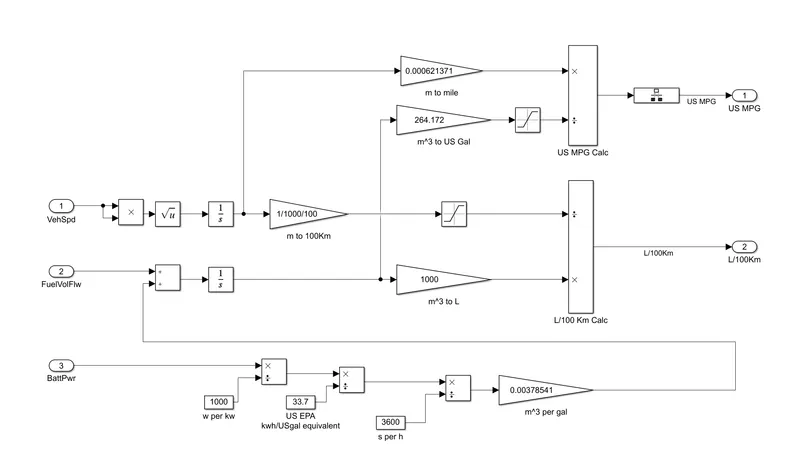
- vehicle speed
- battery power
- fuel flow
2.2) How does the model calculate miles per gallon?
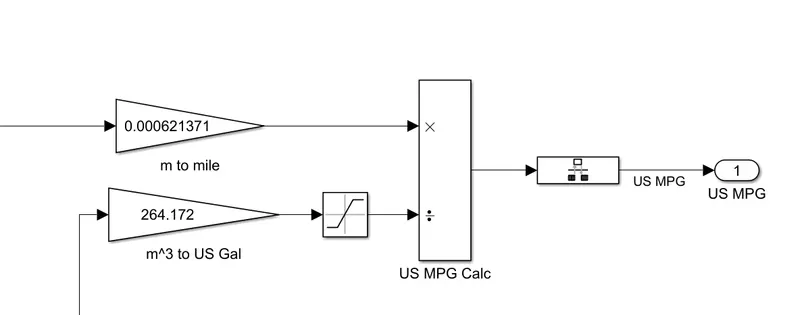
3) Run the HEV ReferenceApplication with WOT drive cycle. Change the grade and wind velocity in the environment block. Comment on the results.
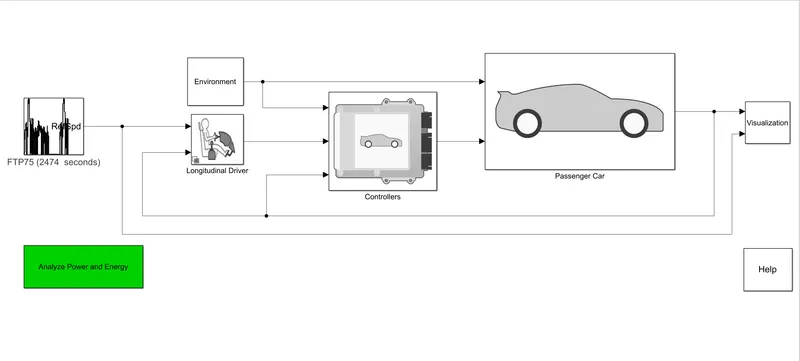
WOT input
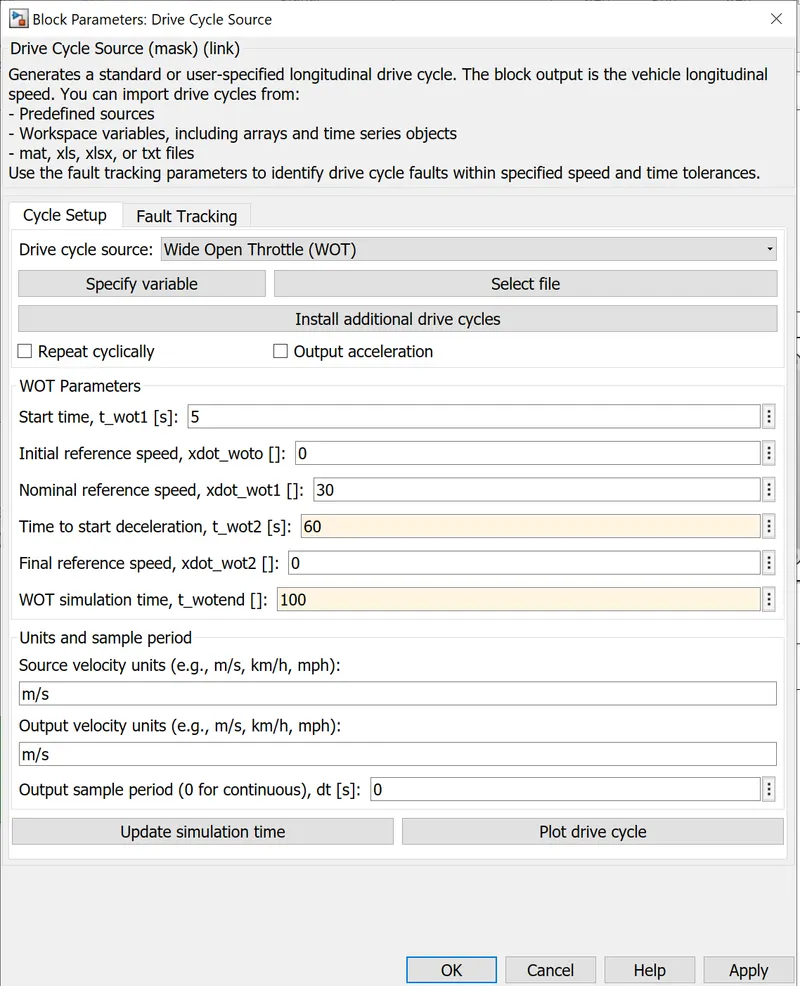
Changes in grade and wind velocity
wind speed - 20
grade - 8%
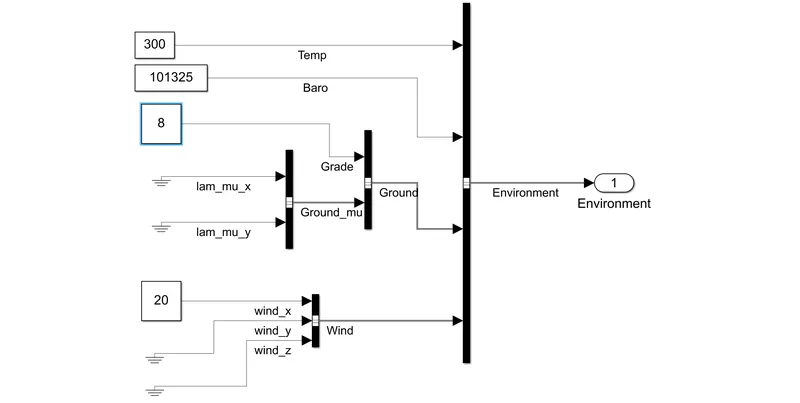
these parameters are available under environment tab
Results
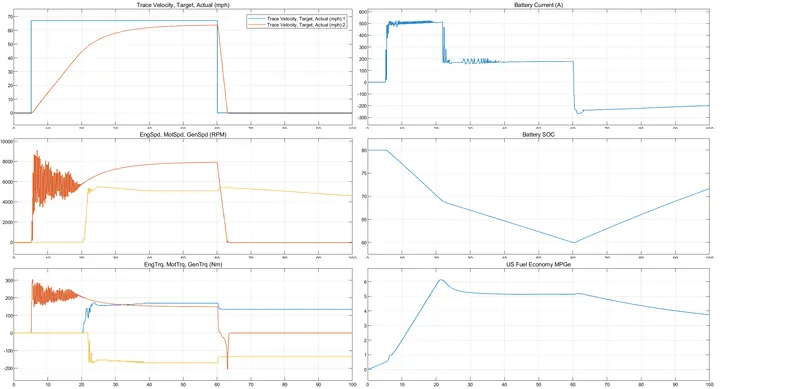
Plot 1 - (Trace Velocity Target vs Actual) - Through this plot it is denoted that the desired Velocity has not been met by the actual vehicle velocity. The desired velocity was ranging at near about 68 mph but the actual velocity achieved was near to 64 mph.
Plot 2 (Engine Speed, Motor Speed) rpm - This plot gives the detailed analysis for the achieved Engine and Motor speed in rpm. The contribution of both the Power Generating sources for meeting the required Velocity.
Plot 3 (Engine Torque, Motor Torque and Generator Torque) Nm - This plot gives the detailed analysis of the Engine, Motor Torque and Generator Torque.
Plot 4 (Battery Current) A - This plot denotes the power produced by the Battery. During acceleration current output is more as engine is not contributing for initial 20sec.
Plot 5 (Battery SOC) - This plot denotes the State Of Charge of the battery, this denotes the range of charge used for the achievement of velocity.
Plot 6 (US Fuel Economy) MPGe - This is the Fuel Efficiency or the Range of the drive and the same is denoted in Miles Per Gallon equivalent.
4.)Keeping all other parameters same, compare the simulated results of hybrid and pure electric powertrains.
MODEL:
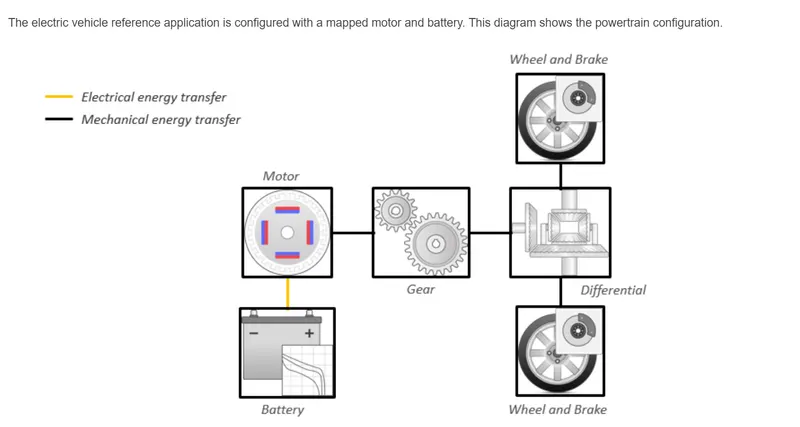
All other parameters are same as above simulation.
Result:
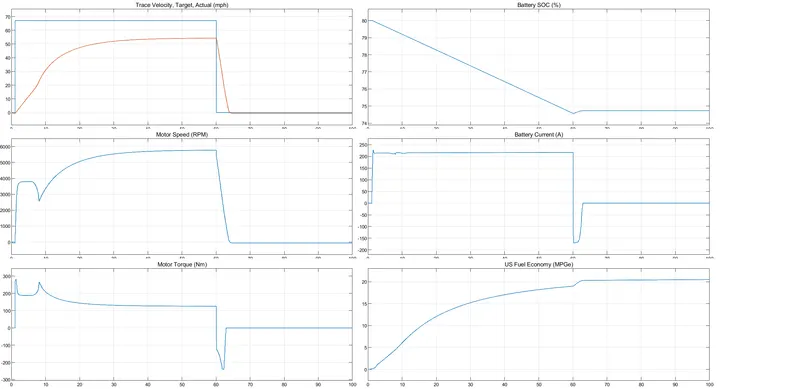
Plot 1 - (Trace Velocity Target vs Actual) - When compared to HEV Model the maximum velocity obtained is around 52 mph versus 64 in HEV.
Plot 2 - Motor Speed - Max motor speed attained is around 5600 rpm versus 8000 in HEV
Plot 3- This plot gives the detailed analysis of the Motor Torque.
Plot 4 - Battery SOC - battery discharges from 80% to 60% and then runs constant at 60% where as in HEV battery discharges from 80% to 60% and then gets charge back till 70%.
PLot 5 - Battery Current (A) - Battery Usage is at peak till the vehicle accelerate and then goes 0 after 60 sec.
Plot 6 - This is the Fuel Efficiency or the Range of the drive and the same is denoted in Miles Per Gallon equivalent.
Here when vehicle decelarate current usage goes to negative explaining there is a slight charging phase where motor act as an generator.