Project 1 - Parsing NASA thermodynamic data
AIM: Write a function that extracts the 14 co-efficients and calculates the enthalpy, entropy and specific heats for all the species in the data file. The formulae are shown below.
Here R is the universal gas constant, T is the temeprature
1. function for calculating specific heat,entropy,enthalpy:-
function[Cp,H,S] = property(A1,A2,A3,A4,A5,A6,A7,a1,a2,a3,a4,a5,a6,a7,T,gmt)
%here gmt = global mid temperature
R = 8.314;
    if T <= gmt
        Cp = (A1+(A2.*T)+(A3.*T.^2)+(A4.*T.^3)+(A5.*T.^4))*R;
        H = (A1+(A2.*(T./2))+(A3.*(T.^2)./3)+(A4.*(T.^3)./4)+(A5.*(T.^4)./5)+(A6./T)).*(T.*R);
        S = ((A1.*log(T))+(A2.*T)+((A3.*T.^2)./2)+((A4.*T.^3)./3)+((A5.*T.^4)./4)+A7)*R;
    else

        Cp = (a1+(a2.*T)+(a3.*(T.^2))+(a4.*(T.^3))+(a5.*(T.^4)))*R;
        H = (a1+(a2.*(T./2))+(a3.*(T.^2)./3)+(a4.*(T.^3)./4)+(a5.*(T.^4)./5)+(a6./T)).*(T.*R);
        S = ((a1.*log(T))+(a2.*T)+((a3.*T.^2)./2)+((a4.*T.^3)./3)+((a5.*T.^4)./4)+a7)*R;
    end
end- for calculating the specific heat(Cp),entropy(H) and enthalpy(S) we have created a function code.
- as we have different coefficients for different temperature ranges, we have used 'if else' syntax which changes the flow of code depending on the temperature.
2. function for calculating molecular weight:-
function [MW] = molecular_weight(species)
atoms = {'H','C','N','O','A'};
fprintf('Molecular Weight of ');
fprintf(species);
fprintf(' : ');

atomic_weight = [1 12 14 16 40];
MW = 0;
for i=1:length(species)
    for j=1:length(atomic_weight)
        if strcmp(species(i),atoms(j))
            MW = MW + atomic_weight(j);
            rank = j;
        end
    end

    %repeating weights
    n = str2num(species(i));
    if n>1
       MW=MW+atomic_weight(rank)*(n-1);
    end
end
end- molecular weight is calculated by using atomic weight of H,C,N,O, and A.
- positions of these atom in a compound is used to determine the molecular weight.
3. Main Code:-
file = fopen('THERMO.dat','r');
file_header = fgetl(file);

temp = fgetl(file);
global_temp_range = strsplit(temp,' ');
glt = str2double(global_temp_range{2});
gmt = str2double(global_temp_range{3});
ght = str2double(global_temp_range{4});

R = 8.314;
T = linspace(glt,ght,500);

for i = 1:3
    skip=fgetl(file);
end

for j = 1:53
    line1 = fgetl(file);
    species = strtok(line1);

    line2 = fgetl(file);
    line3 = fgetl(file);
    line4 = fgetl(file);

    x = strfind(line2,'E');
    y = strfind(line3,'E');
    z = strfind(line4,'E');

    A1 = str2num(line2(1:x(1)+3));
    A2 = str2num(line2(x(1)+4:x(2)+3));
    A3 = str2num(line2(x(2)+4:x(3)+3));
    A4 = str2num(line2(x(3)+4:x(4)+3));
    A5 = str2num(line2(x(4)+4:x(5)+3));
    A6 = str2num(line3(1:y(1)+3));
    A7 = str2num(line3(y(1)+4:y(2)+3));

    a1 = str2num(line3(y(2)+4:y(3)+3));
    a2 = str2num(line3(y(3)+4:y(4)+3));
    a3 = str2num(line3(y(4)+4:y(5)+3));
    a4 = str2num(line4(1:z(1)+3));
    a5 = str2num(line4(z(1)+4:z(2)+3));
    a6 = str2num(line4(z(2)+4:z(3)+3));
    a7 = str2num(line4(z(3)+4:z(4)+3));

    % calculation of Specific Heat, Enthalpy, Entropy
    [Cp,H,S] = property(A1,A2,A3,A4,A5,A6,A7,a1,a2,a3,a4,a5,a6,a7,T,gmt);

    % calculation of Molecular Weight
    weight(i) = molecular_weight(species);

    %plotting
    figure(1)
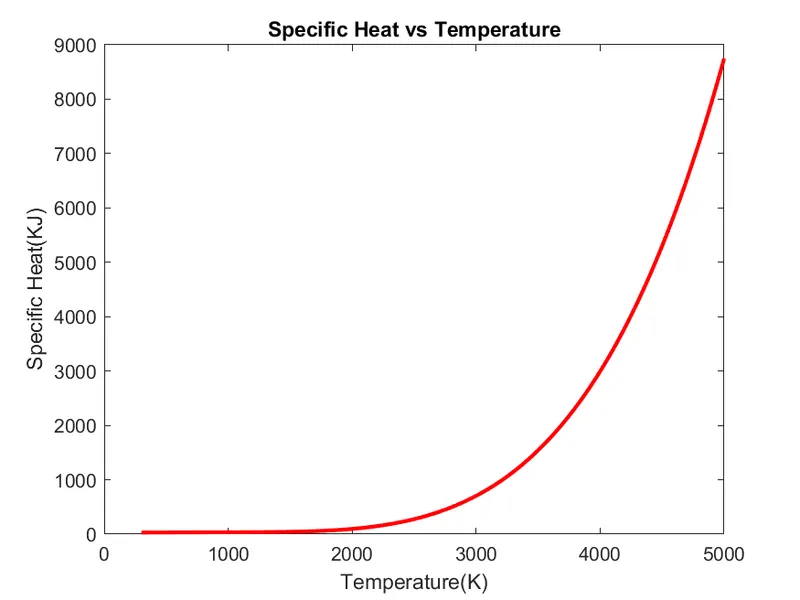
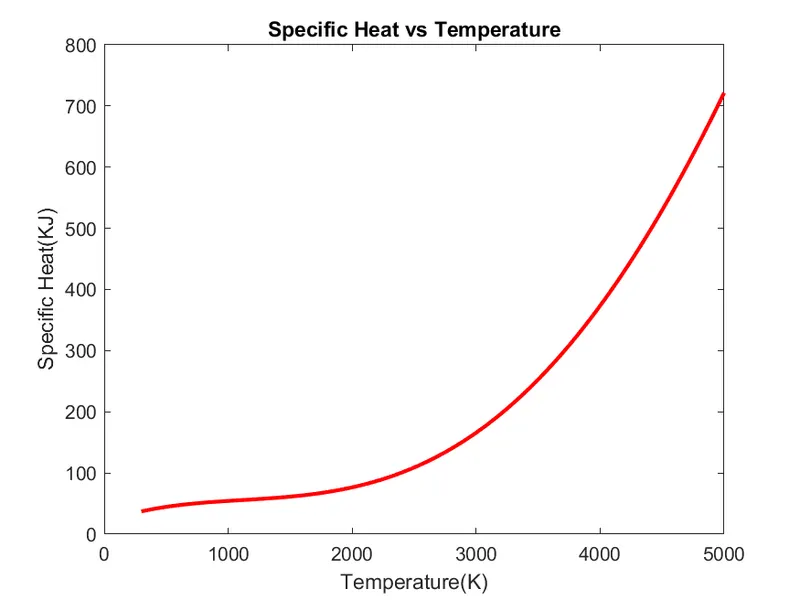
    plot(T,Cp,'r','linewidth',2)
    xlabel('Temperature(K)')
    ylabel('Specific Heat(KJ)')
    title('Specific Heat vs Temperature')

    figure(2)
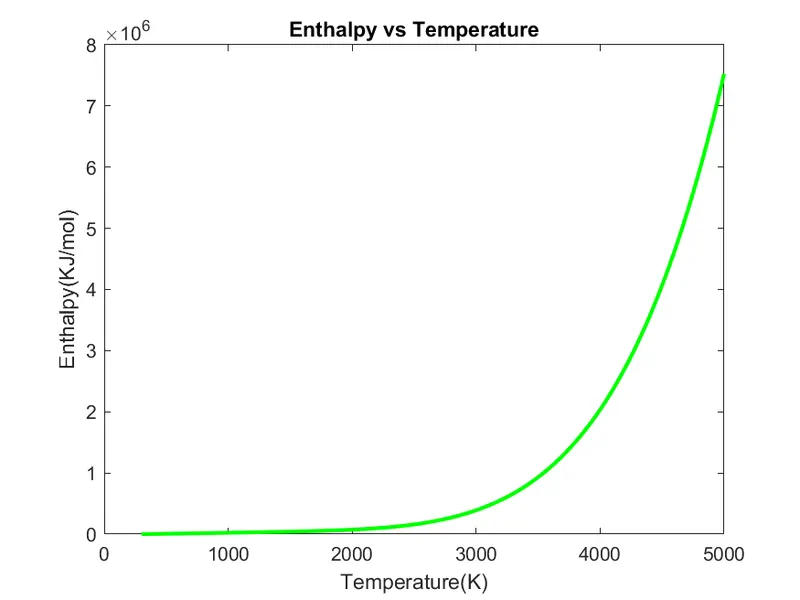
    plot(T,H,'g','linewidth',2)
    xlabel('Temperature(K)')
    ylabel('Enthalpy(KJ/mol)')
    title('Enthalpy vs Temperature')

    figure(3)
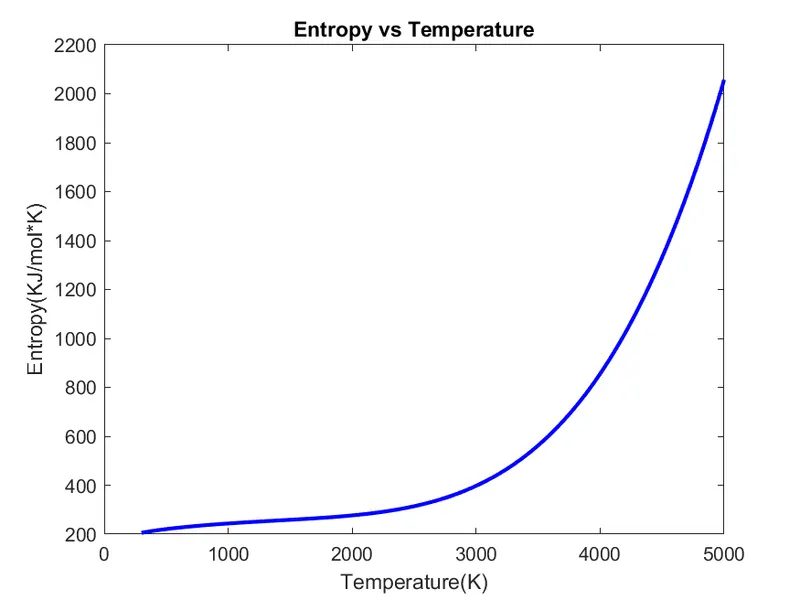
    plot(T,S,'b','linewidth',2)
    xlabel('Temperature(K)')
    ylabel('Entropy(KJ/mol*K)')
    title('Entropy vs Temperature')

    %saving
    cd('C:\Program Files\Polyspace\R2020a\Projects\Matlab\data_parsing')
    mkdir(species);
    cd(species);

    %saving plots
    saveas(figure(1), 'cp.png')
    saveas(figure(2), 'h.png')
    saveas(figure(3), 's.png')
end- fopen is used to open the file
- in syntax fopen('name','r') here r is used to read the file
- temperature is divided in three parts, low, mid and high
- str2num is used to convert character array or string to numeric array
- by using strfind we can locate values with letter 'e' and thus coeeficients are calculated
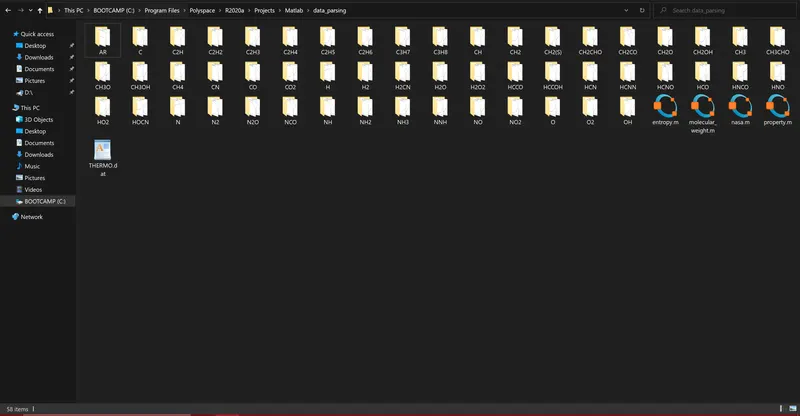
- for saving the file we have used syntax cd and mkdir where cd Change current folder and mkdir is responsible for making new folder
- a for loop is used which incorporate the entire main program as there are 53 species
Results
Graph for O2
Graph for N2
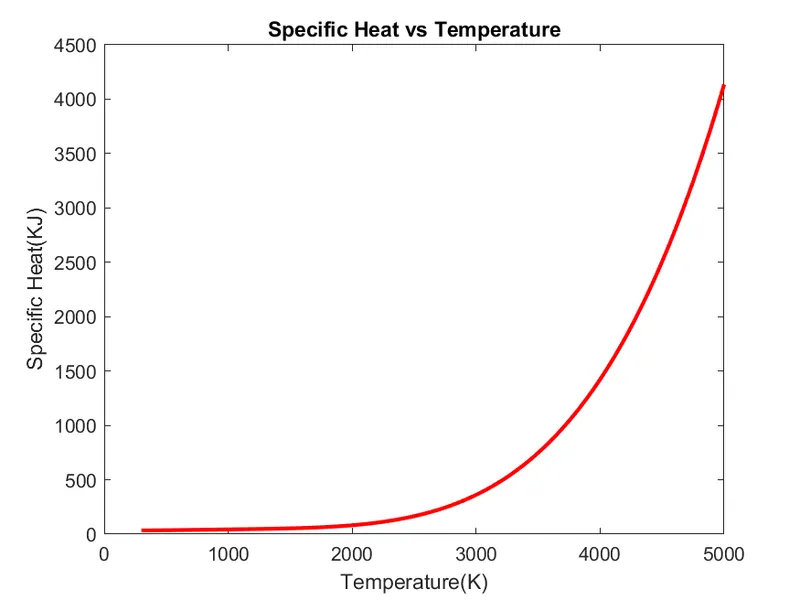
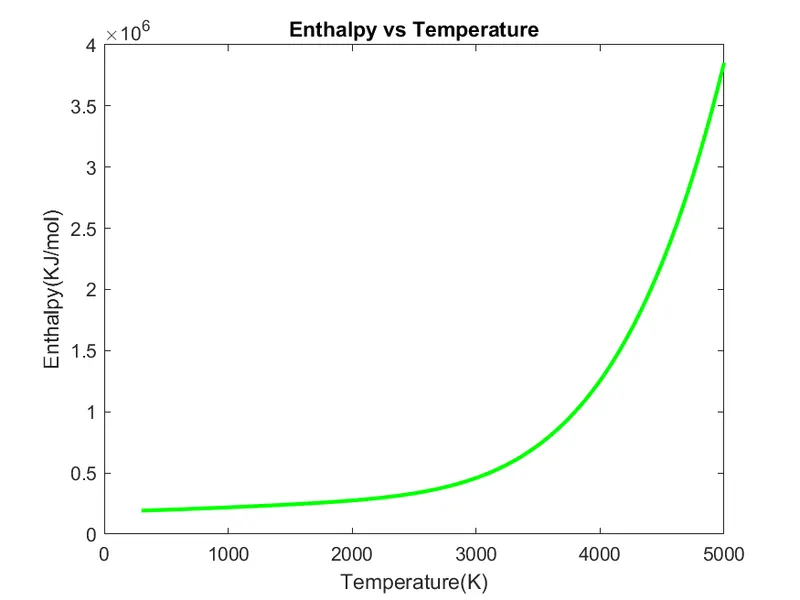
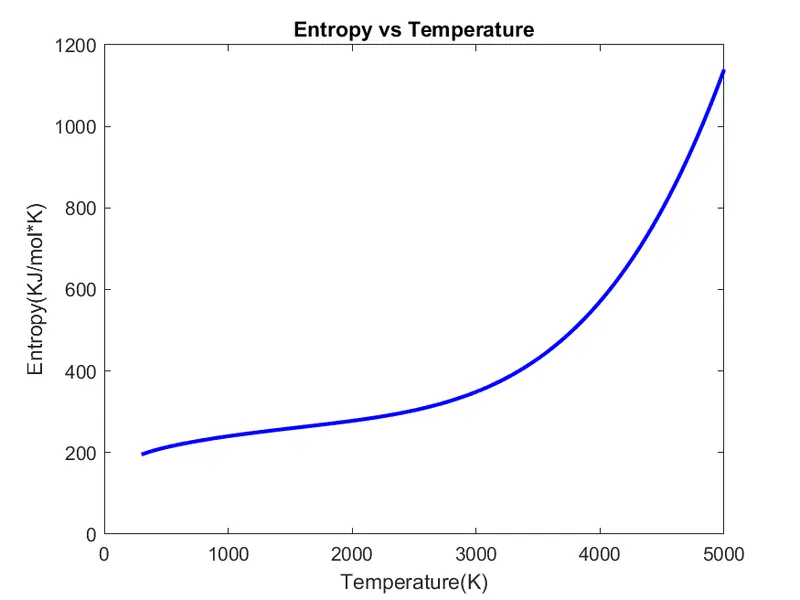
Graph for CO2
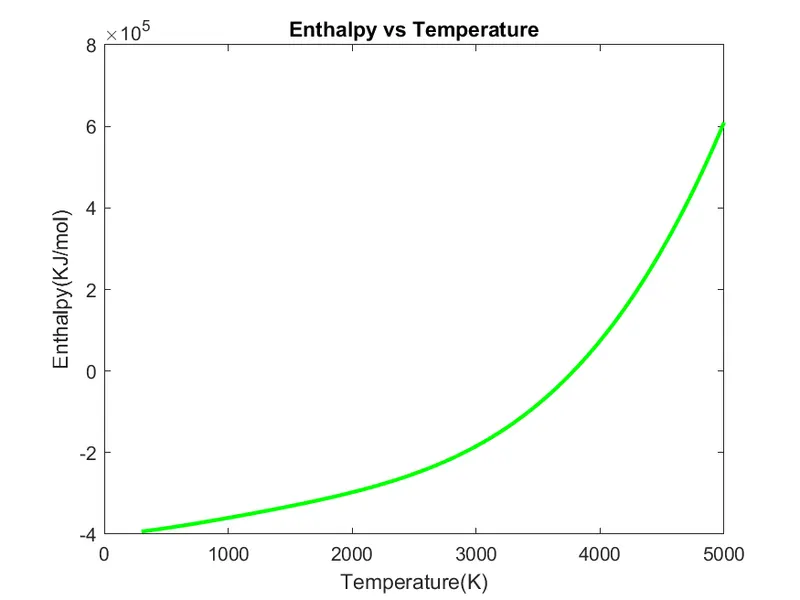
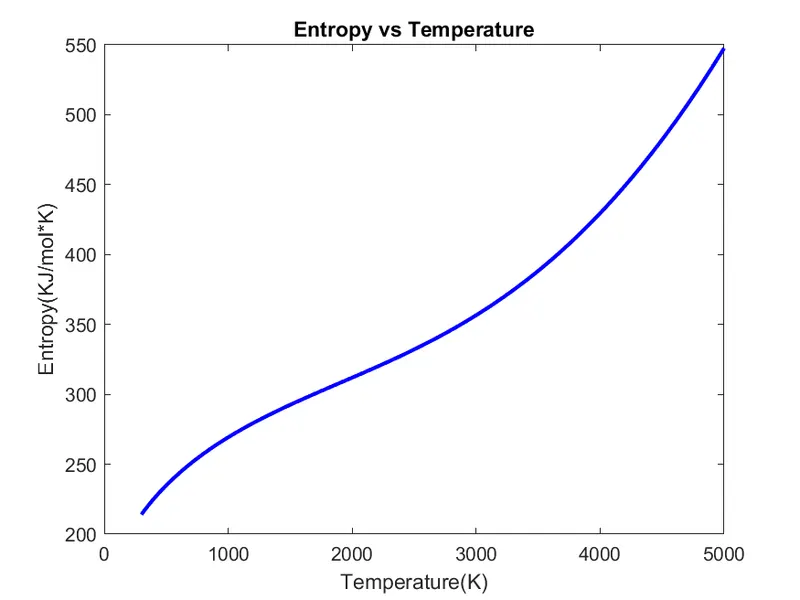
Molecular Weight
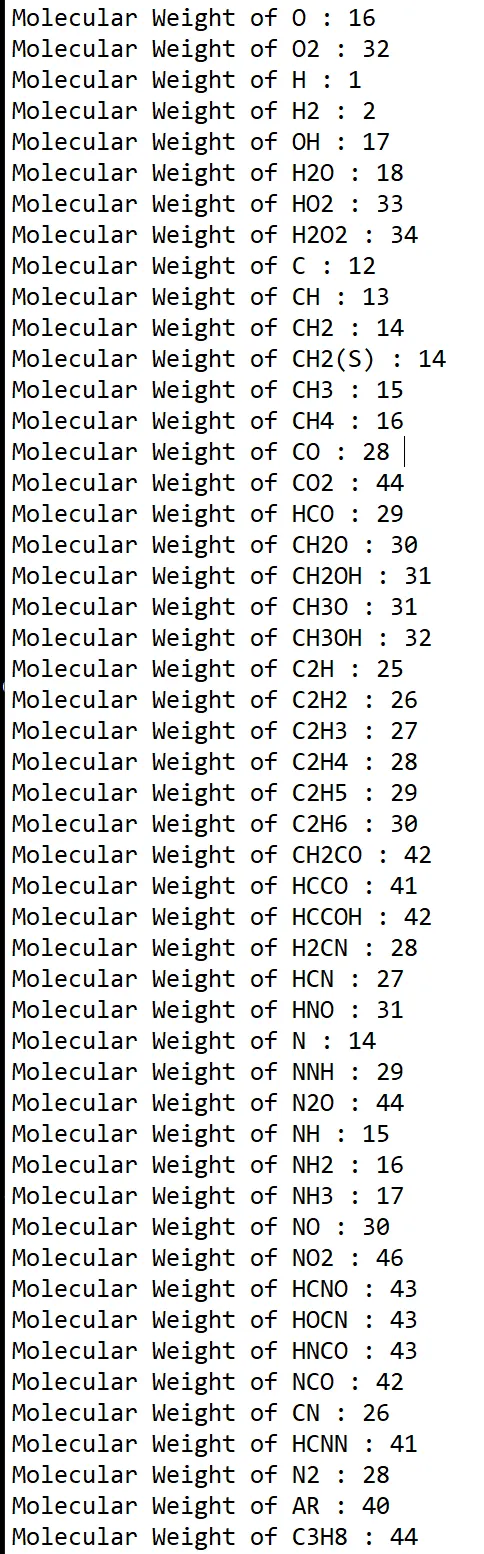
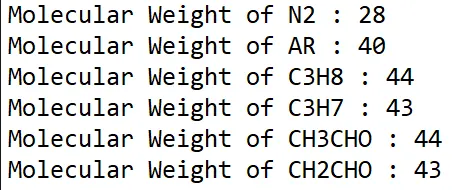
Screenshot of folder