Week-4 Challenge WOT Condition Part-2
Questions
- What is the difference between the mapped and dynamic model of engine, motor and generator? How can you change the model type?
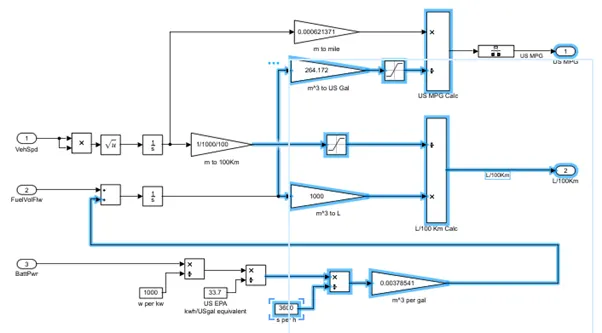
- How does the model calculate miles per gallon? Which factors are considered to model fuel flow?
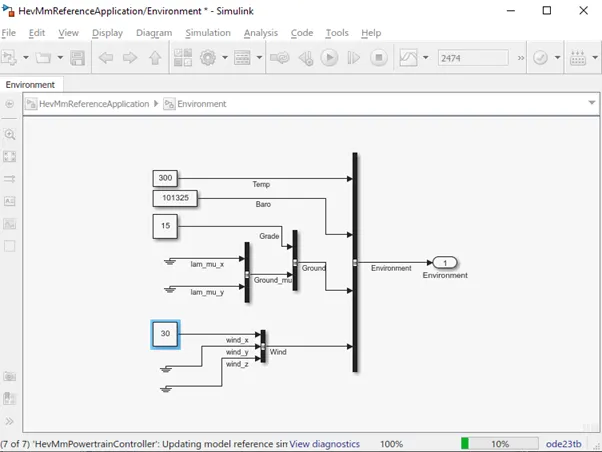
- Run the HEV ReferenceApplication with WOT drive cycle. Change the grade and wind velocity in the environment block. Comment on the results.
- Keeping all other parameters same, compare the simulated results of hybrid and pure electric powertrains.
Task 1:
What is the difference between the mapped and dynamic model of engine, motor and generator? How can you change the model type?
Powertrain Blockset provides two types of combustion engine models: Mapped and Dynamic.
|
Type |
Implementation |
When to Use |
|
Mapped |
The model uses a set of steady-state lookup tables to characterize engine performance. The tables provide overall engine characteristics, including actual torque, fuel flow rate, BSFC, and engine-out exhaust emissions. |
If you have engine data from a dynamometer or a design tool like GT-POWER. For quasi-steady-state engine simulations. |
|
Dynamic |
The model decomposes the engine behaviour into engine characteristics that are separated into lower-level components. By combining components in this way, the models capture the dynamic effects. |
If you need a more detailed dynamic model and have component-level data. To analyse the impact of individual engine components on the overall performance. |
Change model type
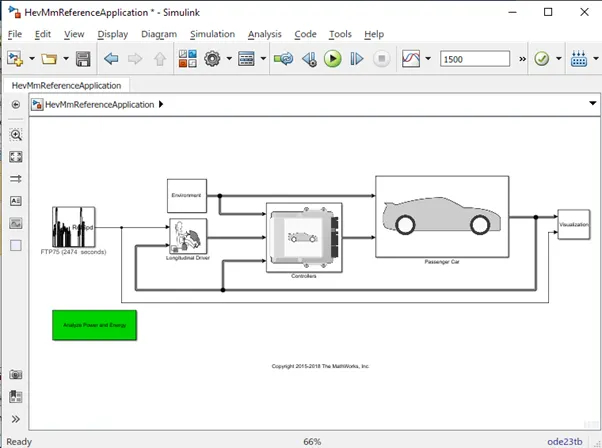
Here, can switch from one model to another-
For Motor
- First, enter the Passenger Car Block.
- Right-click on the engine block
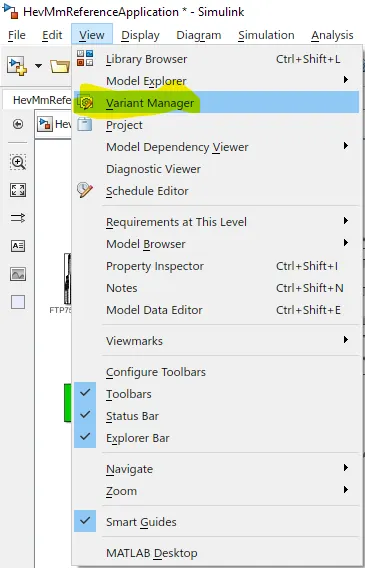
- Click on view, variant Manager
-
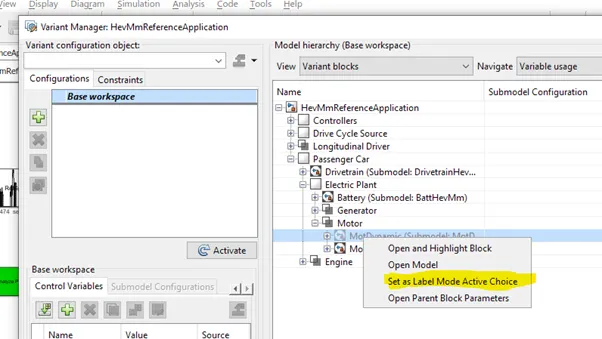
- Then select the desired Model
-Then select Set as Label Mode Active Choice.
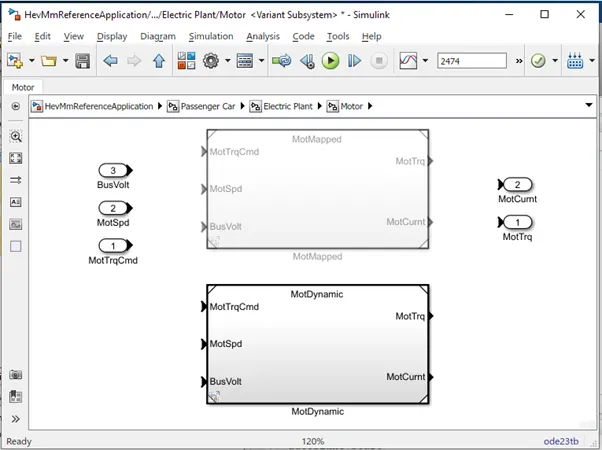
After the change, the following model looks like this.
Task 2
How does the model calculate miles per gallon? Which factors are considered to model fuel flow?
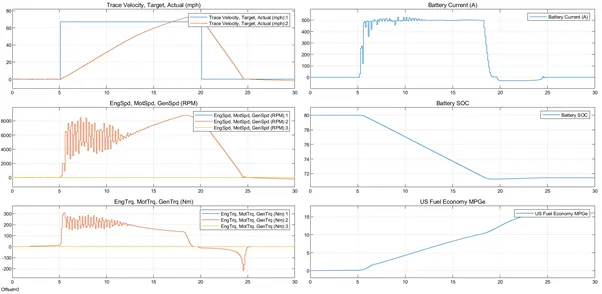
Comments/Comparison of the results obtained.
- Plot 1 (Trace Velocity Target vs Actual) - This is clearly visible that as the grade and the wind velocity is increased compared to the normal state the vehicle is not able to reach the target velocity.
- Plot 2 (Engine Speed, Motor Speed) rpm - In this plot comparing with the normal plot the Engine Speed has reduced to a steep slope on the negative side as compared to the normal situation the grade is increasing the load on the engine and thus the targeted Engine Speed is not met.
- Plot 3 (Engine Torque, Motor Torque, Generator Torque) Nm - There are multiple variations in all these aspects and the same is visible in both the results of Normal and with the Grade and Wind Velocity.
- Plot 4 (Battery Current) A - Battery current has been fluctuating at a higher range as compared to the normal after the vehicle is reaching near to the steady/stable pace the fluctuation starts and is simulated.
- Plot 5 (Battery SOC) - The Battery State of Charge remains more or less similar in both the cases and are resulted at 65% after the end of the WOT Cycle.
- Plot 6 (US Fuel Economy) MPGe - The average fuel economy differ in the range of 6 and 9 mph in both the scenarios.
Task 4
Keeping all other parameters same, compare the simulated results of hybrid and pure electric powertrains.
Below mentioned vehicle is simulated for the HEV Reference
grade-15%
wind velocity - 30
in the environment block
 f
f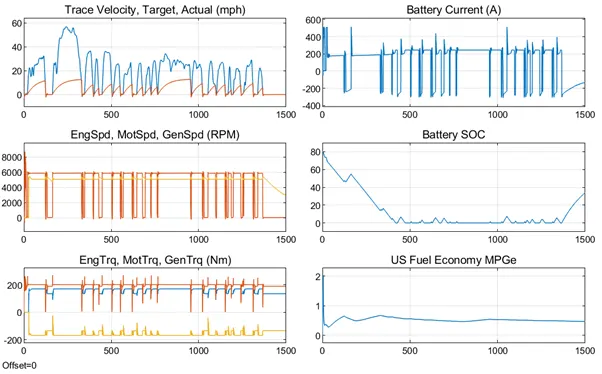
From the above Graph, it is for the WOT Drive Cycle of HEV on default parameters with wind velocity=30 and Grade =10.
- Due to the resistance force, the Top Speed reaches 30mph and takes a huge time to reach.
- Here in the graph is shown that vehicle is giving very less mileage as there is high Drag force and High Hill Climbing force is acting. Due to that High Acceleration force is required to get the max speed, which leads to less mileage is obtained.
- Due to WOT Condition, there is Continuous fluctuation in Torque in getting the maximum speed.
Task 4
Keeping all other parameters same, compare the simulated results of hybrid and pure electric powertrains
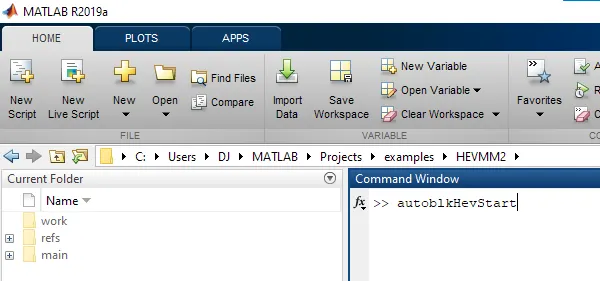
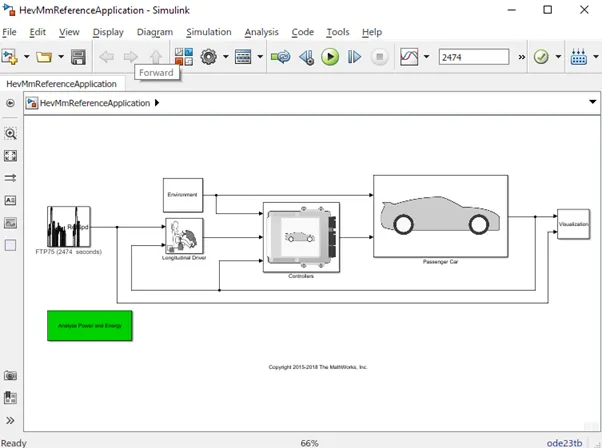
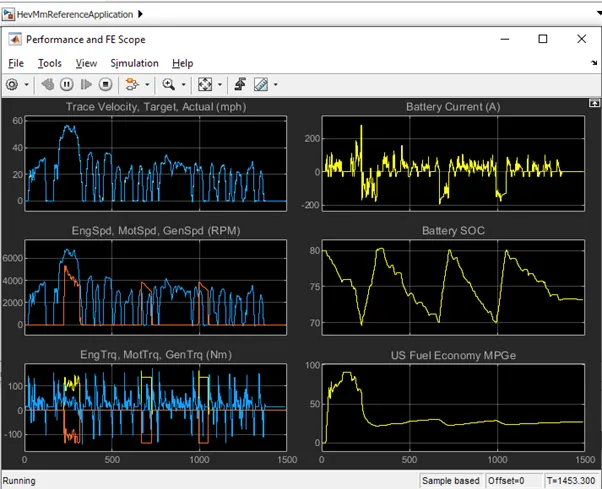
hybrid electric powertrains
Pure electric powertrains
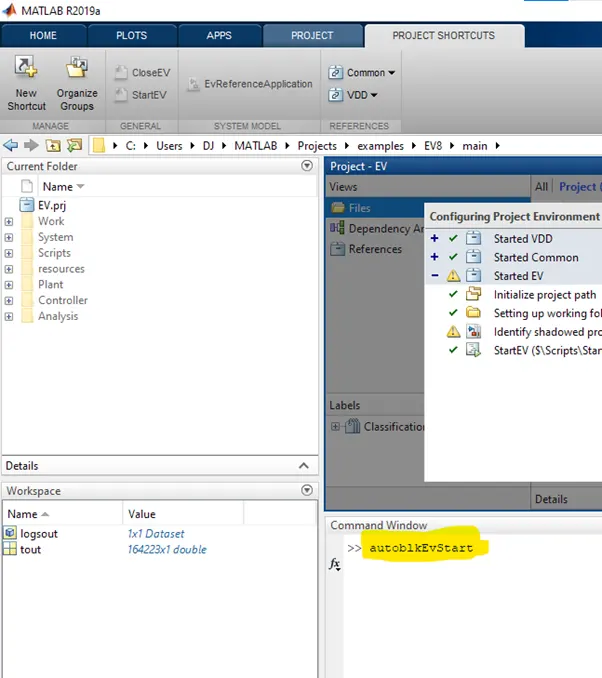
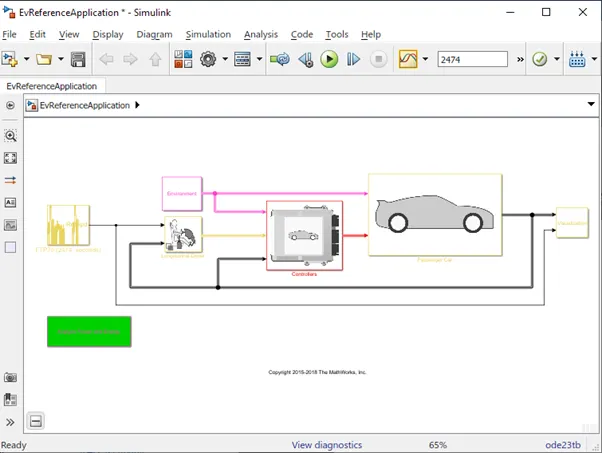
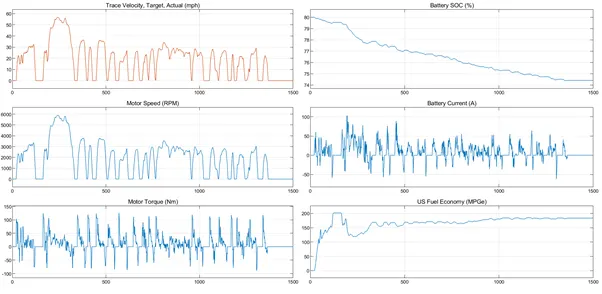
-In HEV Engine, Motor & Generator are the components used to drive the vehicle, whereas, in EV, Motor is the only component is used which is driven by Battery.
- From the graph, it is shown that the even on same input cycle (WOT Drive Cycle), and the same input parameter (Grade & Velocity), the maximum acceleration of the Electric vehicle is more
- SOC doesn't go beyond 75 in EV, whereas in HEV it reaches 70.
- In HEV the battery current fluctuation is high, in EV battery current fluctuation is less, even constant for most of the time span.
- Drivetrain Power loss is high in HEV, whereas the Power loss in EV is very less.
- Therefore, Electric vehicle is more efficient as compared to Hybrid Electric Vehicle.