Week-4 Challenge WOT Condition Part-2
CHALLANGE BASED ON WOT CONDITION PART-2
AIM :
- What is the difference between mapped and dynamic model of engine, motor and generator? How can you change model type?
- How does the model calculate miles per gallon? Which factors are considered to model fuel flow?
- Run the HEV ReferenceApplication with WOT drive cycle. Change the grade and wind velocity in the environment block. Comment on the results.
- Keeping all other parameters same, compare the simulated results of hybrid and pure electric powertrains.
POWERTRAIN BLOCKSET :
Powertrain Blockset provides fully assembled reference application models of automotive powertrains, including gasoline, diesel, hybrid, and electric systems. It includes a component library for simulating engine subsystems, transmission assemblies, traction motors, battery packs, and controller models. Powertrain Blockset also includes a dynamometer model for virtual testing. MDF file support provides a standards-based interface to calibration tools for data import.
Powertrain Blockset provides a standard model architecture that can be reused throughout the development process. You can use it for design tradeoff analysis and component sizing, control parameter optimization, and hardware-in-the-loop testing. You can customize models by parameterizing components in a reference application with your own data or by replacing a subsystem with your own model.
QUESTION 1:
- What is the difference between mapped and dynamic model of engine, motor and generator? How can you change model type?
MAPPED MODEL :
Powertrain Blockset provides two types of combustion engine models: mapped and dynamic. Mapped engines represent macro engine behavior as a set of lookup tables (brake torque, fuel flow, air mass flow, exhaust temperature, efficiency, and emissions) as functions of commanded load and measured engine speed.
DYNAMIC MODEL :
Dynamic engines decompose engine behavior into individual component models that account for engine dynamics, most notably intake airflow and turbocharger dynamics.
You can switch between engine model types based on your application. Dynamic engine models are suitable for designing control, estimator, and diagnostic algorithms that depend on dynamic subsystem states, for example, in closed-loop AFR control algorithm development. Mapped engine models are suitable for analysis and design activities that do not require engine subsystem dynamic characteristics, for example, in engine and transmission powertrain matching analysis for fuel economy, emissions, and performance tradeoffs.
DIFFERENCE BETWEEN MAPPED AND DYNAMIC MODEL OF ENGINE :
| S.NO | MAPPED MODEL OF ENGINE | DYNAMIC MODEL OF ENGINE |
| 1 | Mapped engine models are suitable for analysis and design activities | Dynamic engine models are suitable for designing control operations. |
| 2 | Mapped engines do not require engine subsystem dynamic characteristics | These operates based on the engine subsystem levels. |
| 3 | Mapped model were used when we have engine data from a dynamometer or a design tool like GT-POWER. | Dynamic models are used when we are in need of more detailed dynamic model and have component-level data. |
| 4 | These are used in for quasi steady-state engine simulations. | These are used to analyze the impact of individual engine components on the overall performance. |
DIFFERENCE BETWEEN MAPPED AND DYNAMIC MODEL OF MOTOR :
| S.NO | MAPPED MODEL OF MOTOR | DYNAMIC MODEL OF MOTOR |
| 1 | The Mapped Motor block implements a mapped motor and drive electronics operating in torque-control mode. The output torque tracks the torque reference demand and includes a motor-response and drive-response time constant. Use the block for fast system-level simulations when you do not know detailed motor parameters, for example, for motor power and torque tradeoff studies. The block assumes that the speed fluctuations due to mechanical load do not affect the motor torque tracking. | To operate the dynamic model of motor we need the subsystem and detailed information of the motor such as current, voltage, frequency, efficiency, rpm etc, to perform the motor characteristics. |
DIFFERENCE BETWEEN MAPPED AND DYNAMIC MODEL OF GENERATOR :
| S.NO | MAPPED MODEL OF GENERATOR | DYNAMIC MODEL OF MOTOR |
| 1 | Specifications for battery torque,battery current,motor torque are to be mentioned to obtain the results | A detailed specifications to be given as input to obtain the results and plots other than the mapped model of generator. |
CHANGING THE MODEL TYPE :
- So if we are wishing to change the model type of motor or generator from mapped model to the dynamic model we need to do as the following:
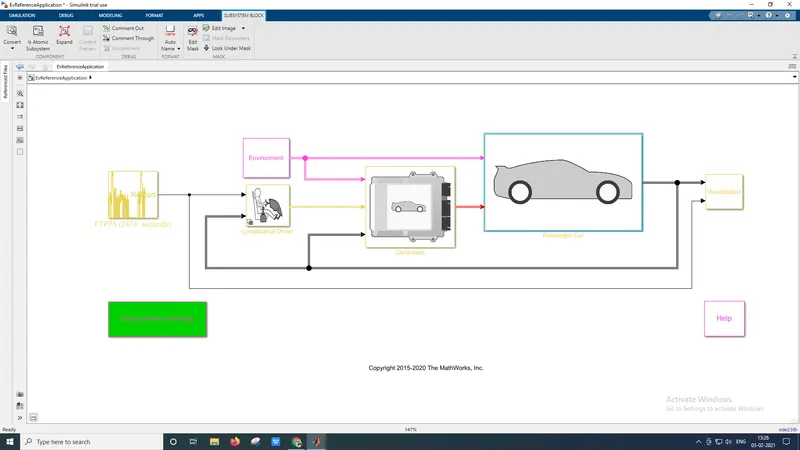
- First we need to go to the EV reference application>passenger car>electric plant>motor
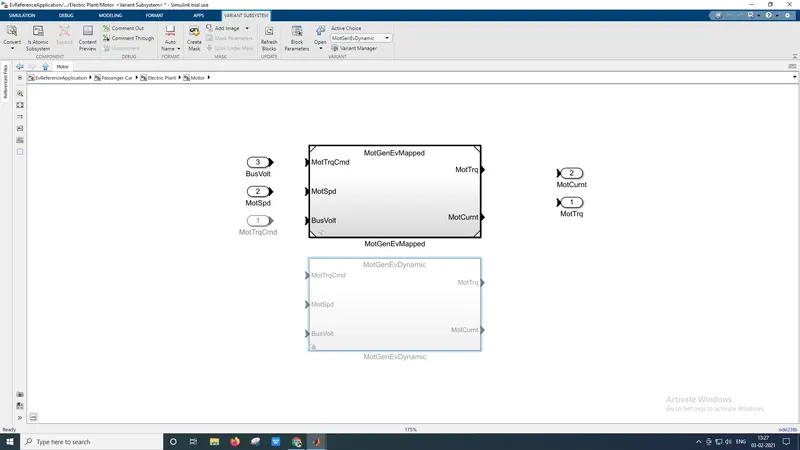
- Then we can find the mapped and dynamic models of the motor.
- So to change the motor from mapped to dynamic first select the dynamic model.
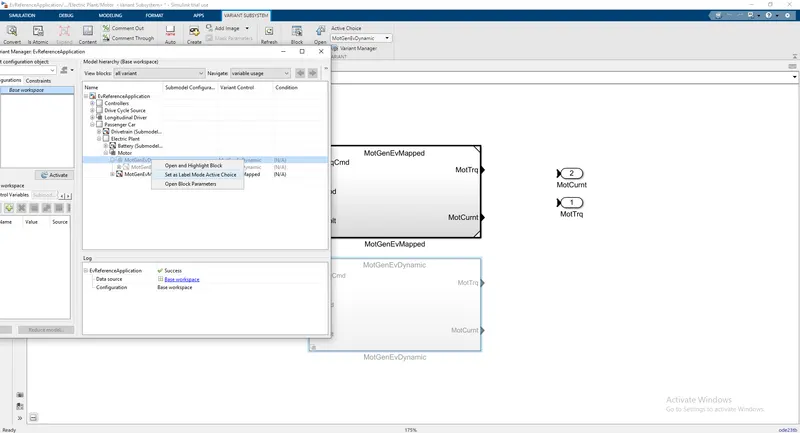
- Then in the varient subsystem select varient manager
- Then find the dynamic motor>right click on it>set as label mode active choice
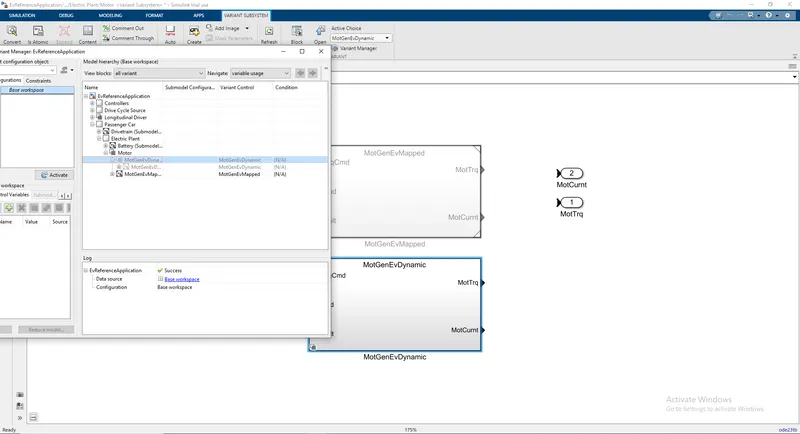
The changed model to dynamic is shown below :
QUESTION 2 :
How does the model calculate miles per gallon? Which factors are considered to model fuel flow?
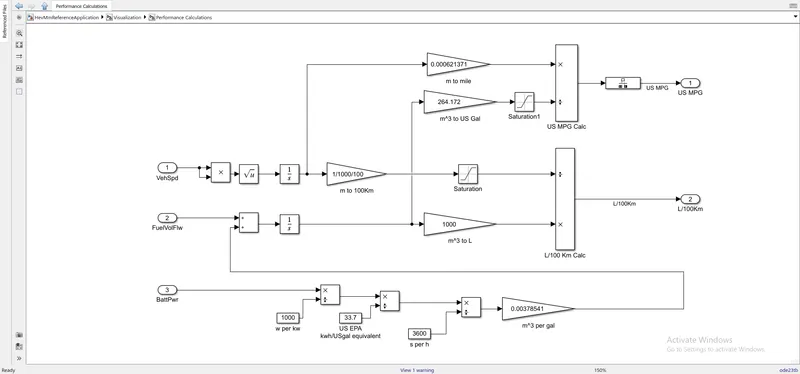
- To get the fuel flow in MPG we need to open the HEV reference application.
- Then in the visualization box open the performance calculations to find the conversion of the fuel,battery and velocity is used to covert to miles per gallon.
- So to convert the battery consumed to gallons we need to get the output of the battery in watts.Then we need to convert watts to kilowatts.
- Then this kilowatts of power is multiplied with the US EPA (US Environmental protection agency) and obtained value is multiplied with the sec per hour value and again obtained value is multiplied with the gain block of a constant to convert m^3 to gallons.
- The obtained value is added to fuel volume flow and on integration we get it converted to litres.
- The litres value is converted to US gallons.
- The vehicle speed is also converted from metre(m) to miles.
- Then at final these miles is divided by the US gallons to get MPG value.
MILES PER GALLON :
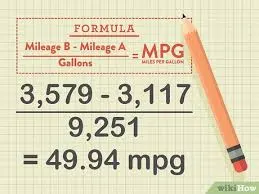
MPG, or miles per gallon, is the distance, measured in miles, that a car can travel per gallon of fuel. MPG is also the primary measurement of a car's fuel efficiency: The higher a car's MPG, the more fuel efficient it is.The U.S. Environmental Protection Agency, or the EPA, is the government agency responsible for certifying a vehicle's MPG figures.
A car's MPG can be inconsistent because it is affected by a number of different factors, so it is difficult to get an accurate measurement. For example, factors like traffic and road conditions can affect MPG in any given context. That's why the EPA runs tests over a standard set of courses, then averages the results to calculate a vehicle's official MPG.
Get the miles traveled from the trip odometer, or subtract the original odometer reading from the new one. Divide the miles traveled by the amount of gallons it took to refill the tank. The result will be your car's average miles per gallon yield for that driving period.
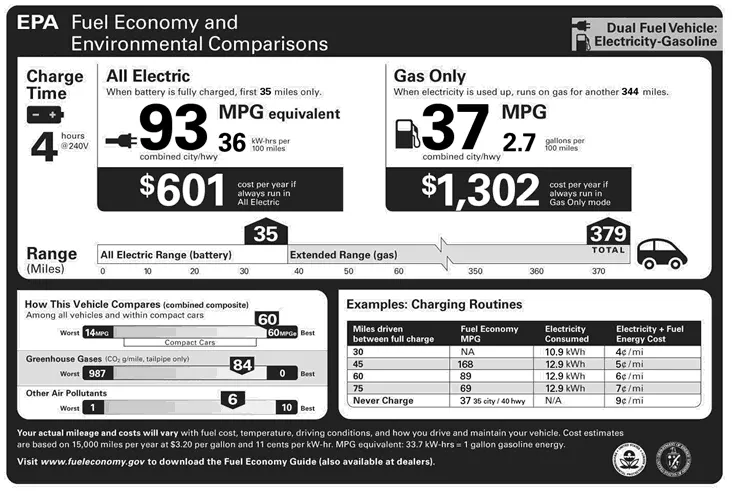
The below image shows the battery equivalent by Environment protection Agency (EPA) to the amount of gas consumption in MPH and shows the economy variation from both of them :
FACTORS INVOLVED IN CALCULATION OF fuel flow model :
- Vehicle speed
- Battery power
- Fuel flow
QUESTION 3 :
- Run the HEV ReferenceApplication with WOT drive cycle. Change the grade and wind velocity in the environment block. Comment on the results.
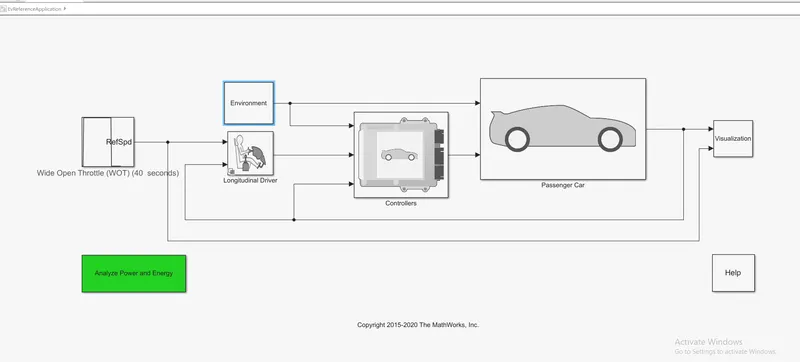
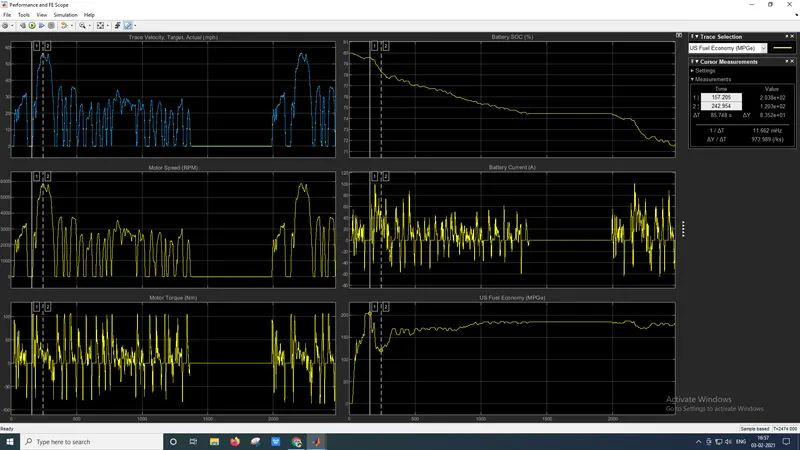
The below image shows the electric vehicle running under FTP drive cycle and the results were plotted which are shown below :
EXPLAINATION :
- First open the model Electric Vehicle reference application.
- To run the vehicle with WOT drive cycle open the drive cycle block then change the drive cycle to WOT.
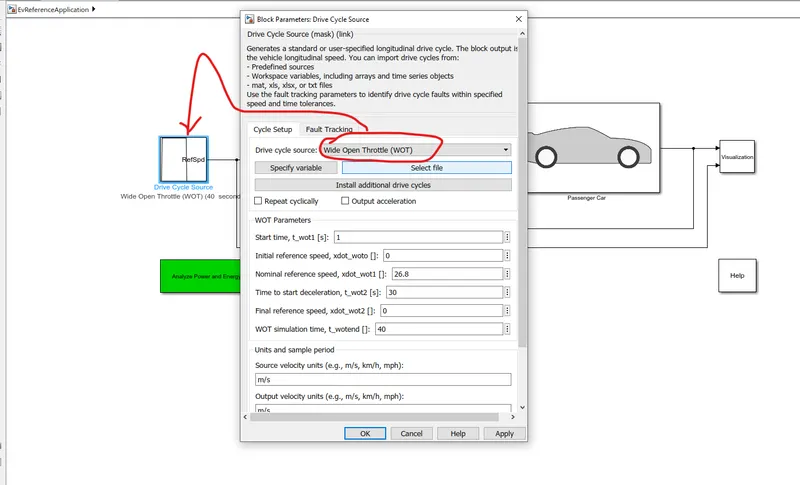
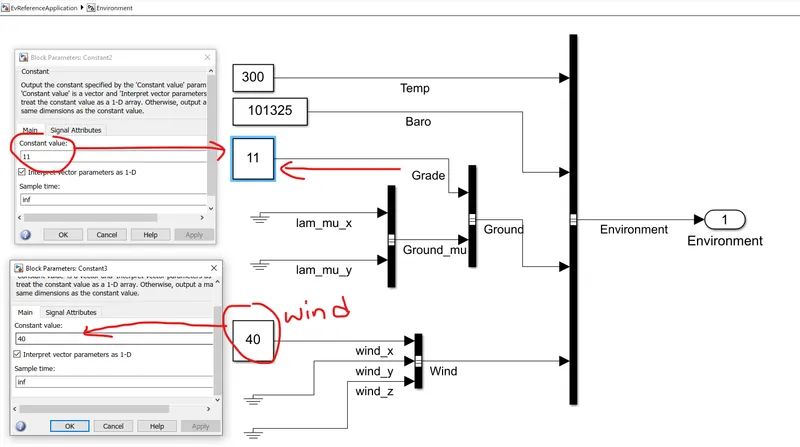
- Change the value of the grade to 11 and also wind velocity to 40 and then apply the results and these values are user defined.
- So after changing the values as mentioned above the results were plotted below.
OUTPUT :
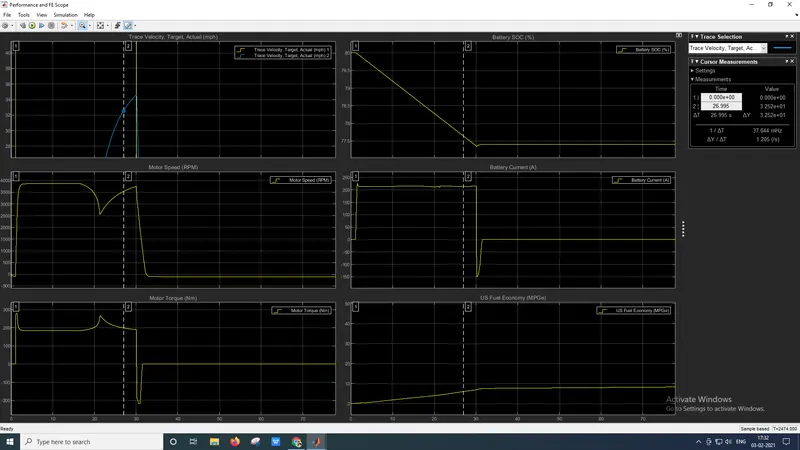
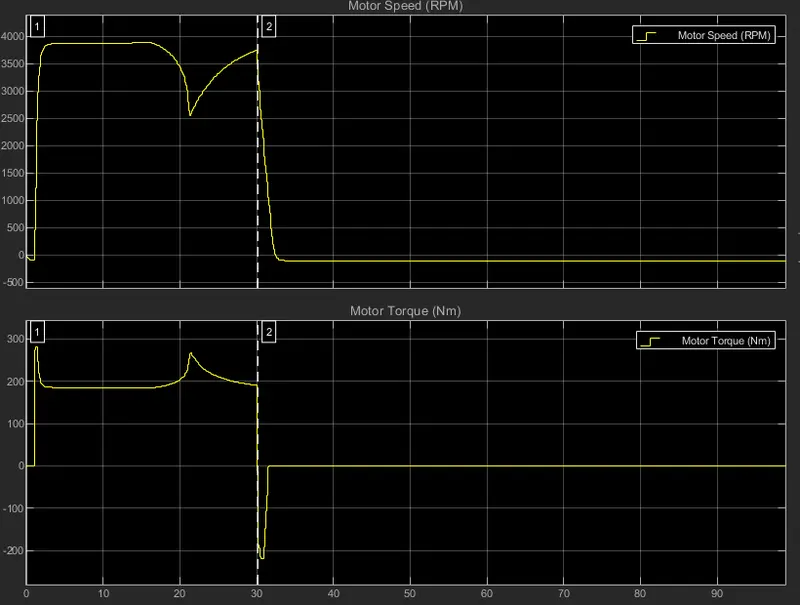
The plots of velocity, state of charge, motor speed(RPM),motor torque,US MPG economy,Battery current against time were plotted below.
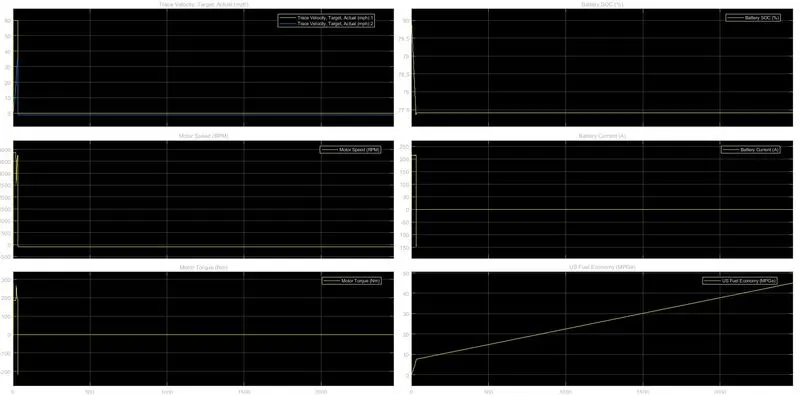
So from the above plot where vehicle is running under WOT condition with a gradeability of 11 and wind velocity of 40.
Target velocity :
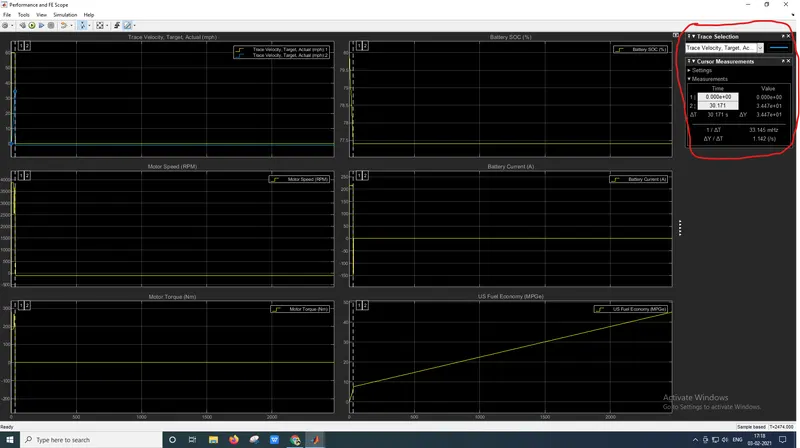
As the vehicle is running in WOT the speed has raised upto 35 mph instead of target velocity due to applied grade and wind velocity.So in 30.171 sec it can reach 34.4 mph speed from the plot and then for the rest of the time vehicle is at zero mph.
MOTOR SPEED AND TORQUE :
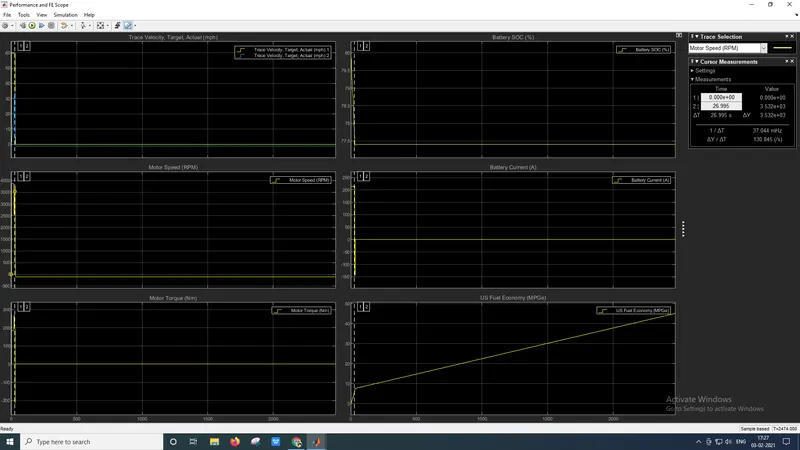
For the above defined limits the motor RPM is reached upto 3532 maximum RPM for WOT condition and when the vehicle is started to deccelerate the RPM of motor is finally reduced to zero and the time taken for this is 26.955 sec.
The motor torque for the same conditions like WOT, grade 11 and wind velocity 40 mph the maximum torque reached by the vehicle in time 30 sec is about 280 Nm.
STATE OF CHARGE (SOC) :
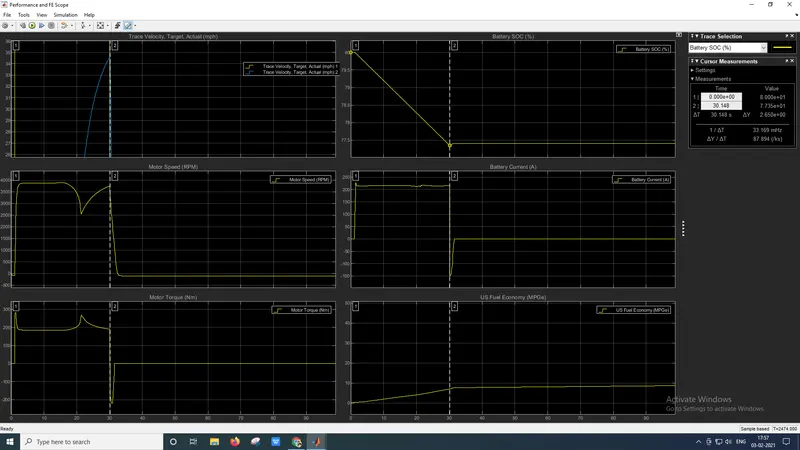
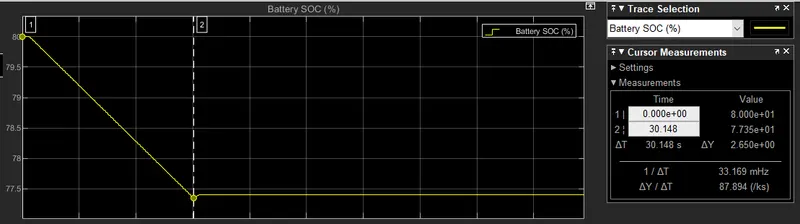
So as for considering the state of charge of the battery in the WOT condition of the vehicle in 30.148 sec the SOC of the vehicle is decreased about 2.65% i.e, from 80% to 77.5% and the discharge of battery is constant after the decceleration of the vehicle.
The below is the image showing the SOC% of the vehicle.
BATTERY CURRENT AND FUEL ECONOMY :
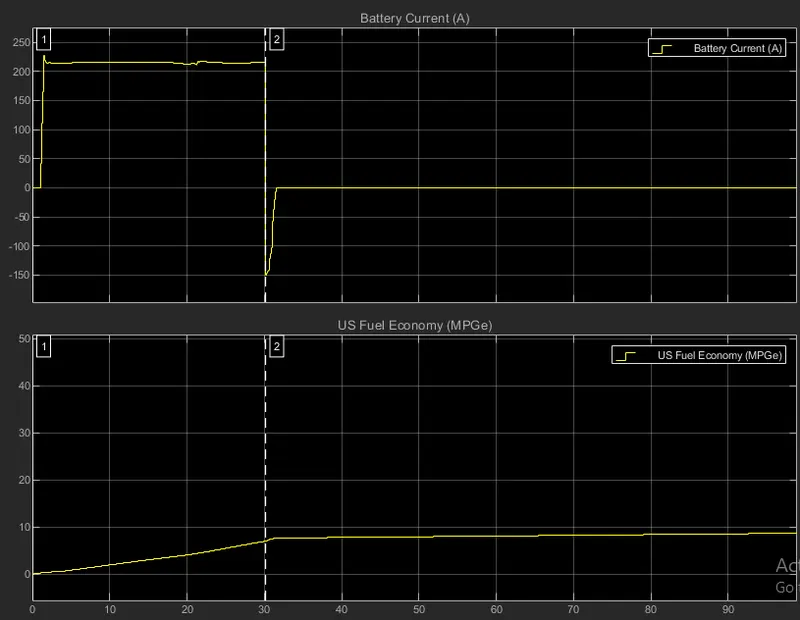
- So from the above image in the condition of WOT the battery current is rised to upto maximum 225 Amps and while decceleration the battery current is increased by 150 Amps.
- While considering the US Fuel Economy (MPG) till 30 sec the fuel economy is increased about 8 MPGe and then after decceleration the economy is constant.
QUESTION 4 :
Keeping all other parameters same, compare the simulated results of hybrid and pure electric powertrains ?
EXPLAINATION :
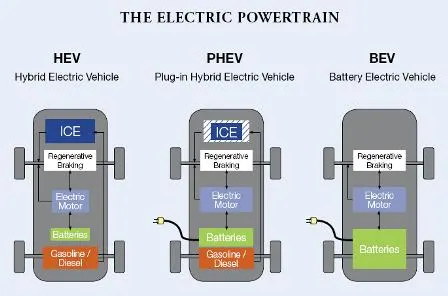
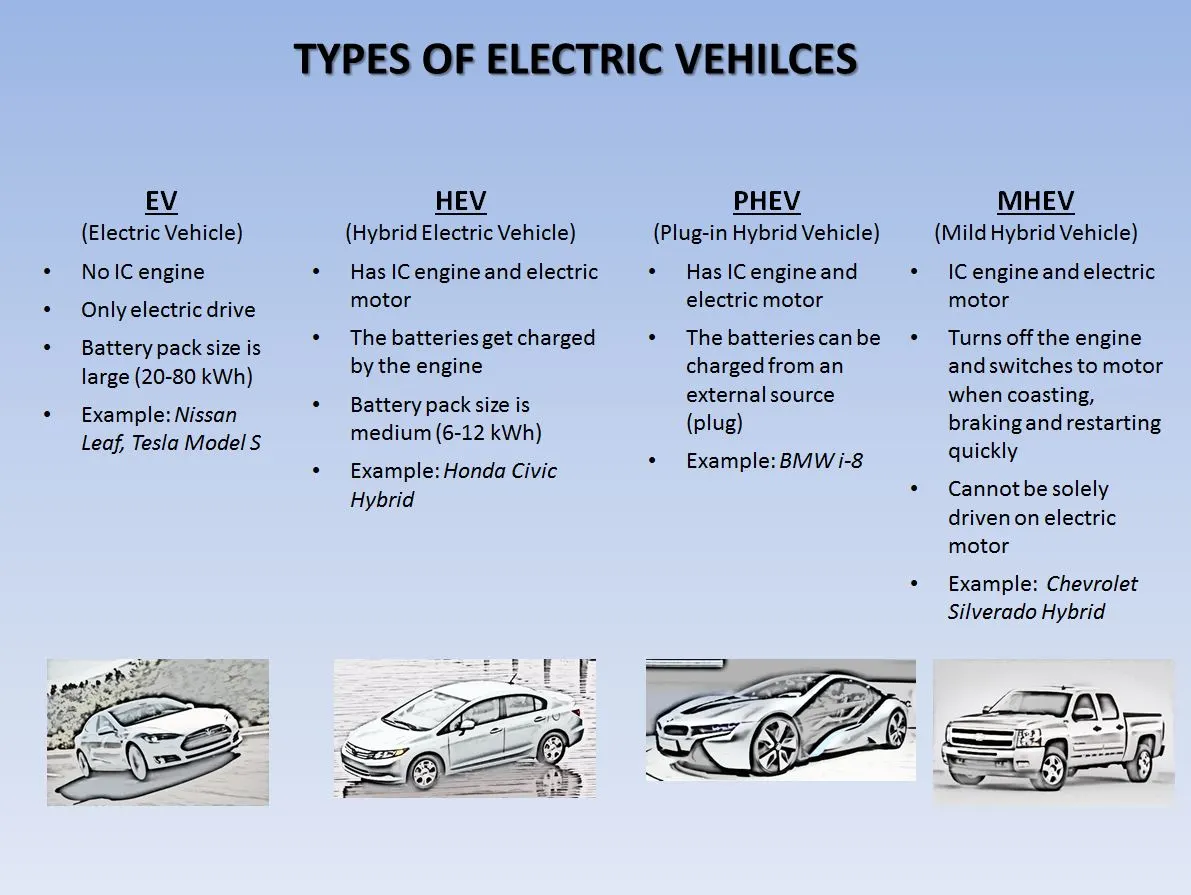
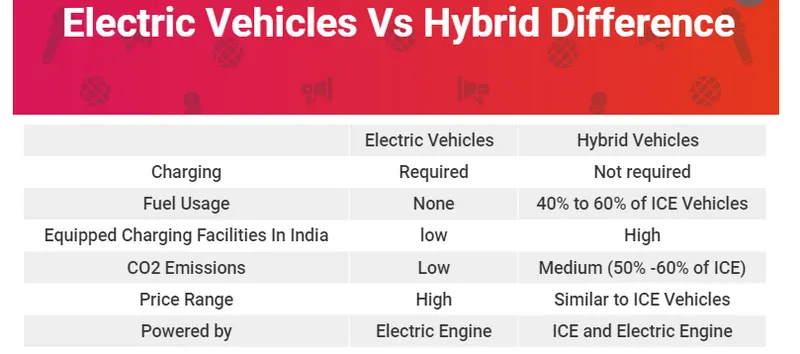
While starting the comparision between the HEV and pure Electric Vehicles there is lot much difference as in construction and also in the performance.
BATTERY ELECTRIC VEHICLE :
Battery electric vehicles (BEV) are what we popularly call electric vehicles that come with rechargeable batteries.
These batteries can be charged using external sources and EV chargers are classified according to the speed of charging — Level 1, Level 2 and Level 3 or DC fast charging. While these are levels for charging speeds, the charging standard can differ based on the make and model of EVs.
Level 1:
The Level 1 charging systems use a standard household outlet with an output of 120 Volts. With this type of charger, an EV can be charged in over eight hours to run for 75-80 miles. The chargers have the capability to charge most EVs available on the market.
Level 2:
The Level 2 charging are special systems with an output of 240 Volts. These types of charging systems are found at workplaces and public charging stations. The charging systems can charge an EV in about 4 hours to run for 75-80 miles.
Level 3:
The Level 3 also known as the direct current (DC) fast charging systems are the fastest charging solution in the EV market at the moment. The chargers can charge vehicles to run for 90 miles within 30 minutes.
Hybrid Electric Vehicles (HEV) :
Hybrid Electric Vehicles (HEVs) are equipped with both batteries and ICE that runs on fuel. The batteries in some way support the ICE by giving it the capacity of a conventional vehicle in terms of speed and run rate. These vehicles cannot be plugged into an external source for charging, hence, they completely rely on regenerative braking through fuels.
HEVs come in two variants — mild hybrid and full hybrid. Mild hybrids or micro hybrids rely on batteries and electric motors to power the vehicles to some extent. The ICE still plays a bigger role in powering the vehicle.
However, the vehicle also allows the engine to shut off completely when the vehicle stops for a brief period, therefore improving the fuel economy. On the other hand, full hybrids are installed with much larger batteries and electric motors that can power the engine solely for a short distance and low speed.
SIMULATION OF HEV :
EXPLAINATION :
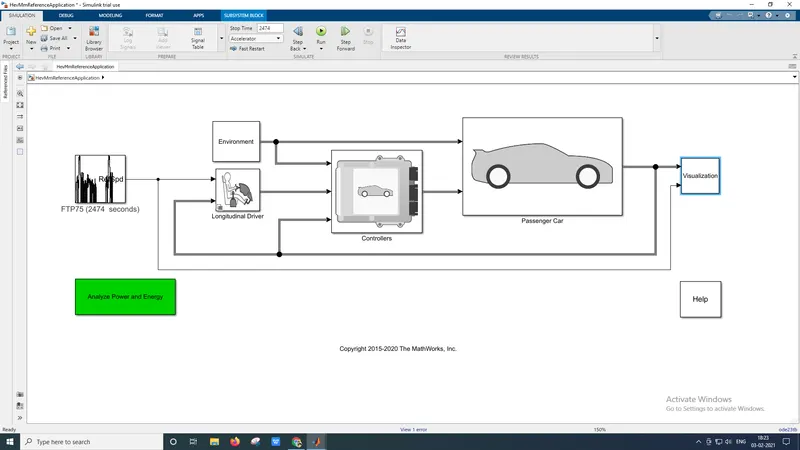
- In this type of model it has the blocks of FTP drive cycle, driver, environment, controllers, car and scope visualization.
- Inside the each blocks there are many sub locks that should be understood very well to get achievable results.
- FTP is a type of a drive cycle that a vehicle can travel for a particular simulation time.
- Environment block has the external factors like grade, wind, temperature, pressure.
- For driver there is an input of reference drive cycle and the actual speed from the vehicle.
- In the controller block there exists sub blocks as vehicle control module and electric control module as it is a HEV.
- In passenger car there are engine plant and electric plant.
- At final in the Visualisation block there exists all the plots in scope block.
OUTPUT :
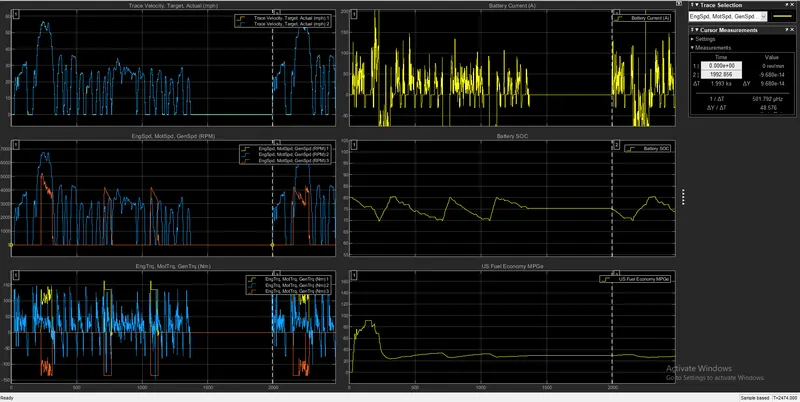
In HEV the starting torque can be achieved by the motor and the rest can be run by the IC engine at that time the vehicle will charge the battery again.
There will be huge fluctuations in the SOC of HEV as there both parts like IC engine and the battery operations.
At start of the vehicle there will be more change in the economy and after that there will be a normal fluctuation.
SIMULATION OF EV :
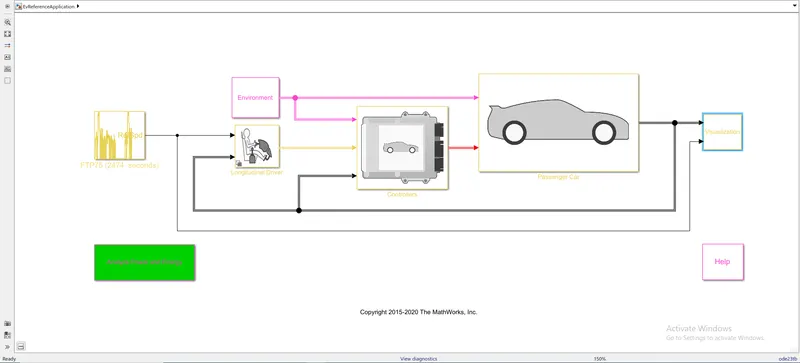
- In this also type of model it has the blocks of FTP drive cycle, driver, environment, controllers, car and scope visualization as mentioned in the HEV model from outside look.
- This also runned by the FTP drive cycle.
- Environment block has the external factors like grade, wind, temperature, pressure.
- For driver there is an input of reference drive cycle and the actual speed from the vehicle.
- In the controller block there exists sub blocks as electric control module only as it only EV.
- In passenger car there is only electric plant.
- In the scope block all the plots will be visualised.
OUTPUT :
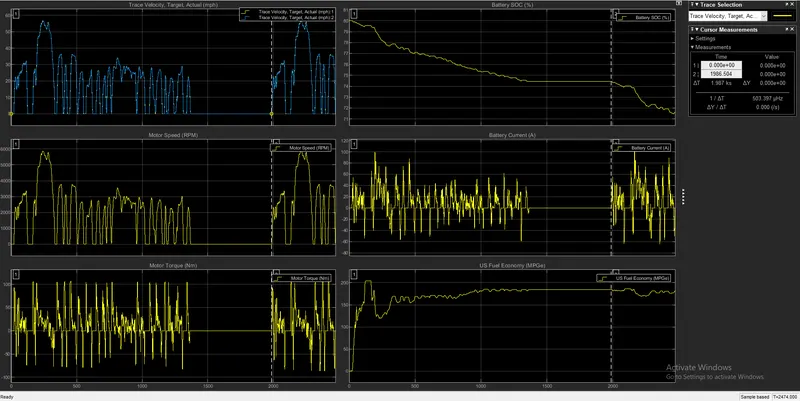
- As compared to the HEV the SOC for EV is continuosly discharge when compared to the HEV as in HEV there is both operations of IC and battery in HEV.
- As compared to HEV, EV has more fuel economy as it is totally runs on battery power and no fuel is supplied as in IC HEV.
- But if any grade is present at the final charge of the EV it cannot work with full efficiently as HEV, as in HEV it can be powred from IC engine.
- As compared to the HEV there are no emissions in this EV.
- An external charge is required once SCO of EV is zero but in HEV an IC can charge the battery of HEV.
CONCLUSION :
- Mentioned the difference between the mapped and dynamic model and shown to change the model type.
- Mentioned to calculate the miles per gallons in the model and factors included in calculating the fuel flow.
- Sucessfully simulated the EV model with WOT condition and also mentioned the grade,wind velocity in the environment block.
- Sucessfully compared the simulation results of HEV and EV.
GOOGLE DRIVE LINKS :
3RD QUESTION :
4TH QUESTION :