Week-4 Challenge WOT Condition Part-2
QUESTION (1)
What is the difference between mapped and dynamic model of engine, motor and generator? How can you change model type?
ANSWER
Mapped model of engine :- This type of model represents macro engine behaviour as set of lookup tables as functions of commanded load and measured engine speed. These are suitable for analysis and design activities that do not require engine subsystem dynamic characteristics.
Dynamic model of engine :- This type of model breaks down engine behaviour into individual component models that account for engine dynamics. These are suitable for designing control and diagnostic algorithms.
Mapped model of motor :- This type of motor operates in torque control mode. In this case the maximum motor power and torque is predefined. Here the output torque tracks a torque reference demand.
Dynamic model of motor :- This type of model represents an actual motor components itself. The working of this motor depends on the real time input.
Since this takes the real time input the simulation time is also more compared to mapped type.
Mapped model of generator :- This is similar to a mapped motor. Here also the inputs are either predefined or else taken from lookup tables.
Dynamic model of generator :- Similar to dynamic motor this also represents the actual generator components. And this works in real time and takes input values during simulation. This model takes more simulation time.
To change model type :-
Right click on the subsystem whose model type has to be changed.
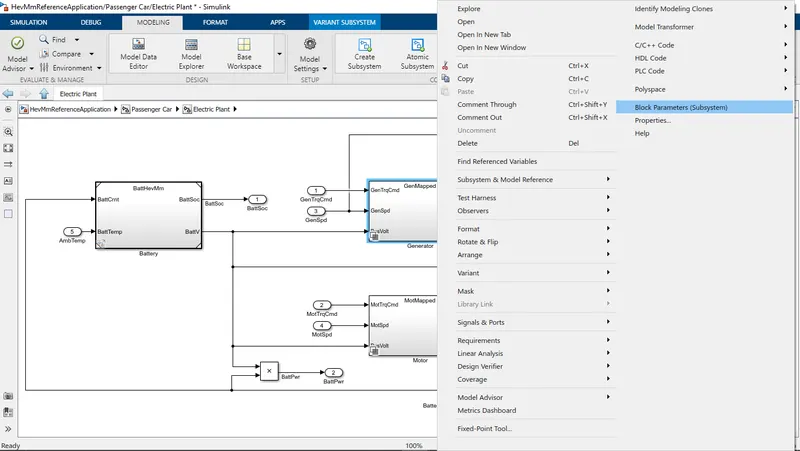
For example , if we want to change the model type of generator then right click on the generator subsystem block and then click on block parameters option as shown below,
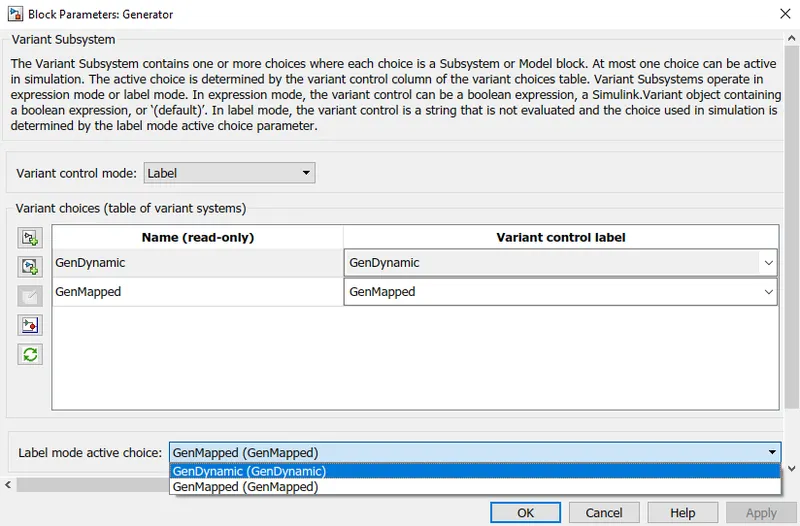
This will open a window where we can change the model type by clicking on the drop down menu corresponding to ‘Label mode active choice’ as shown below,
QUESTION (2)
How does the model calculate miles per gallon? Which factors are considered to model fuel flow?
ANSWER
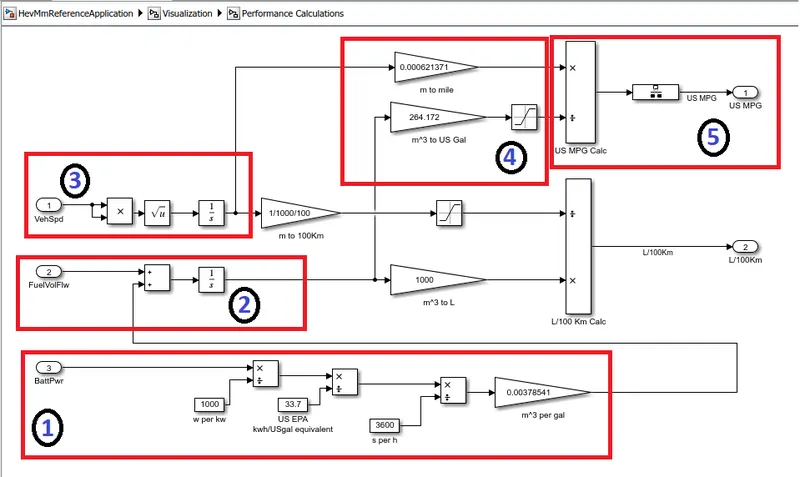
To calculate the miles per gallon , first of all the battery power has to be converted in terms of gallons. This is defined by United States Environmental Protection Agency(US EPA) as 33.7 kilowatt-hours of electricity is the equivalent to one gallon of gas.
Block diagram calculating miles per gallon is shown below,
CALCULATION 1
In this we can see that the battery power is first converted to kW and then to US gallons by dividing the battery power by 33.7.
Then this value is divided by 3600 to change it to per second unit.
Then the US gallon is converted to m^3 by multiplying 0.00378541.
CALCULATION 2
Then this value is added with the fuel volume flow used by the engine. Then the resulting value is integrated to get volume in m^3.
CALCULATION 3
Now we calculate the distance covered by integrating velocity value.
CALCULATION 4
Volume in m^3 is converted to US gallons by multiplying 264.172. This will give us fuel consumed in terms of US gallons.
Distance is in meters , to convert it to miles we multiply it to 0.000621371. This will give us the distance in miles.
CALCULATION 5
After calculating the fuel consumed and the distance covered , we will divide distance by fuel consumed , which will give us fuel economy in miles per gallon.
Factors considered to model fuel flow are fuel flow volume value which is calculated by multiplying fuel volume flow rate with fuel injector pulse width multiplier(for closed loop Air-Fuel Ratio control).
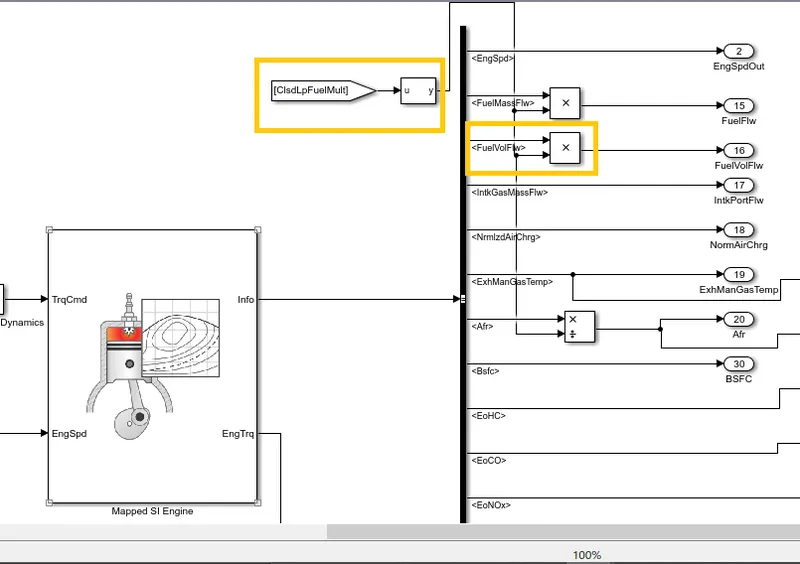
The fuel volume flow rate is shown as a graph Vs commanded torque and engine speed.
This graph is shown below , it can be accessed by right clicking on the mapped SI engine block and selecting fuel tab inside that window as shown below,
QUESTION (3)
Run the HEV Reference Application with WOT drive cycle. Change the grade and wind velocity in the environment block. Comment on the results.
ANSWER
First of all we have to change the drive cycle to Wide Open Throttle , this can be done by opening drive cycle source block parameters as shown below,
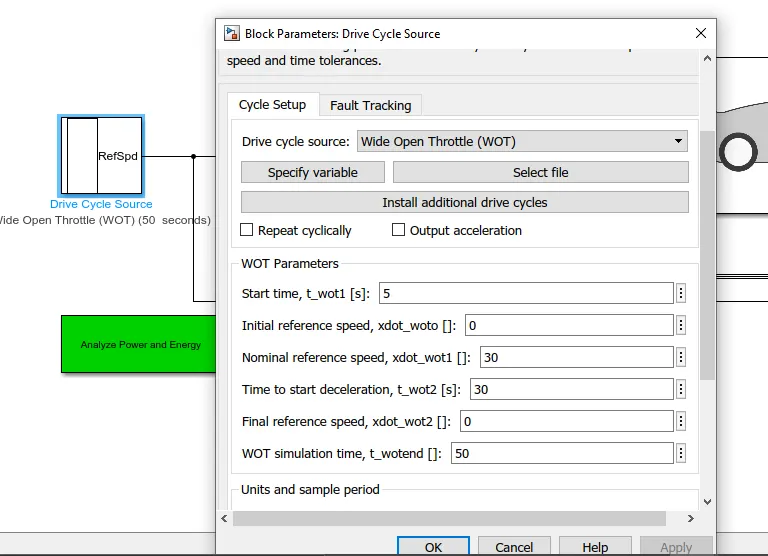
Here we specify all the data related to WOT condiion.
Then we have to change the grade and wind velocity. For this we have to open the Environment subsystem block.
Inside the subsystem we need to input the required drag and wind velocity values, in this case drag is given as 10 and wind velocity as 7, as shown below,
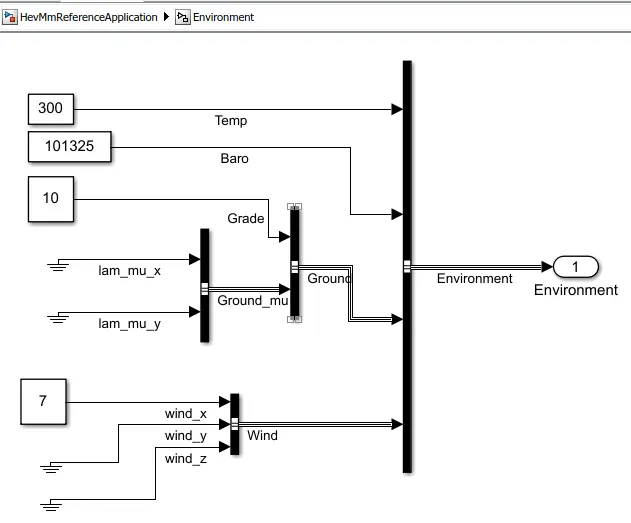
Now run the simulation.
After simulation is completed open the visualization block and result scope inside this subsystem.
This will open the result of this simulation as shown below,
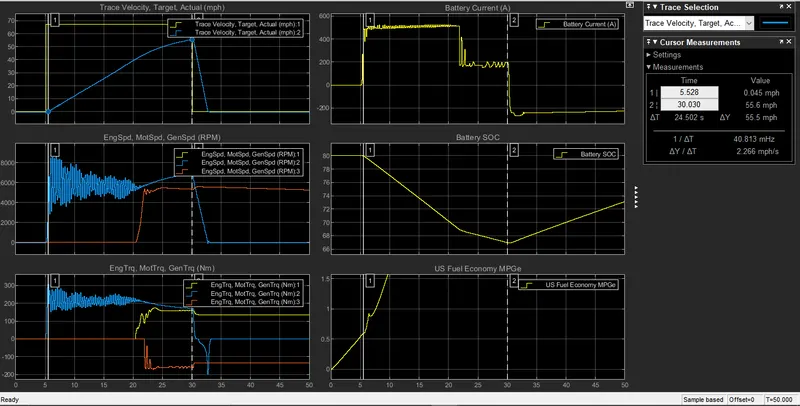
From the first graph , which is the velocity graph we can see that the acceleration time taken to reach the speed of 55mph is 24 seconds. This acceleration time is very high compared to when there is no drag or wind velocity.
In the second graph , which shows us the engine,motor & generator speed , we can see that the generator starts once the SOC is going below 70% which can be seen in the Battery SOC graph. So in this Battery SOC graph we can see that the depletion rate below 70% is reduced because the generator started operating and the battery is getting charged simultaneously.
And once the deceleration starts after 30 seconds we can see that regenerative braking begins and the motor torque goes negative , which can be seen in the third graph showing the torque values.
QUESTION (4)
Keeping all other parameters same, compare the simulated results of hybrid and pure electric powertrains.
ANSWER
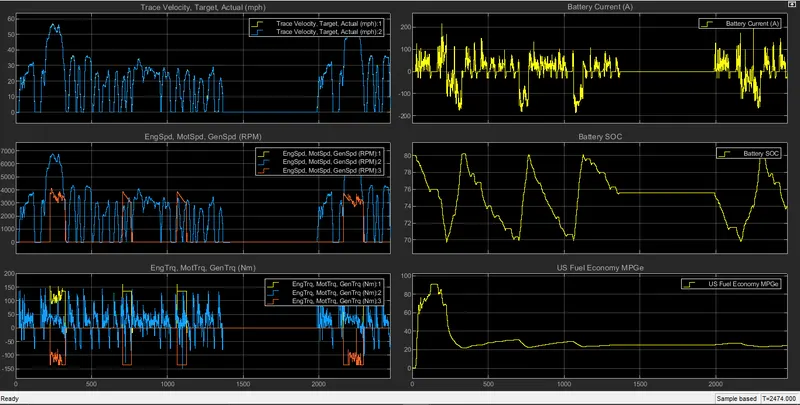
Simulated result of hybrid electric vehicle is shown below,
Simulated result of pure electric vehicle is shown below,
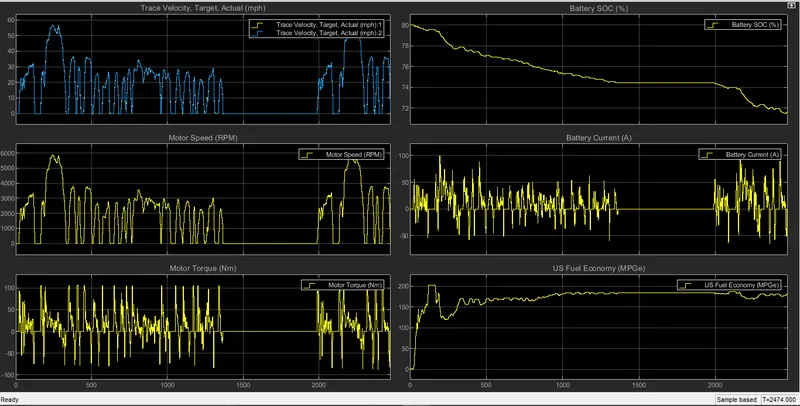
Here both the simulations are done with FTP 75 drive cycle and all other parameters kept same.
On comparing the two results , the most noticeable difference is batteries State Of Charge(SOC). in a HEV we can see that the battery on reaching SOC 70% it gets recharged by the engine by using a generator till it reaches 80% and this process repeats. But in case of a pure EV the SOC continue to deplete till its empty. This happens in an EV because the only way to recharge the battery is by plugging in the vehicle. There is regenerative braking in an EV but the change in SOC caused by regenerative braking is quite small compared to recharging done by the generator in a HEV.
Another major difference is fuel economy. The equivalent fuel economy of an EV is in the range of 180 MPGe where as the HEV is only able to achieve an economy of 40 MPGe. This shows us how fuel economic it is to drive an EV compared to HEV’s.