Week-4 Challenge WOT Condition Part-2
1. Difference between mapped and dynamic model of engine ,motor and generator
| MAPPED MODEL | DYNAMIC MODEL |
| static , pre-defined value | dynamic, not a pre-defined value |
| Run-time of the model is faster than dynamic model | Run-time is slower than mapped model |
| Doesn't run real time parameter | runs in real time parameter |
| less accuracy | more accuracy |

procedure to change model:
> select the vehicle type in powertrain blockset.
>Then simulink will open
>change the variable label mode choose mapped or dynamic.
2. from powertrain blockset
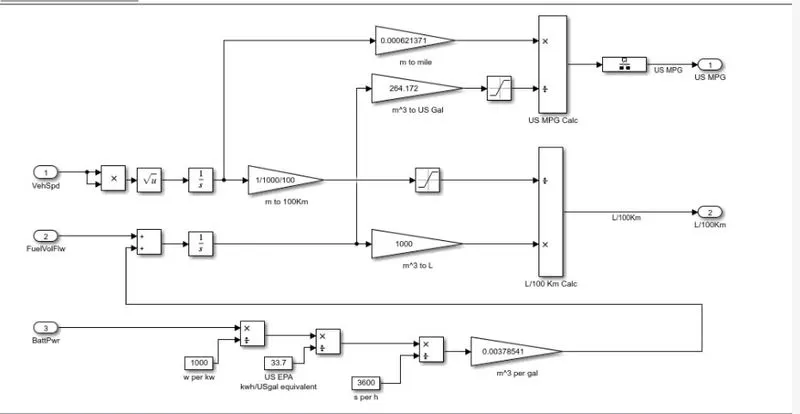
IN 1 AND 2 (VEHICLE SPEED AND FUEL FLOW)
SPEED =DISTANCE/TIME
TO know distance s*t here time is changing , so if we take integrate of speed with time
flow meter and output battery is multipled and the result will be in mass flow rate so that means kg/sec next it is integrated . after that 1/1000 is multiplated to convert the output in litres.
the two result is compared and the final output will be amount of litre for 100km run.
battery:
the battery power and 1000 kW are multiplied result in KWH
then it is multiplied with us equivalent result in KWH/gal and it is multiplied with 3600 and the output will be in m^3 per gal
which will be given as input to the flow meter.
CALCULATING MILES PER GALLON:
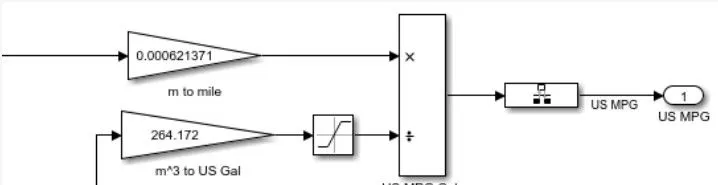
inverse laplance transform of vehicle speed (6.21371*10^-4), inverse laplance transform offlow meter (264.172 m^3) is intergrated .both are conbined and equivalent gallon is futher divided results in miles per gallon.
3.
.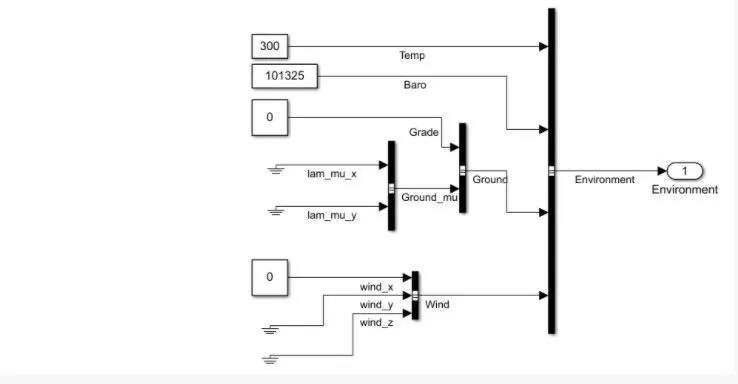
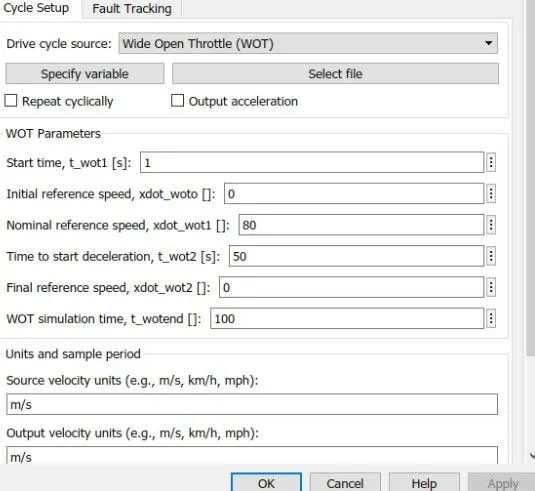
WOT grade value HEV is 0 in default it changed to 8
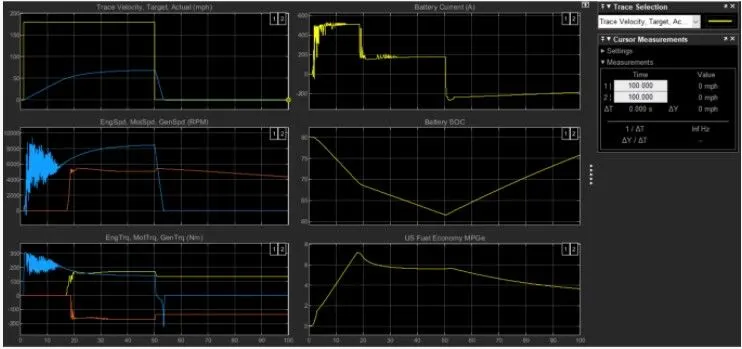
PLOT 1:(velocity vs mph)
speed achieved 67mph not able to achieve 80 mph
acceleration time 44 sec
decleration time 5sec
PLOT 2:(ENGINE SPEED,motor speed,generator speed)
max engine speed:4676rpm
max motor speed:8100 rpm
max generator speed:12855 rpm
PLOT 3:(motor & engine& generator torque)
max torque of motor:206Nm,max engine torque:140Nm,max generator torque:48 Nm
PLOT 4:(battery)
Ipeak during charging=-151.5A
Ipeak during discharging=167.6A
PLOT 5:(soc)
decreased from 60 to 26% in timeperiod of 49.3sec
PLOT 6:(fuel economy)
max miles car can run per gallon =17.9 miles
CONCLUSION :
outcomes of 6 grade compared with 0
top speed cant able to achieve.
fuel economy is halfed.
soc discharge is high.
4,HEV and EV
parameter same for both hev and ev
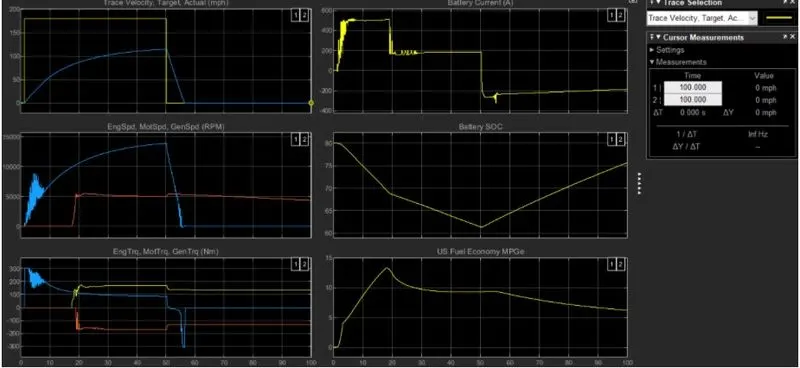
HEV PLOT
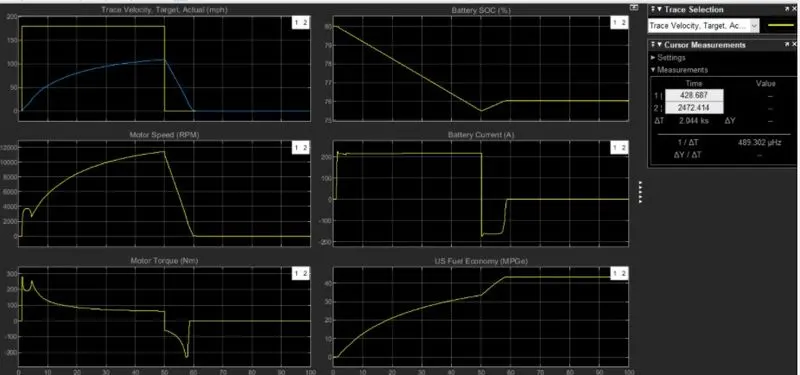
EV PLOT:
comparation of plot:
| PLOT | 1 | 2 | 3 | 4 | 5 | 6 |
| HEV |
speed-80mph acceleration time-16.7 sec deceleration time-6.2 sec |
motor speed-9497rpm | torque-138Tm |
charging I- -150A discharging I-163A |
soc-60-39% decreases | fuel economy-46miles |
| EV |
speed-10.8mph acceleration time-50sec deceleration time- 9.8sec |
motor speed-1123rpm | torque-260Tm |
charging- -173A discharging-216A |
soc=80 to 75% decreases | fuel economy-20miles |
CONCLUSION:
efficiency of ev is higher than hev.(terms of fuel consumption)
top speed achieved is higher in hev compared to ev.
motor speed greater in hev rather than ev.
charging rate of the battery is higher than hev
ev produce zero emission