Week-4 Challenge WOT Condition Part-2
WOT CONDITION PART-2
AIM:
- To discuss what is the difference between mapped and dynamic model of engine, motor and generator. To check how can we change model type.
- To see how does the model calculate miles per gallon. Which factors are considered to model fuel flow.
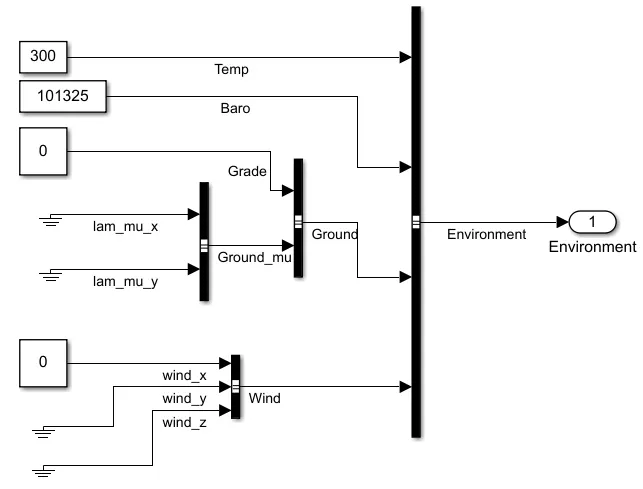
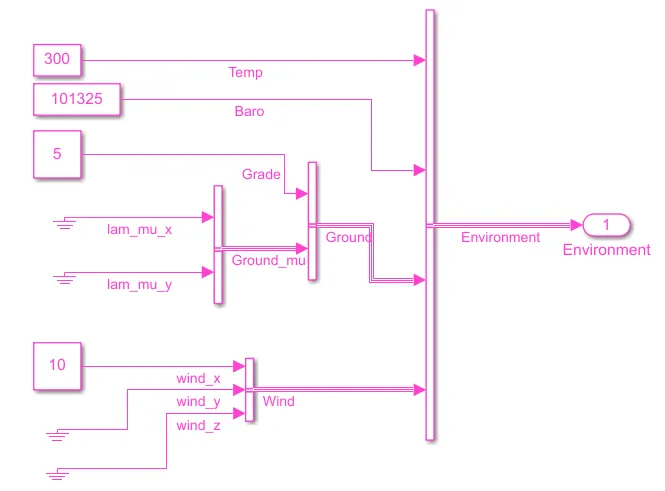
- To run the HEV Reference Application with WOT drive cycle and to change the grade and wind velocity in the environment block and comment onthe results.
- Keeping all other parameters same, compare the simulated results of hybrid and pure electric powertrains.
STUDY-1:
Mapped Engine:
Model uses a set of steady-state lookup tables to characterize engine performance.The tables provide overall engine characteristics, including actual torque, fuel flow rate, BSFC, and engine-out exhaust emissions.
Dynamic Engine:
Model decomposes the engine behavior into engine characteristics that are separated into lower-level components. By combining components in this way, the models capture the dynamic effects.
Mapped Motor:
It is also known as static motor where the model runs based upon look up tables or some predefined input values. Simulation using this model is fast than the dynamic model.
Dynamic Motor:
This model represents the real time working of the model. it represents the actual model of the equipment. It does not take any predefined values as input. It takes the real time values as input and gives the output continuously. Simulation using this model is slow compared to Mapped Motor model.
Mapped Generator:
This is also similar like the mapped motor, where the input values for the generator block are predefined or it takes from the lookup tables. Here also simulation time is less when this model is used.
Dynamic Generator:
This model also represents actual generator which work in real time environment. Here the input values are not taken from look up tables, the output values are calculated continuously according tothechanges in input values. Here also simulation time is more compared to mapped generator.
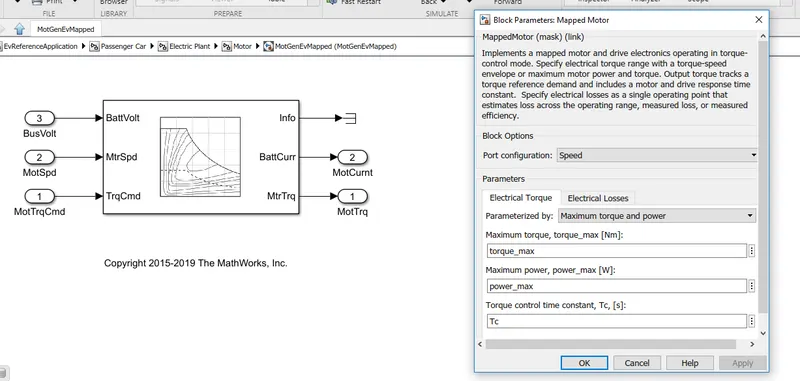
Dynamic Generator:
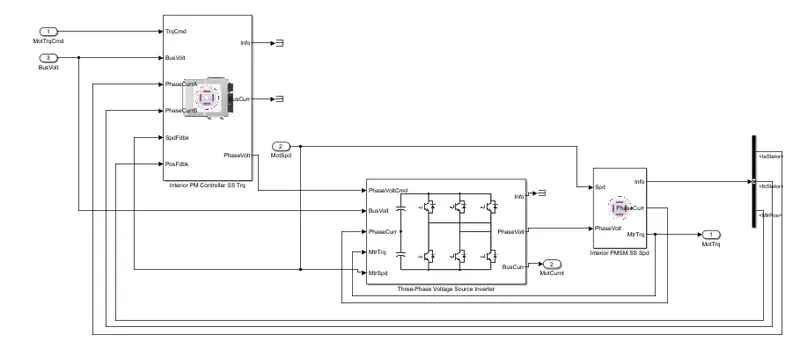
To Change the model from dynamic to mapped.
- In the reference application model where ever the mapped model is used, below that a dynamic model is also present and its connected out since the connections are given to mapped models.
- Open motor block which contains both mapped and dynamic blocks system.
- By default, mapped motor is selected.
- To change mapped to dynamic blockset, we need to right click on the screen and select variant.
- Then select label more active choice. Then select MotGenEvDynamic.
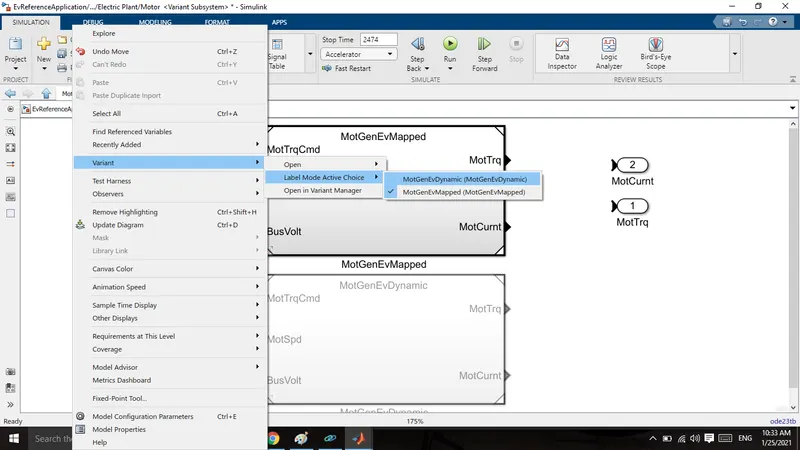
STUDY-2:
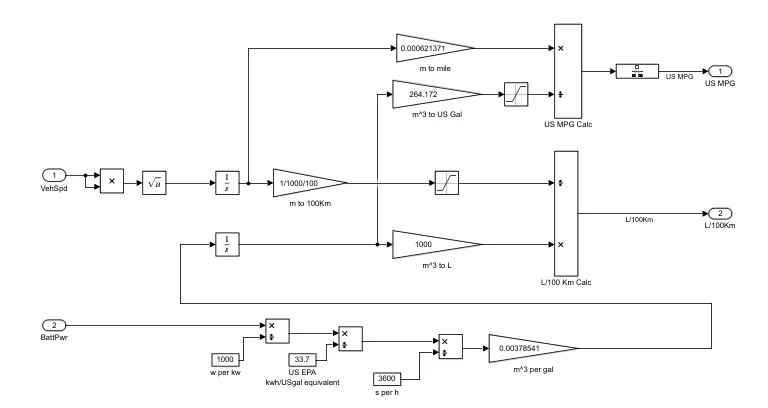
- Open EVreference application model. Under visualisation block we can see various blocks used for calculation.
- Open performance calculation block, which has vehicle speed and battery power as inputs.
- MPG is different from MPGe. MPGe means miles per gallon equivalent. MPGe is calculated in the model with the help of battery power and vehicle speed.
- Vehicle speed is multiplied itself and square rooted it. Then divided with time and converted m to mile.
- Then it is divided with gallon.
- Battery power is divided by 1000 and then divided with 33.7. Then it is converted to S per hour and then converted to m^3 per gal.
- The value is converted into gallon and used as MPG after dividing miles with galllon.
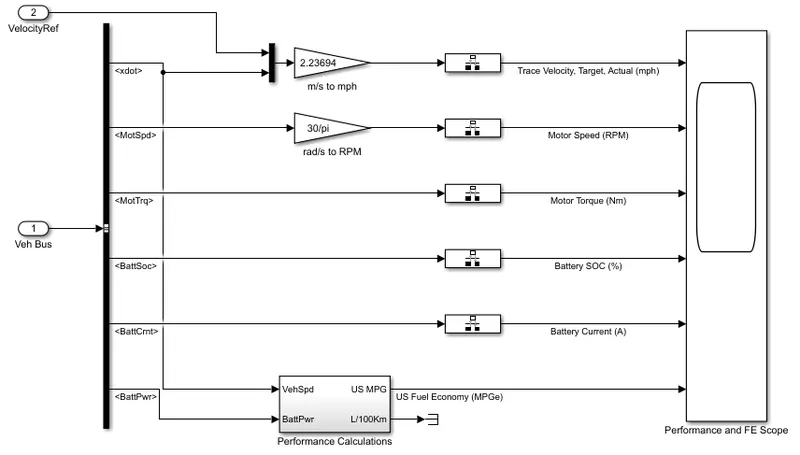
STUDY- 3:
To Run HEV Reference model in WOT Drive Cycle
- Open the HEVReference apllication.
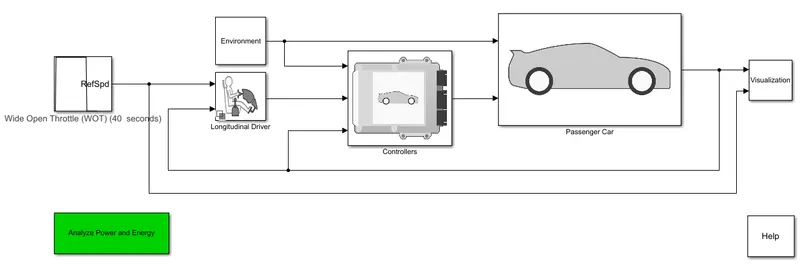
- It contains various subsystem like environment, logitudinal driver,passenger car,visualisation etc.
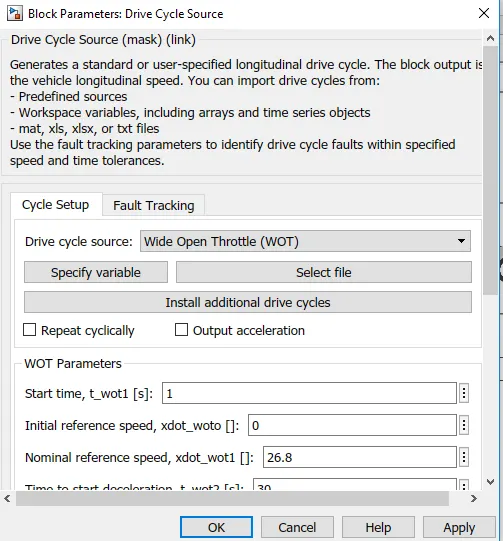
- By default it is FTP75 drive cycle with 2474 seconds. Change it to the WOT drive cycle with WOT simulation time as 100 seconds.
- Now run the application.
RESULT:
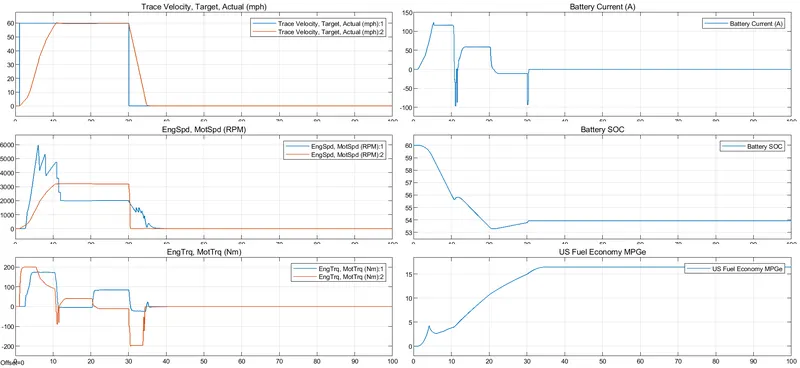
HEV model with grade and wind velocity:
RESULT:
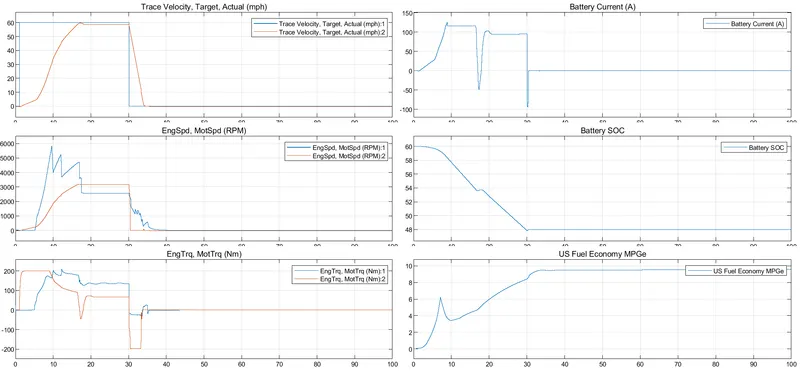
with the increase in grade and wind velocity.
- Peak velocity achieved is reduced as gradient force and aerodynamic force becomes dominat.
- Fuel economy is also reduced because the distance traveled isreduced due to external forces.
- Deceleration time is reduced so batter recharging capacity is also reduced.
- Battery SOC atthe end of WOT acceleration is similar but during deceleration battery is charged more is the grade and wind velocity is less.
STUDY-4:
To Compare the Results of Hybrid And Pure Electric Vehicle
EVReference Application:
- Open EVReference Application.
- It consists of driven cycle, environment, longitudinal driver, controller, passenger car and visuals subsystem.
- Run the simulation.
Main Model:
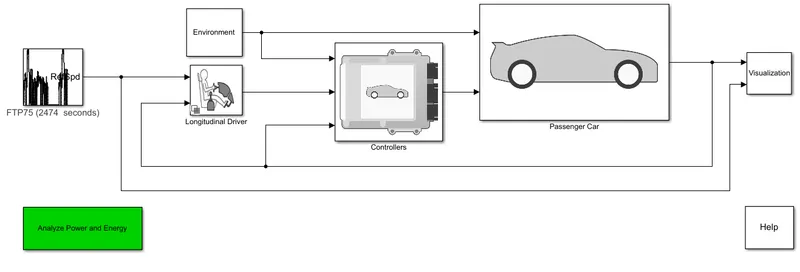
RESULTS:
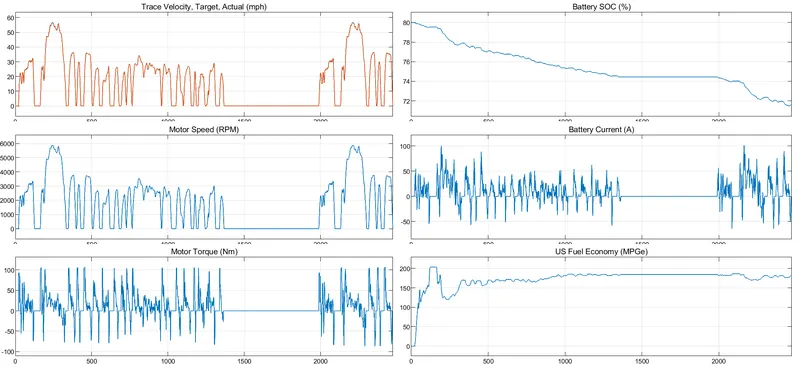
- In the first plot shows, the drive cycle.
- Second plot shows battery SOC.The SOC falls from 80 to 70 for this drive cycle.
- Third plot shows motor speed. It change continuously increases and decreases according to drive cycle.
- Fourth plot shows battery current.It change continuously increases and decreases.
- Fifth plot shows motor torque.It change continuously increases and decreases according to drive cycle.
- Sixth plot shows fuel economy.
HEVReference Application:
- Open HEVReference Application.
- It consists of driven cycle, environment, longitudinal driver, controller, passenger car and visuals subsystem.
- Run the simulation.
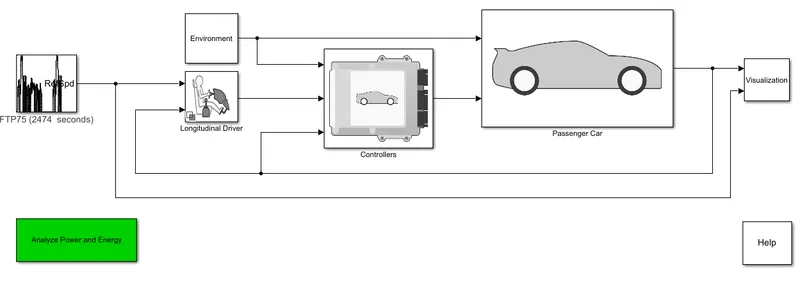
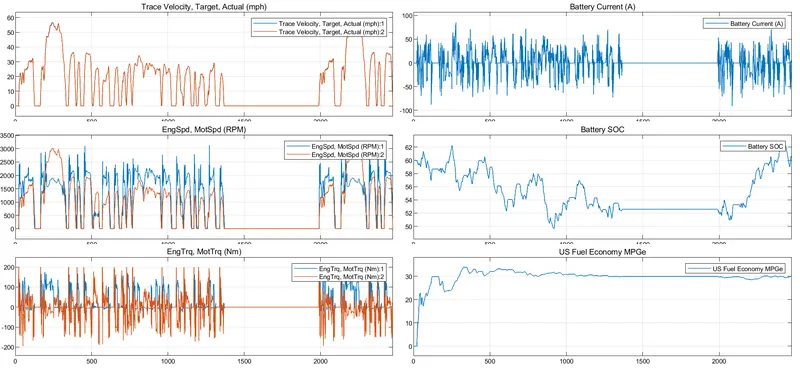
- In the first plot shows, the drive cycle.
- Second plot shows battery current.It change continuously increases and decreases throughout the drive cycle.
- Third plot shows motor speed and Engine speed. It change continuously increases and decreases according to drive cycle.
- Third plot shows battery SOC.The battery decreases and increases throughout the drive cycle.
- Fifth plot shows motor torque and engine torque.It change continuously increases and decreases according to drive cycle.
- Sixth plot shows fuel economy.