Week-4 : Basic Calibration of Single cylinder CI-Engine
Aim: Explore the tutorial single cylinder CI Engine Model and compare it with the Single cylinder SI model.
Engine Layout :
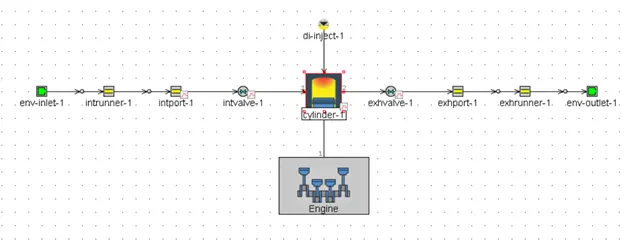
a . Comparison between SI and CI
SI CI
1. It works on OTTO Cycle principle 1. It Works on the DIESEL Cycle principle
2. Uses petrol 2. Uses diesel
3. Operates at a lower compression ratio 3. Operates at a higher compression ratio
within range of 6 to 10 within range of 16 to 20
4. High-Speed Engines 4. Low-Speed Engines
5. Lower thermal efficiency 5. Higher thermal efficiency
6. External ignition source is required 6. Self Igniting
- spark plug
b. Comments on the following :
When running CI engine at 1800 RPM
b.1 - BSFC - CI Engine = 221.3 g/kW-h
b.2 - BSFC - SI Engine = 239.2 g/kW-h
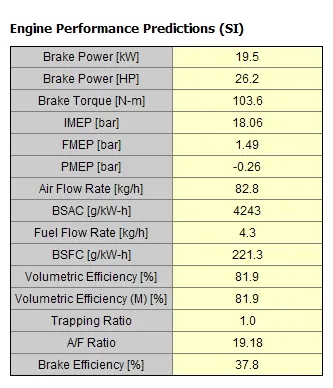
It is evident from the above performance table that the CI engine has a lower BSFC as compared to the SI engine. This is due to the reason that diesel engine run lean and petrol engine run rich.
c. Exhaust Temperatures
Exhaust Temperature- CI = 1045
Exhaust Temperature- SI = 1162
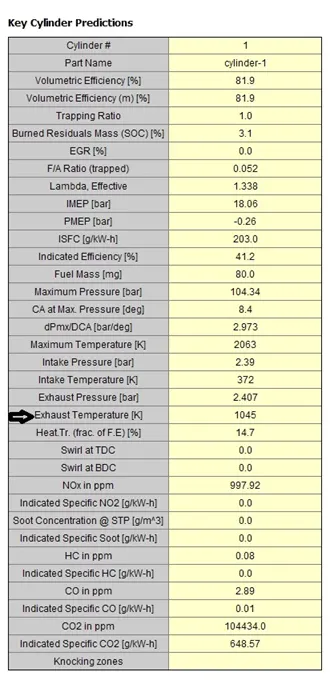
AF ratio has an influence on the engine and as well as exhaust gas temperature. In the case of SI, the engine mixture is ignited very quickly due to the presence of a spark plug which results in a much quicker burn, whereas in diesel engine mixture is self-ignited which depends on the right conditions of the mixture which leads to slower burn. Also it could be understood here that since SI engine operates at rich or stoichiometric conditions which eventually results in higher exhaust gas temperature as compared to CI engine which runs on lean conditions.
d. AF ratios
CI Engine - AF = 19.18
SI Engine - AF = 14.50
As it has known that CI engines run on lean AF mixture and SI engine on rich Stoichiometric mixture.
e.Changing MFB50
MFB = 35 MFB = 50
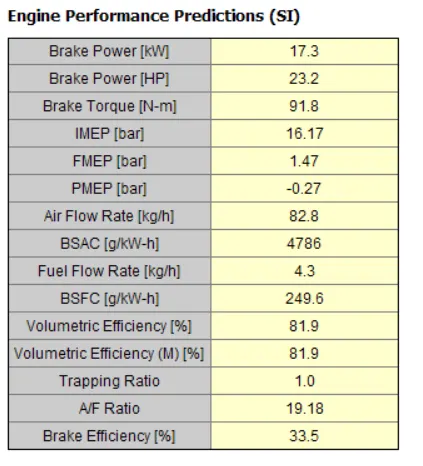
Advancing MFB timing results in increased BSFC, power output and brake efficiency. This is quite intuitive because most the fuel is burned during expansion stroke thus leading to lower power and efficiency.
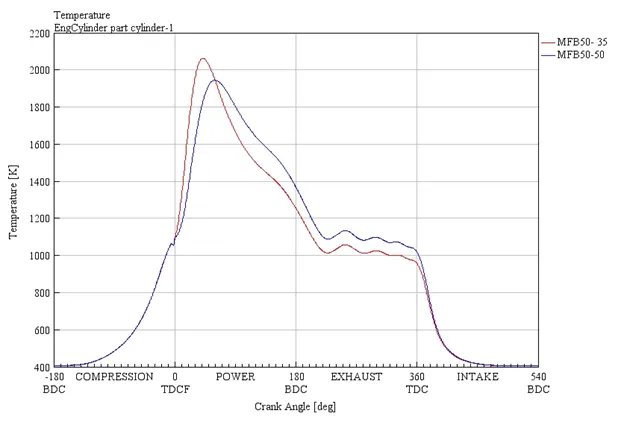
The above temperature plots depict how the combustion process is delayed when MFB50 timing is altered.
PV diagram for varied MFB timings :
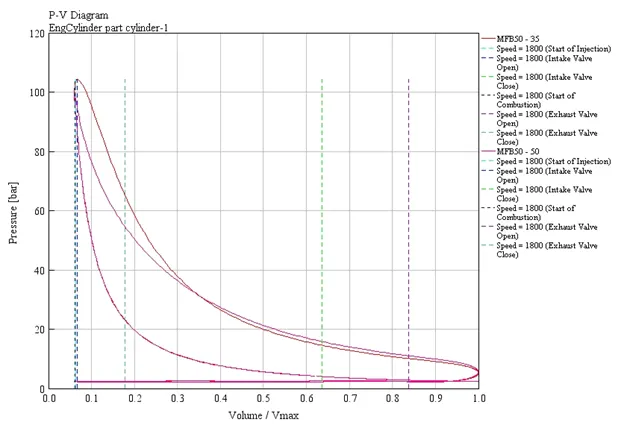
As it can be seen for the MFB50 - 50 case, the area under the PV diagram is relatively lower as compared to the MFB50 - 35 case which is the cause for lower power output and efficiency.