Week - 4
AIM:- Implement control logic of a “washing machine” using Stateflow as per given sequence:
- If the power supply is available, the system gets activated
- If the Water supply is not available, stop the process & indicate through LED
- Soaking time should be 200s followed by Washing time of 100s.
- Then rinsing happens for next 20s & dryer runs for 50s
After all the processes have completed turn on the finished LED
EXPLAINATION:-
The flow chart is given below
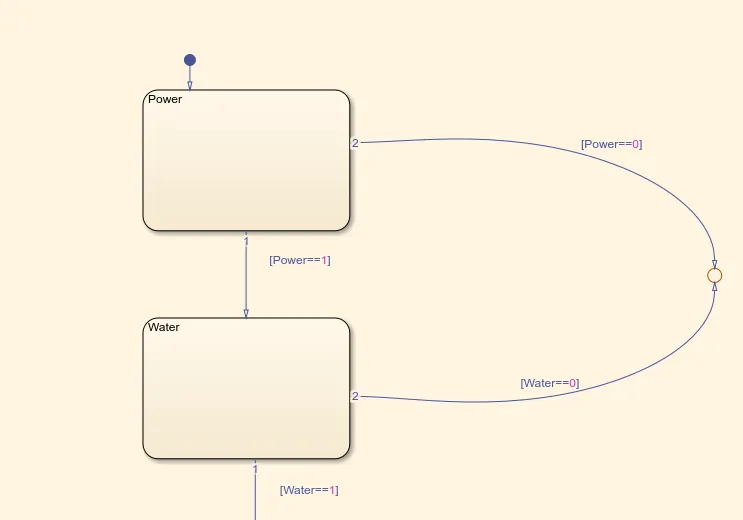
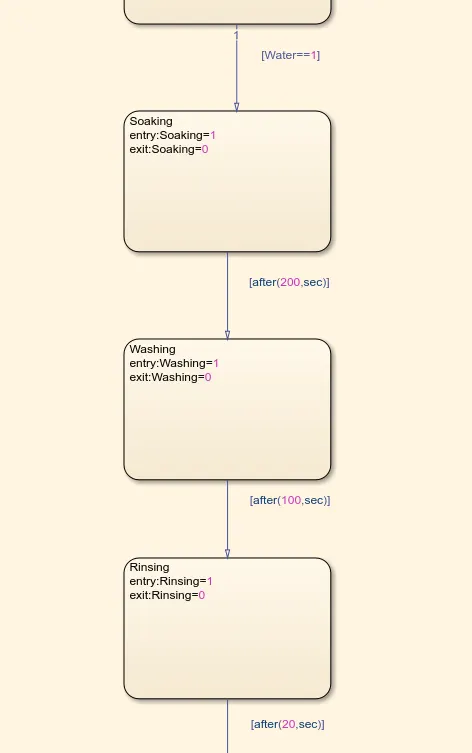
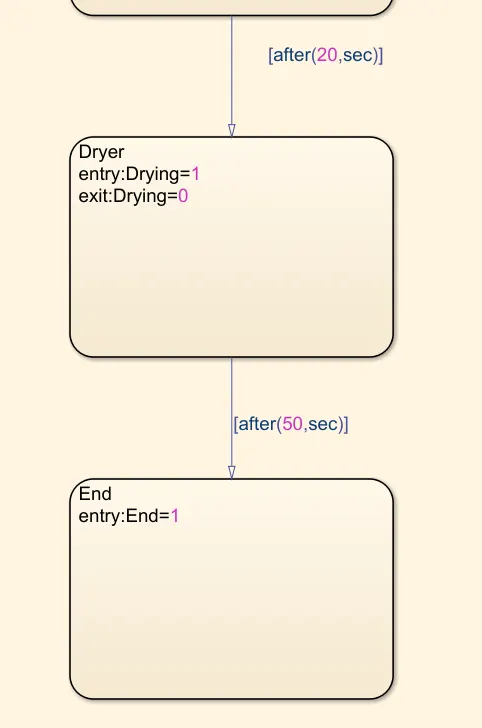
The arrow connecting the flow chart’s indicate the ‘input values’ and the ‘entry’ and ‘exit’ values determine the ‘output values’.
Here we will be assigning two conditions for the ‘Power supply’ and ‘Water supply’ i.e ‘1’ and ‘0’.
‘1’ represents the ‘ON’ condition and ‘0’ represents ‘OFF’ condition.
‘Power supply’ and ‘Water supply’ are the two basic elements without which the process won’t start. If either one of them is switched off then the process will not be processed further.
To start the process both ‘Power supply’ and ‘Water supply’ should be turned on.
From the ‘Symbol Pane’ window we will assign the ‘Input’ and the ‘Output’ values.
There will be two ‘Inputs’ as without these two the process will not start, and there will be five ‘Outputs’. These ‘Outputs’ will be ‘Soaking’ , ’Washing’ , ’Rinsing’ , ’Drying’ and ‘End’.
All the five outputs will be connected to the ‘Display’ block and will assign each ‘Output’ to each Indicator i.e ‘Lamp’ block. Now we will assign the color of the ‘Lamp’ i.e when the value is ‘1’ the ‘Lamp’ will be ‘green’ and when the value is ‘0’ the ‘Lamp’ will be ‘red’.
Now we will be assigning a ‘Slider switch’ to both the ‘Inputs’ i.e for ‘Power supply’ and ‘Water supply’.
After doing this we will now run the simulation.
The below image shows us when both the switches are ‘ON’
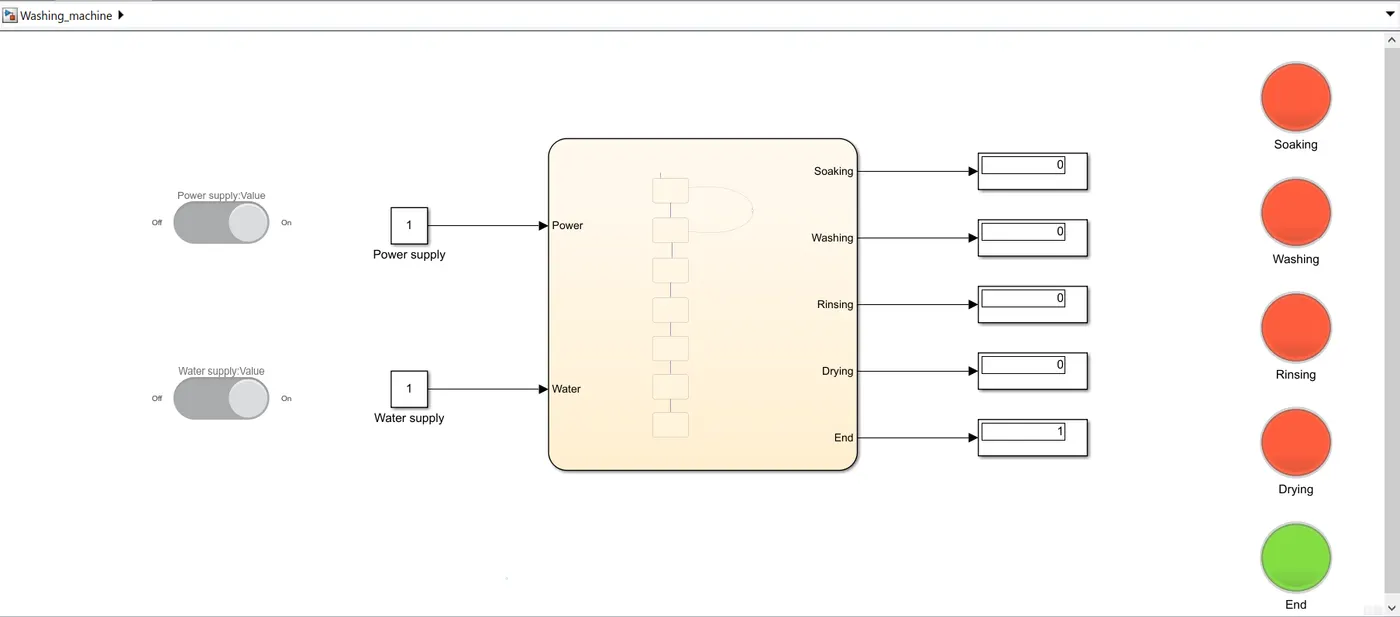
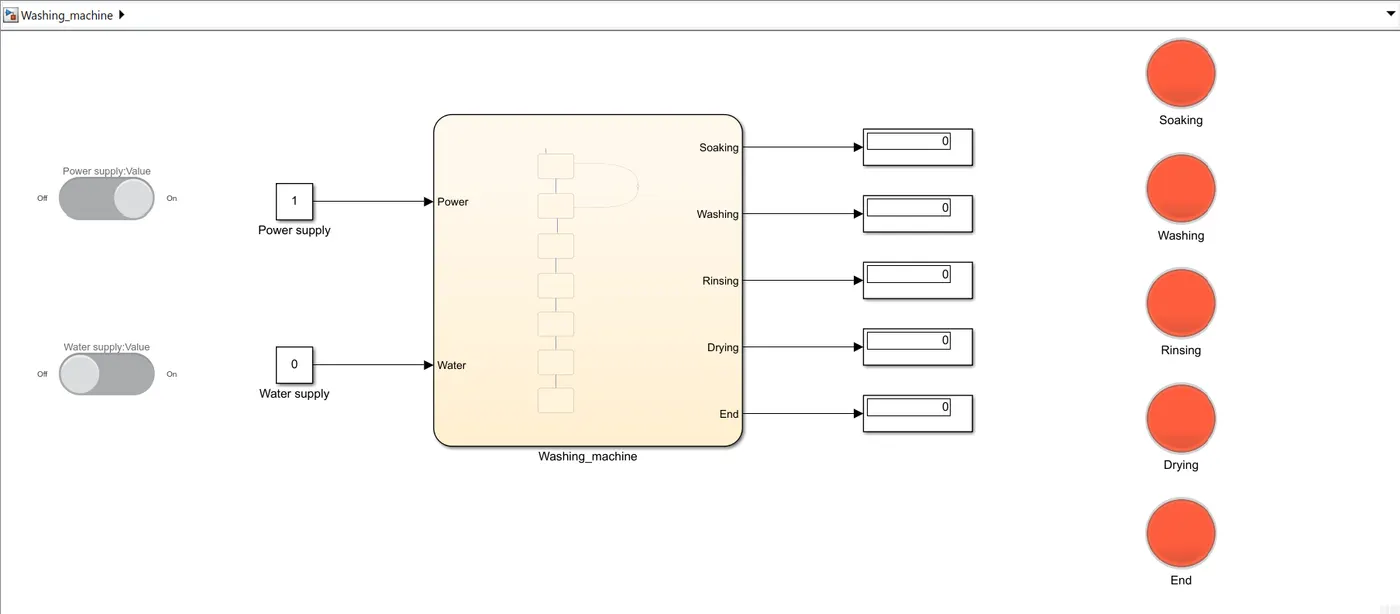
The below image shows us when ‘Power supply’ is ‘ON’ and ‘Water supply’ is ‘OFF’
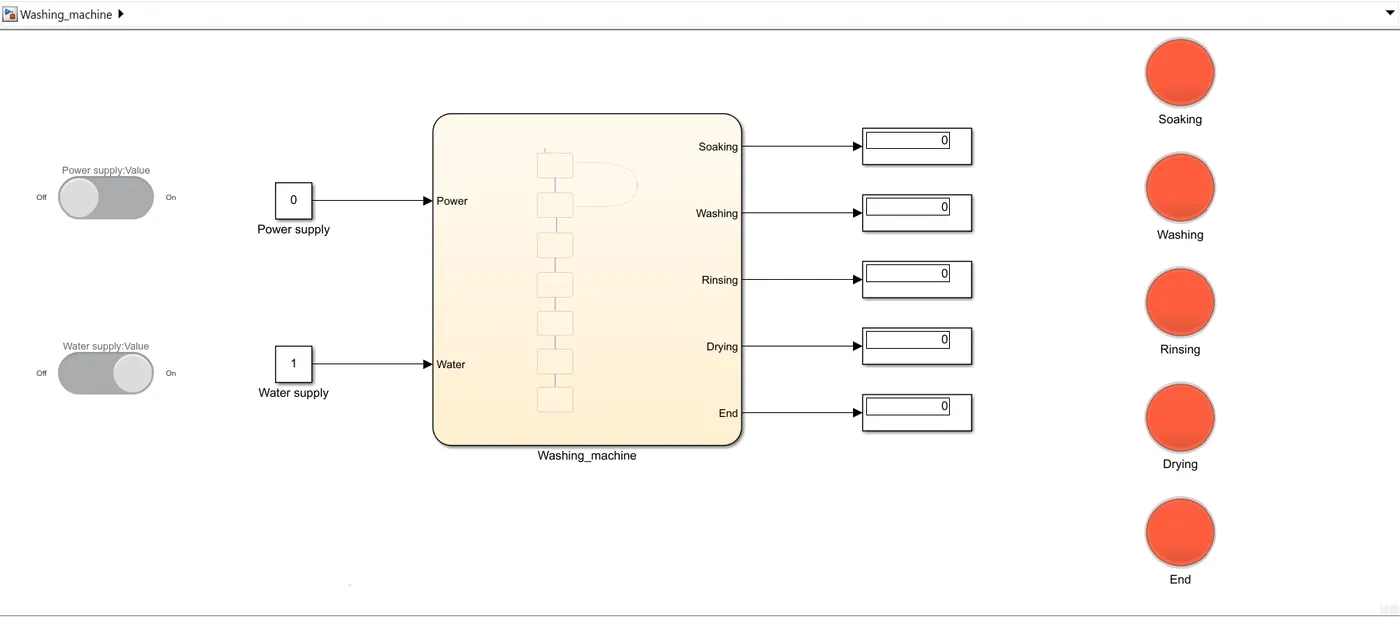
The below image shows us when ‘Water supply’ is ‘ON’ and ‘Power supply’ is ‘OFF’
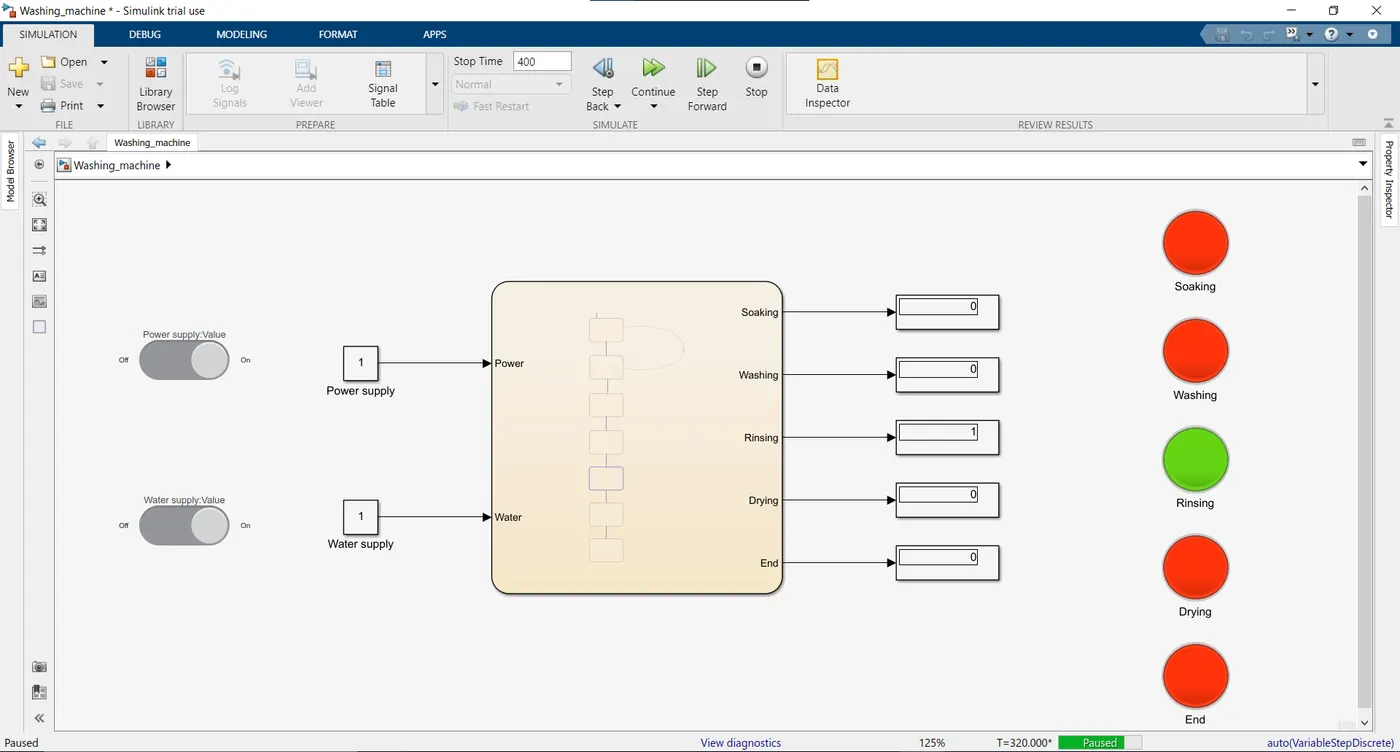
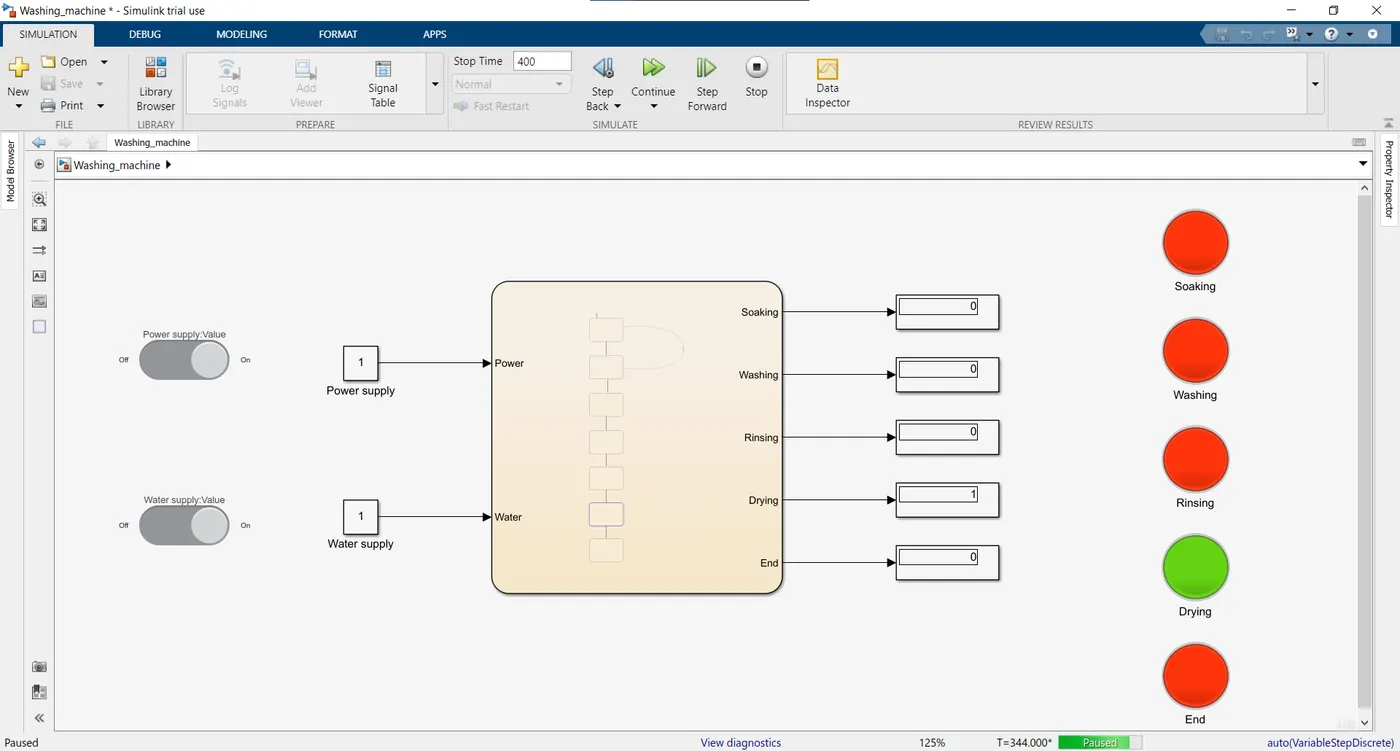
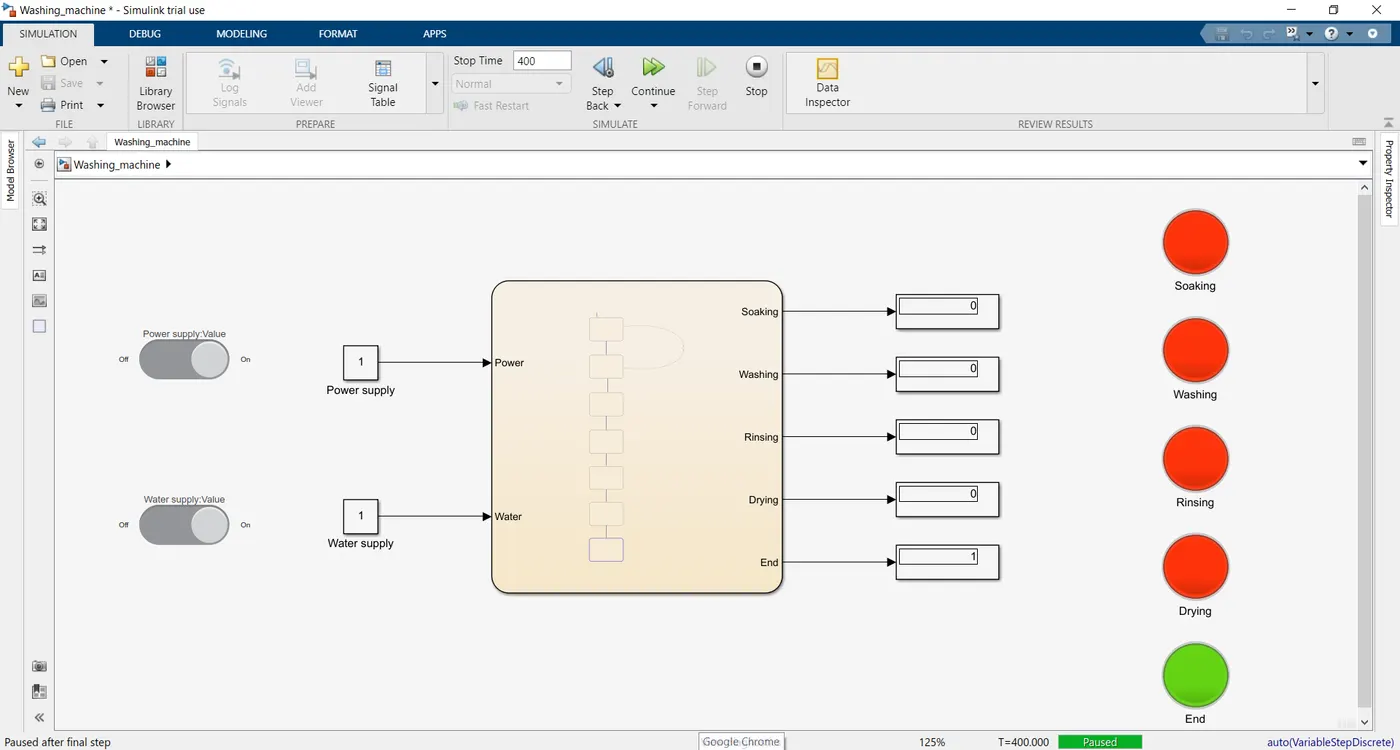
All the ‘Lamps’ must be green one at a time, as it indicates that after the completion of first the second one will start.
The below image shows us step-by-step proceedings of the simulation.
STEP 1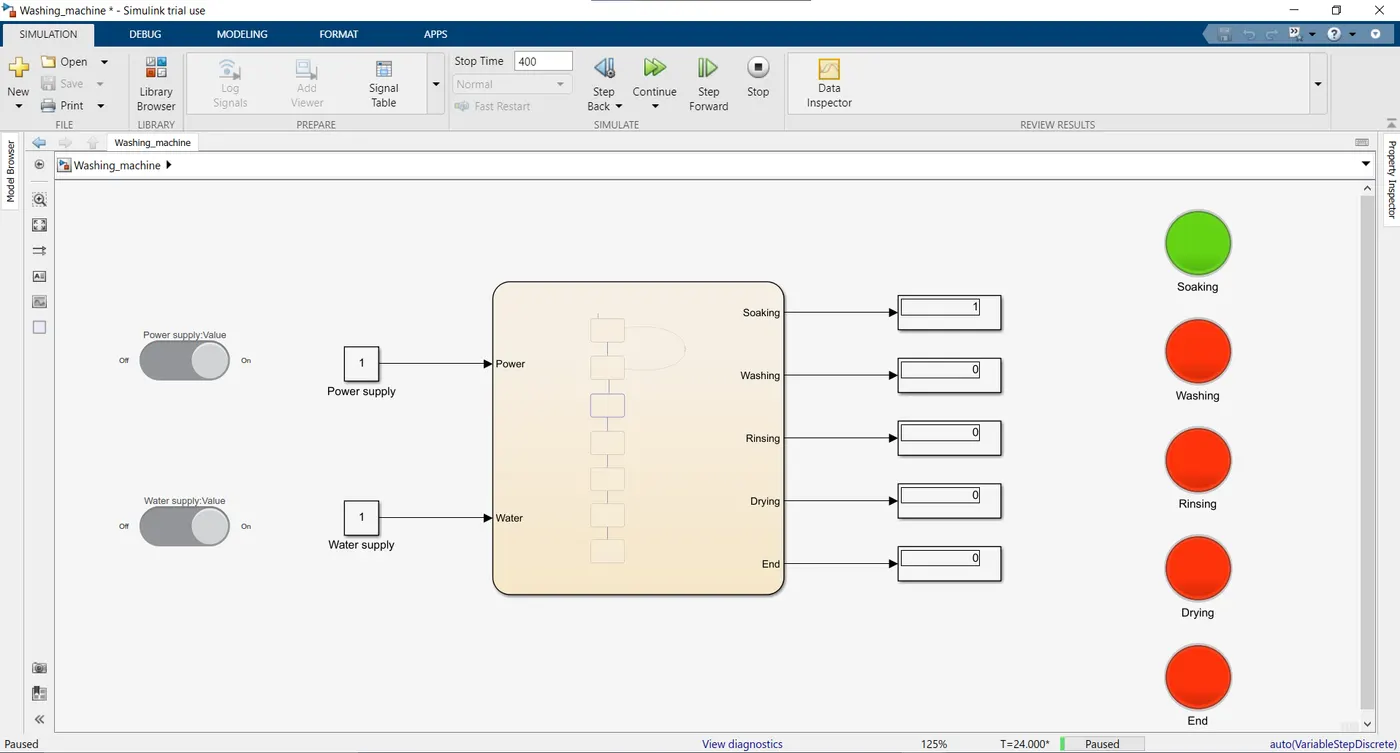
STEP 2
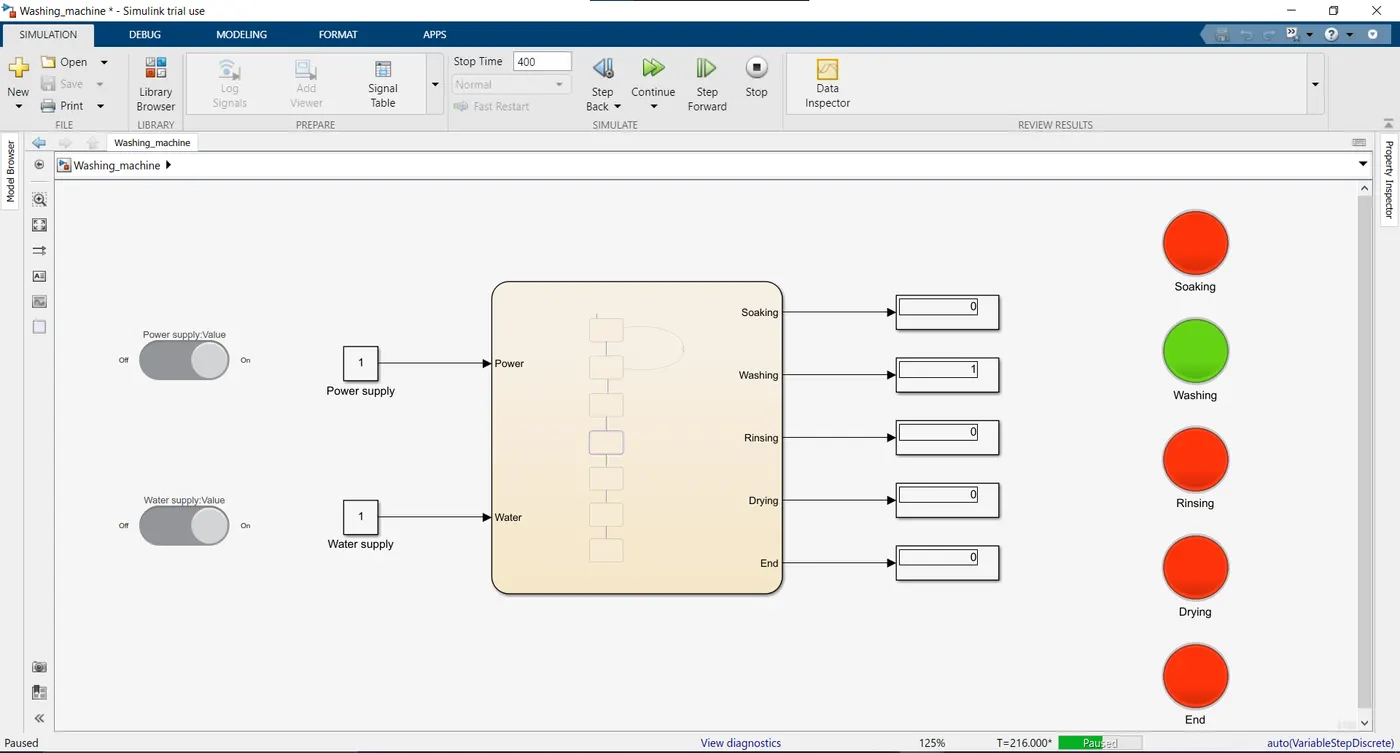
STEP 3
STEP 4
STEP 5
AIM:- Make a Simulink chart for the “Gear shift” logic as per below conditions:
Speed Range(kmph) Gear
0 to 15 1
16 to 25 2
26 to 40 3
41 to 60 4
Above 61 5
Give speed input while the simulation is running & display the gear number.
EXPLAINATION:-
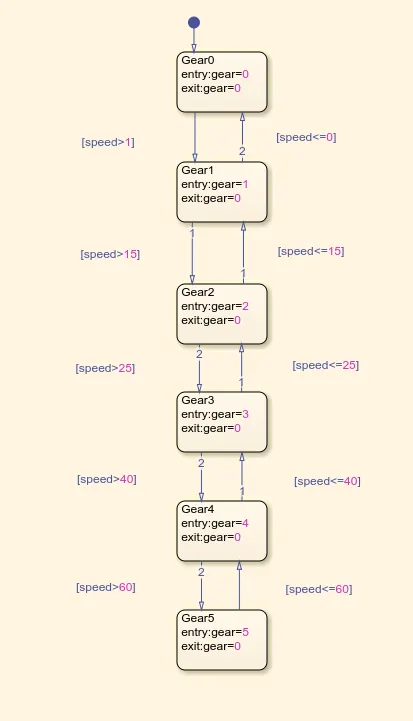
The below diagram is the ‘Flow chart’ of a gear box at different speeds.
The below image is of the 'Symbol Pane'
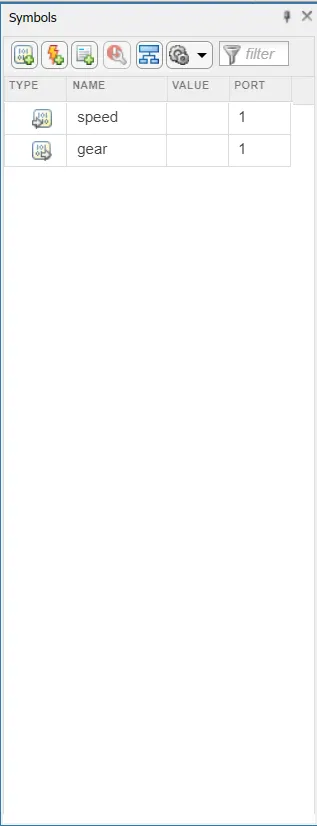
There will be one ‘Input’ and one ‘Output’. The ‘Input’ will be the ‘Speed’ given to the gear box and the ‘Output’ will be the display as to which gear it will be using for providing the ‘Input’ speed.
Again coming to the flow chart the arrows connecting the two blocks are the conditions which will be checked after entering the flow chart.
The two arrows are the two conditions for the speeds i.e above a certain speed the simulation will proceed to the next block and below that speed the simulation will not proceed further.
The entry and exit values will be the output which we will be seeing in the display block.
If the speed is ‘0’ i.e for neutral gear the block will be showing ‘0’ gear value i.e Neutral gear
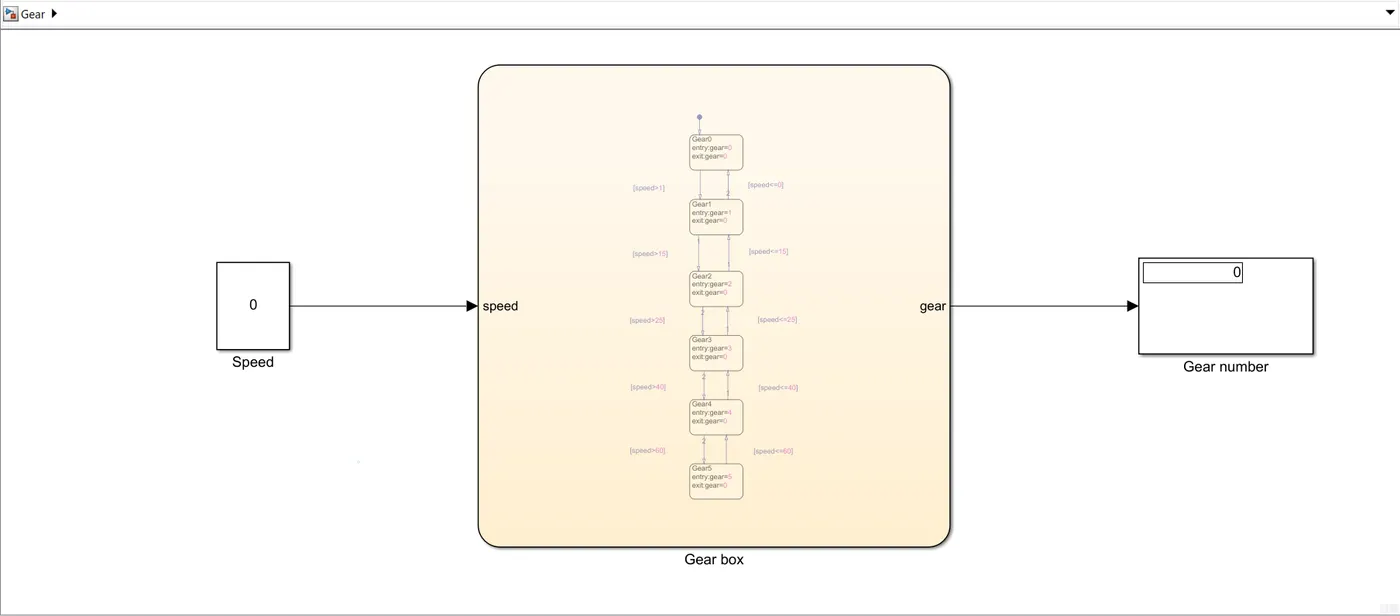
If the speed is in between 0 to 15 the Display will show the value of ‘1’ which is Gear number
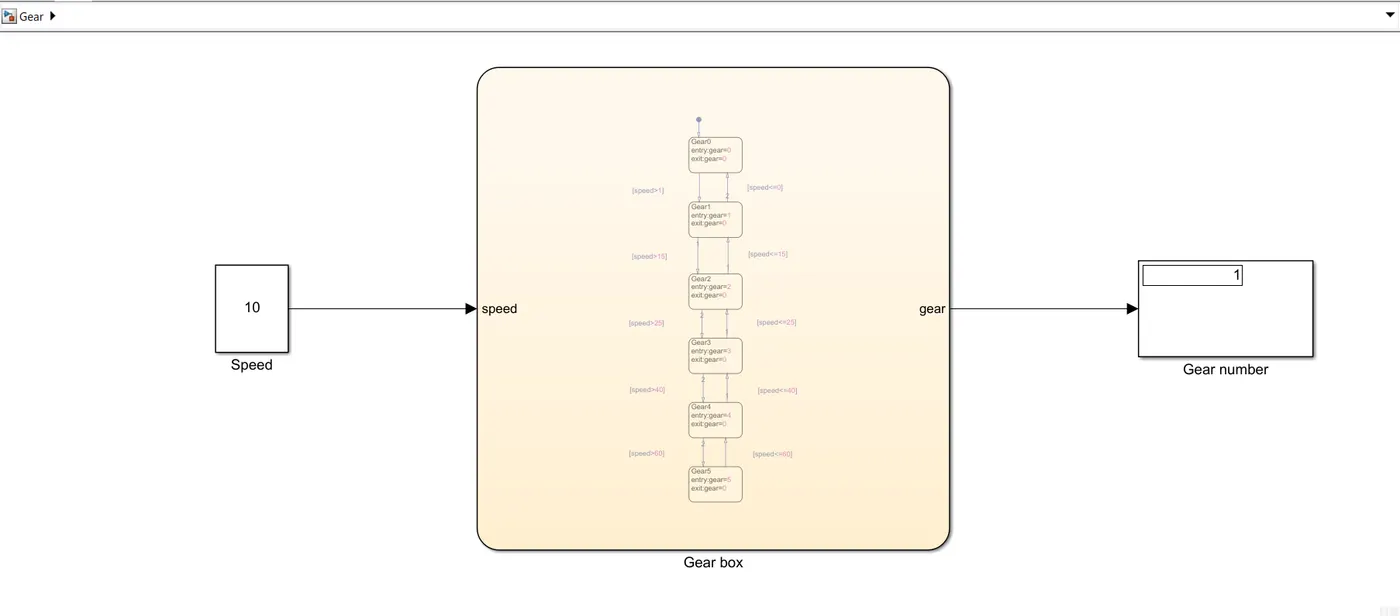
If the speed is in between 16 to 25 the Display will show the value of ‘2’ which is Gear number
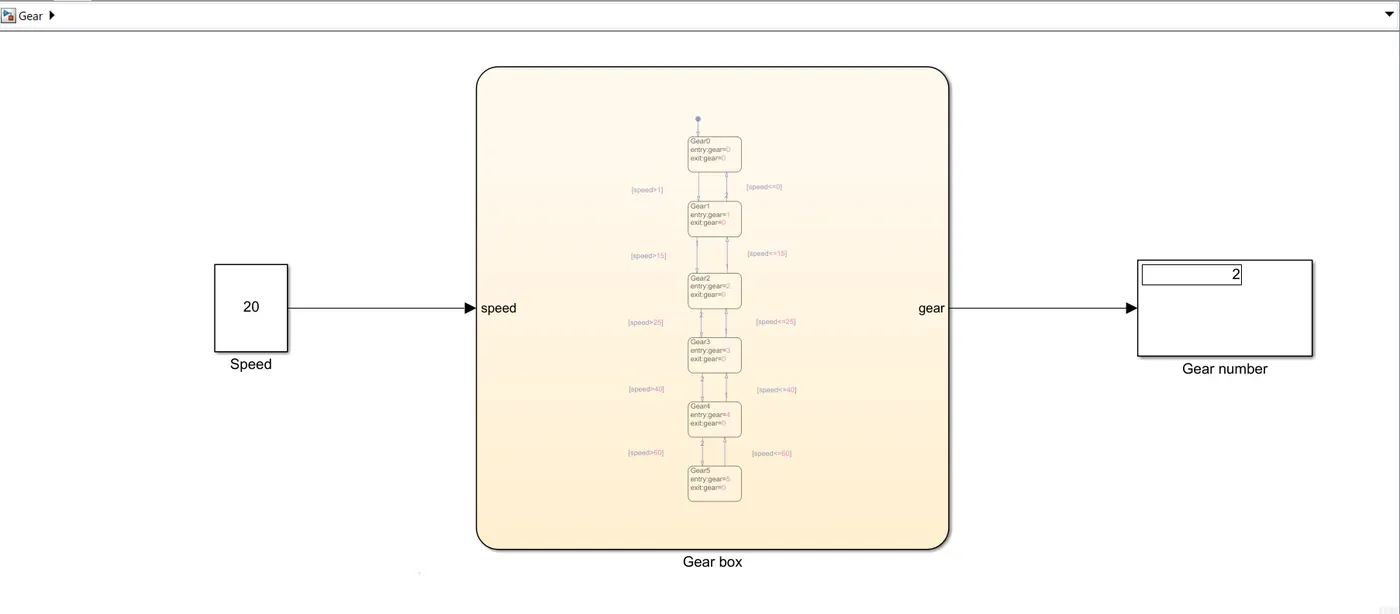
If the speed is in between 26 to 40 the Display will show the value of ‘3’ which is Gear number
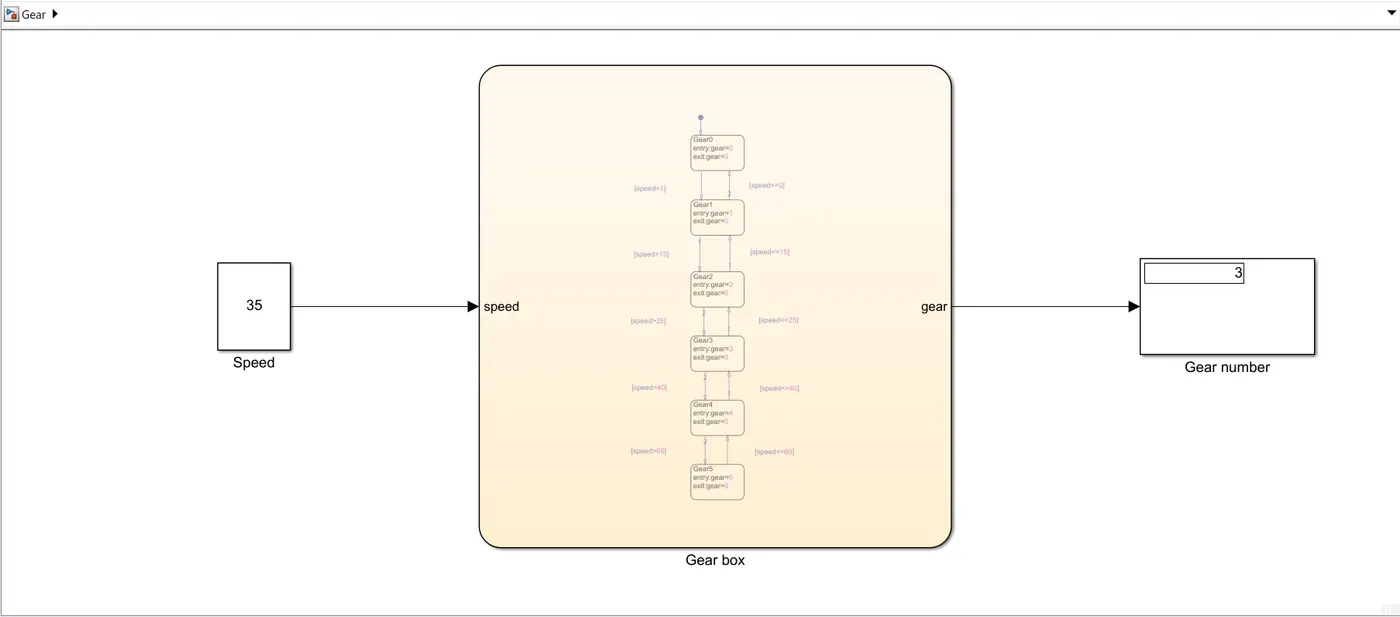
If the speed is in between 41 to 60 the Display will show the value of ‘4’ which is Gear number
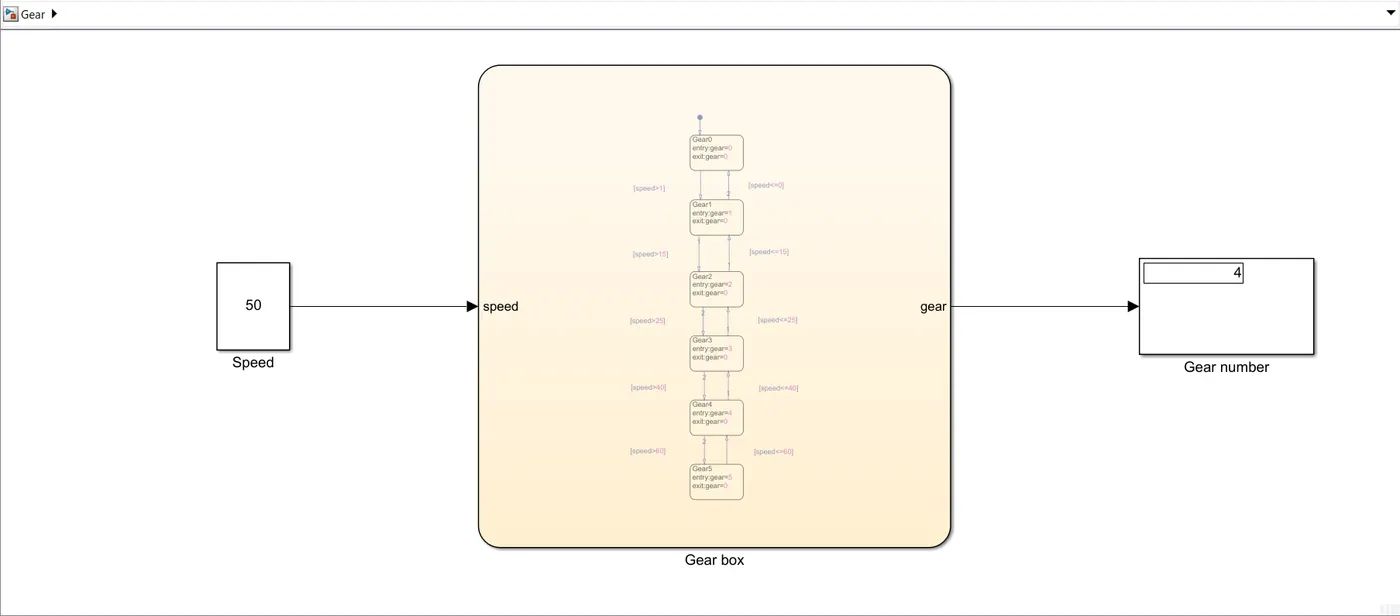
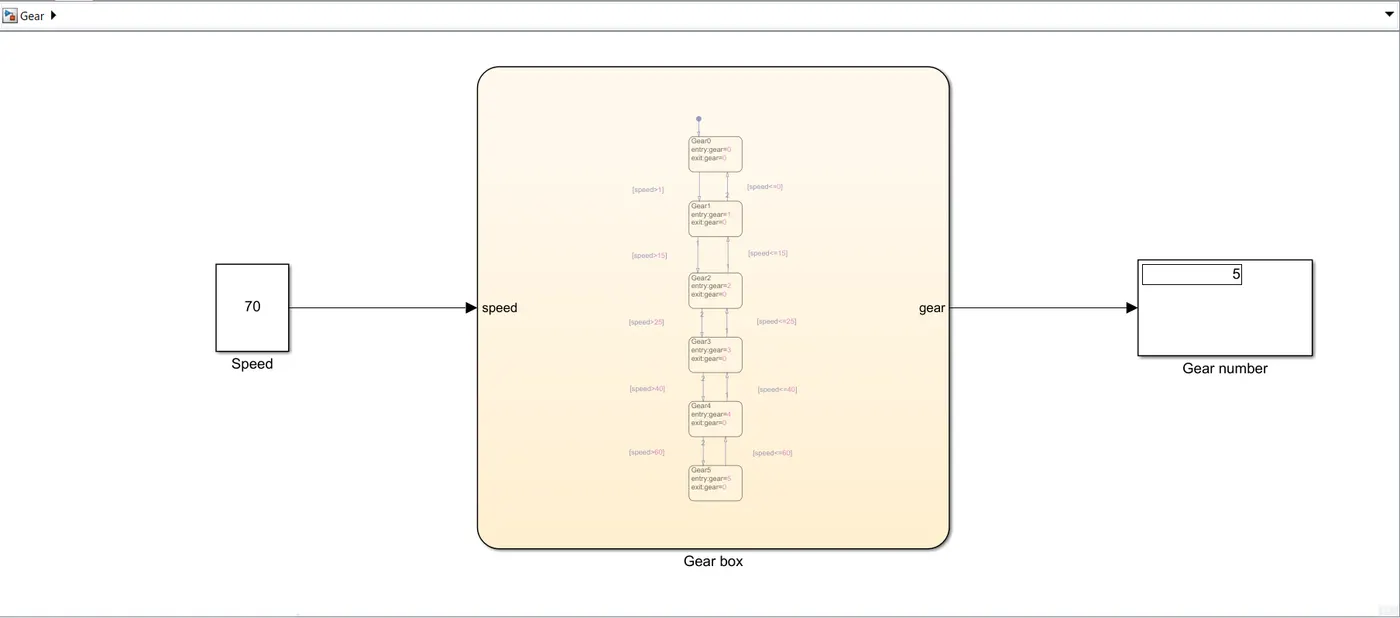
If the speed is above 61 the Display will show the value of ‘5’ which is Gear number
CONCLUSION:- The above two challenges were completed and simulated successfully