Week - 4
- Implement control logic of a “washing machine” using Stateflow as per given sequence:
- If the power supply is available, the system gets activated
- If the Water supply is not available, stop the process & indicate through LED
- Soaking time should be 200s followed by Washing time of 100s.
- Then rinsing happens for next 20s & dryer runs for 50s
Answer:
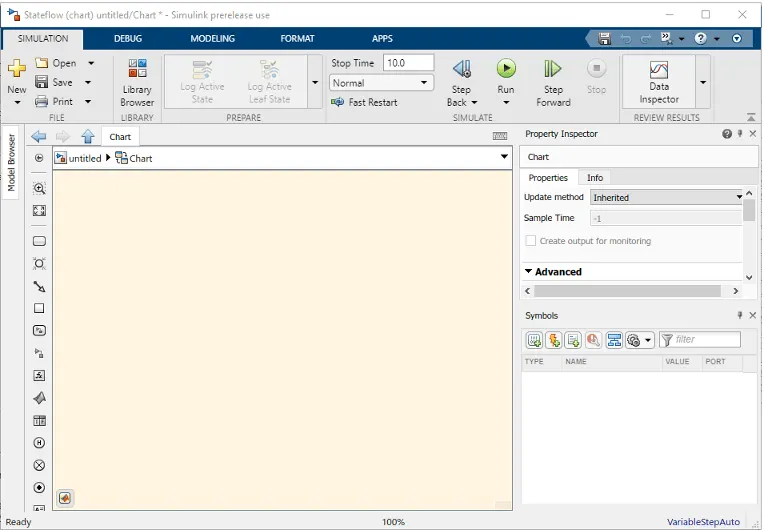
The main components of the Stateflow Editor are the chart canvas, the object palette, and the Symbols pane.
-
The chart canvas is a drawing area where you create a chart by combining states, transitions, and other graphical elements.
-
On the left side of the canvas, the object palette displays a set of tools for adding graphical elements to your chart.
-
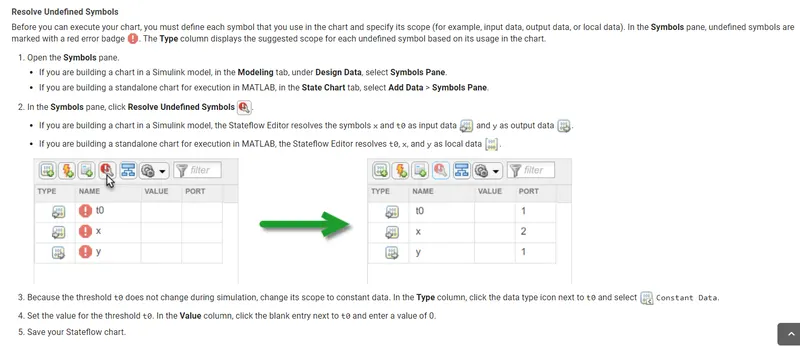
On the right side of the canvas, in the Symbols pane, you add new data, events, and messages to the chart and resolve any undefined or unused symbols.
Blocks Used
- Chart
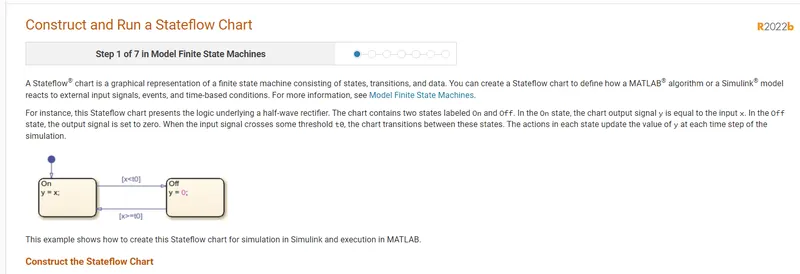
A finite state machine is a representation of an event-driven (reactive) system. In an event-driven system, the system responds to an event by making a transition
from one state (mode) to another. This transition occurs if the condition defining the change is true.
- Display
The Display block shows the value of the input data. You can specify the frequency of the display. For numeric input data, you can also specify the format of the
display.
- Constant
The Constant block generates a real or complex constant value signal. Use this block to provide a constant signal input.
- Lamp
The Lamp block displays a color indicating the value of the input signal. You can use the Lamp block with other Dashboard blocks to build an interactive
dashboard of controls and indicators for your model. You can specify pairs of input values and colors to provide the information you want during the simulation.
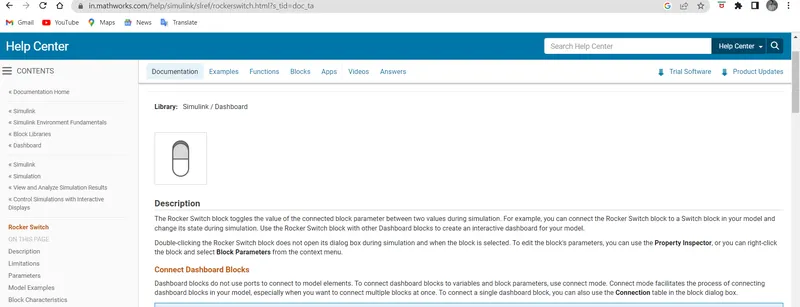
- Rocker Switch:
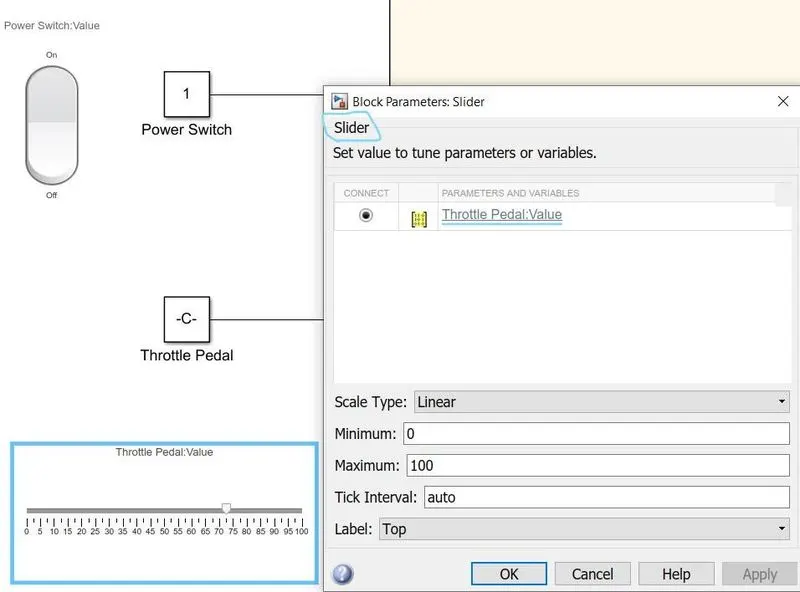
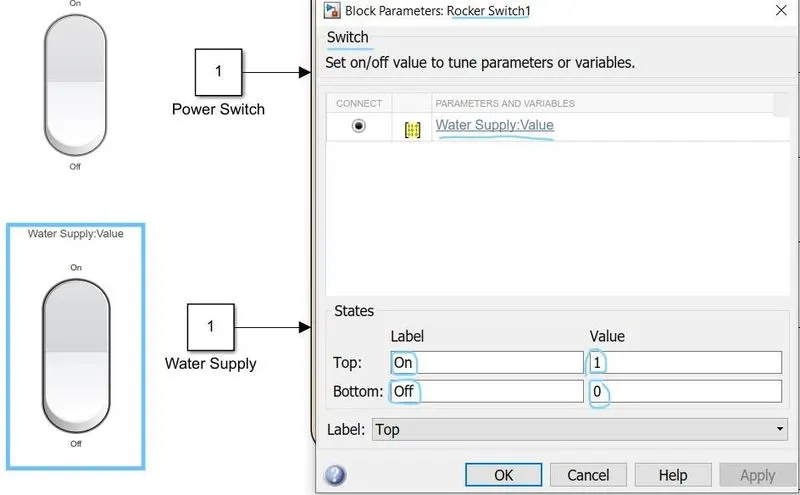
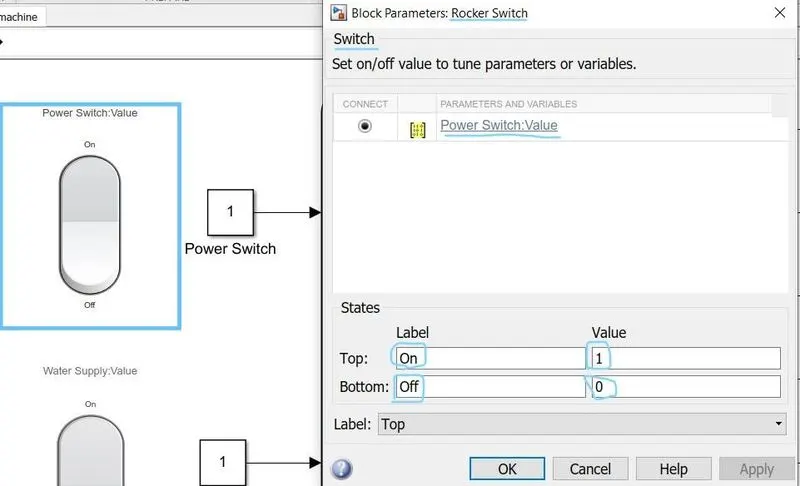
The Rocker Switch block toggles the value of the connected block parameter between two values during simulation. For example, you can connect the Rocker Switch block to a Switch block in your model and change its state during simulation.
Logic Explanation
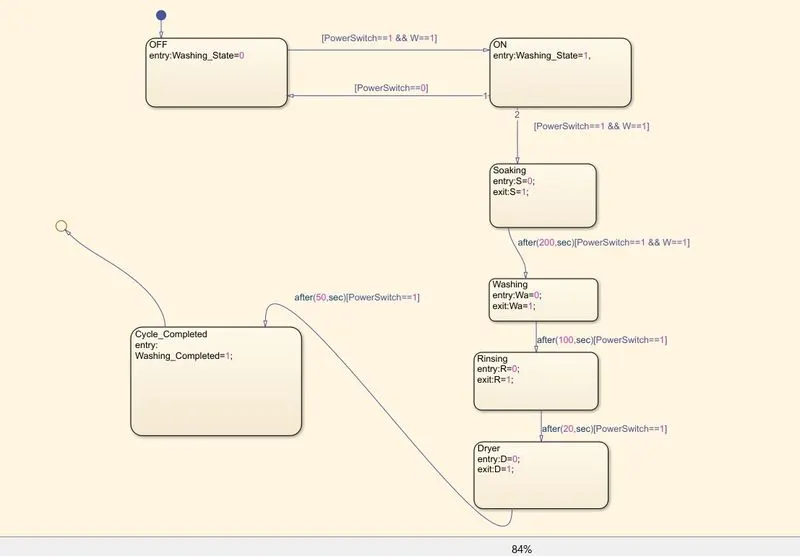
A Rocker switch from the dashboard library is used with a constant to supply the power and as water supply. A lamp is used to indicate the power status & water status. The power status is checked at the entry for every
state and the water supply is checked for the soaking and the rinsing process. The timing for each state is as per the given inputs. The status of the running process can be seen by the glowing lamp corresponding to the process name.
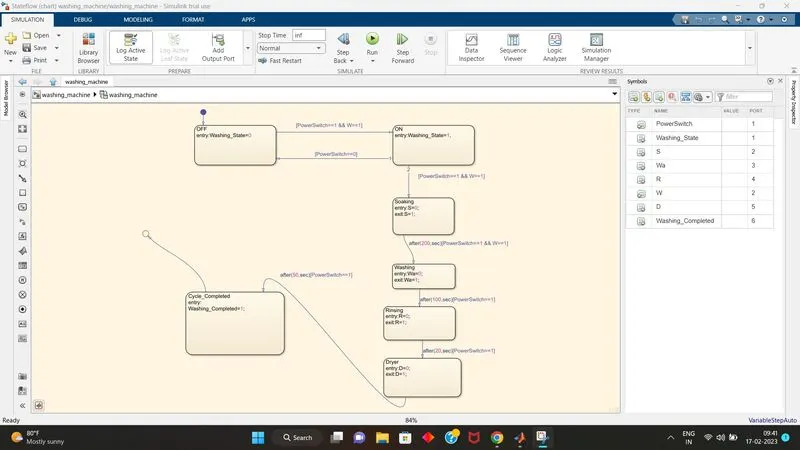
Wshing Machine logic:
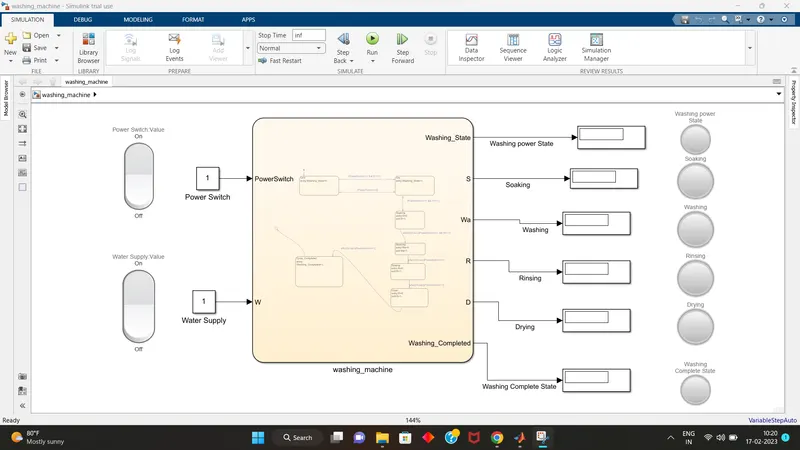
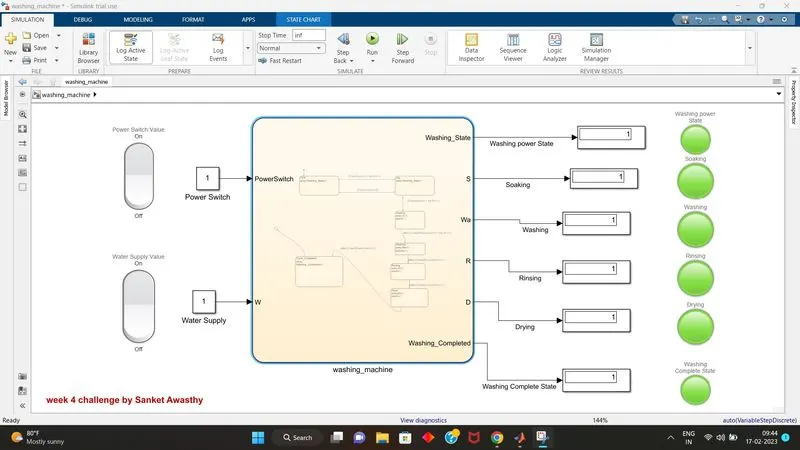
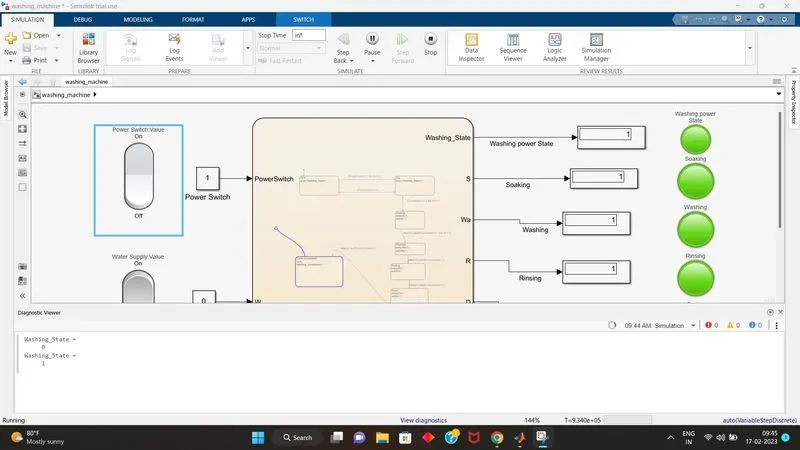
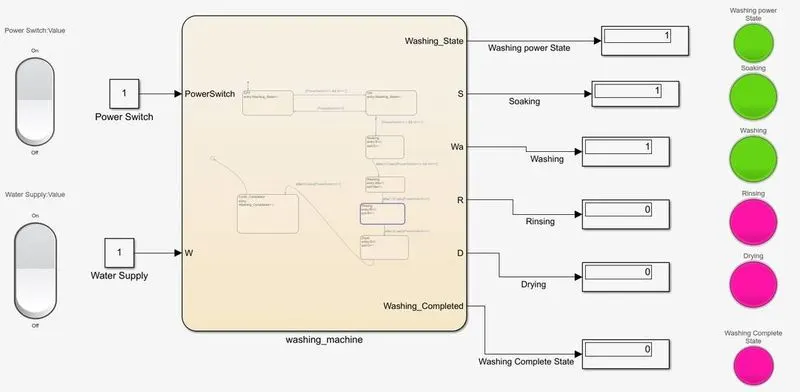
Here Red light means operation is not completed and green LED shows operation is completed which is also check from display box as output 1.
---------------------------------------------------------------------------------------------------------------------------------------------
Question 2:
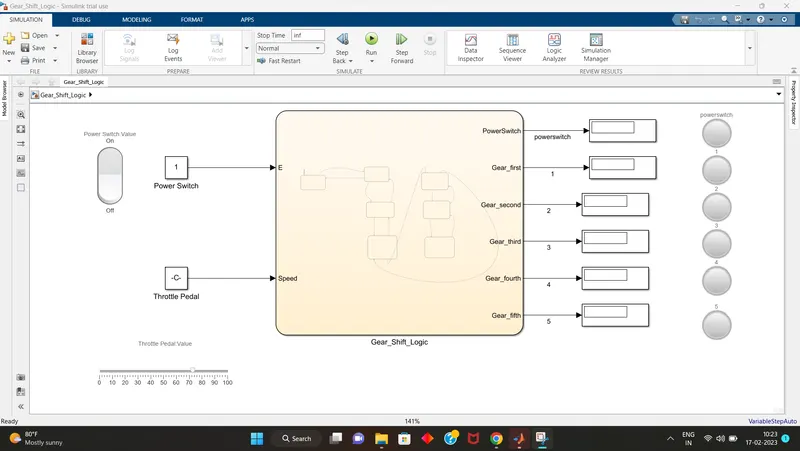
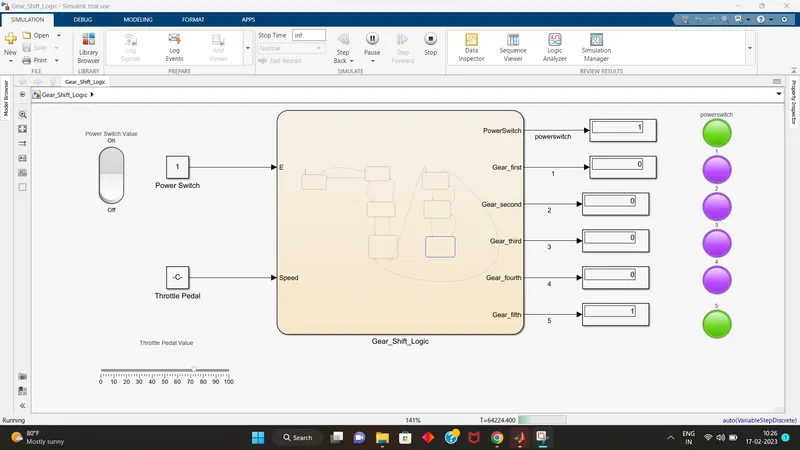
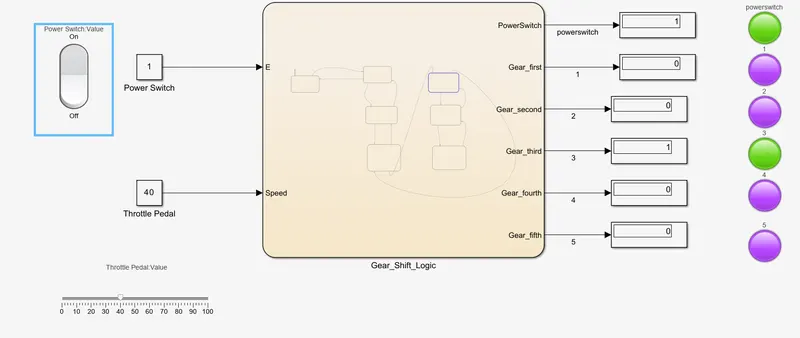
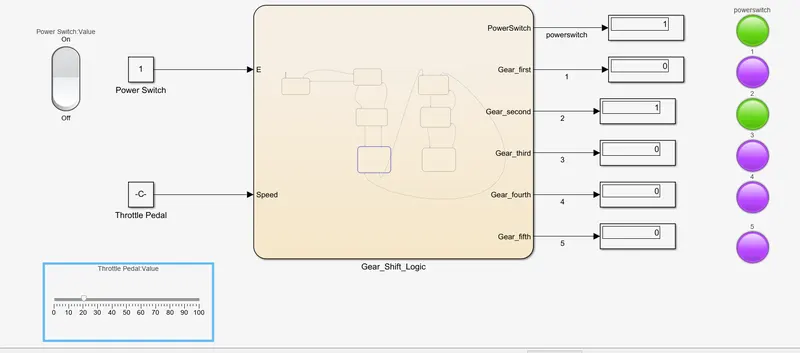
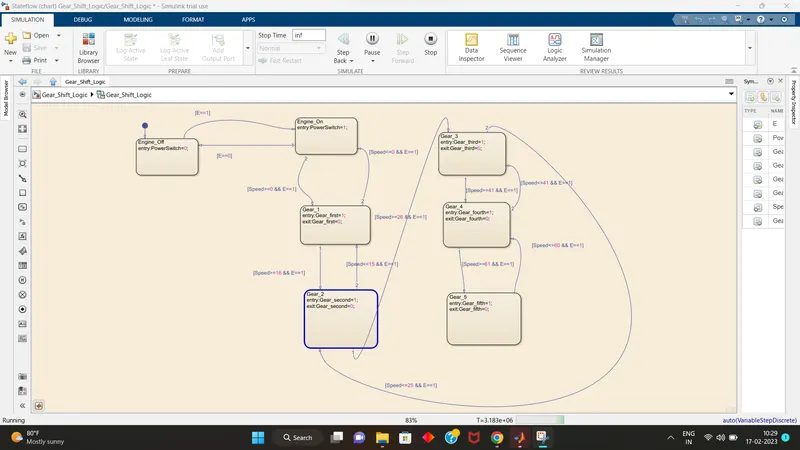
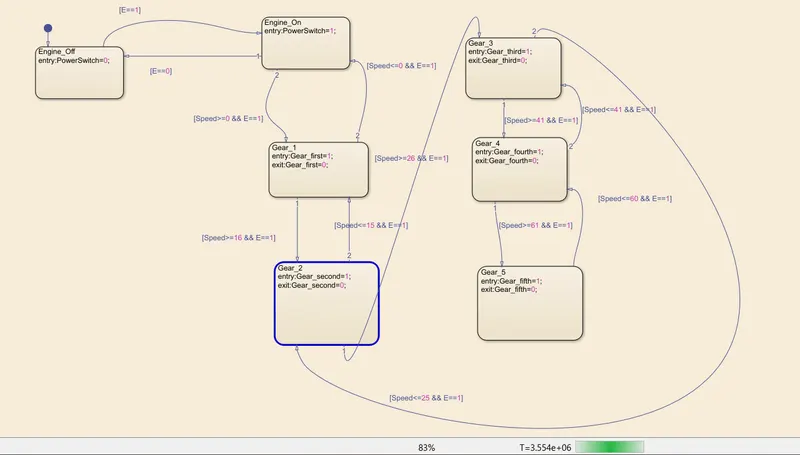
Make a Simulink chart for the “Gear shift” logic as per below conditions:
Speed Range(kmph) Gear
0 to 15 1
16 to 25 2
26 to 40 3
41 to 60 4
Above 61 5
Give speed input while the simulation is running & display the gear number.
Answer: