Week - 4
Aim:
1) To implement a control logic of a washing machine using Stateflow as per given sequence.
2) To make a Simulink chart for the gear shift logic as per given condition.
Objective:
1) The sequence of control logic of a washing machine is…
- If the power supply is available, the system gets activated.
- If the water supply is not available, stop the process and indicate through LED.
- Soaking time should be 200 sec followed by washing time of 100 sec.
- Then rinsing happens for next 20 sec and dryer runs for 50 sec.
- After all the process is completed, turn ON the finished LED.
2) The condition for the gear shift logic is…
|
Speed Range (km/h) |
Gear |
|
0 - 15 |
1st |
|
16 – 25 |
2nd |
|
26 - 40 |
3rd |
|
41 – 60 |
4th |
|
Above 61 |
5th |
- Give speed input while the simulation is running & display the gear number.
Answer 1:
The model of the washing machine as per given sequence is shown in Figure 1.
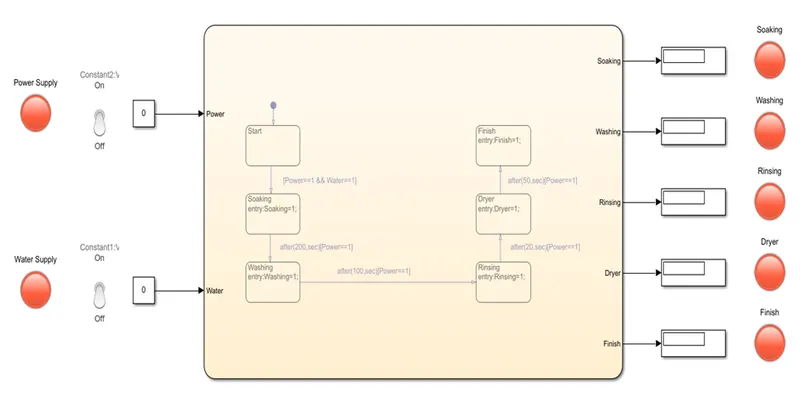
Figure 1
- The inputs for the model are Power supply and Water supply.
- They are connected to constant blocks. The blocks are linked with toggle switches and LEDs. If the toggle switch is OFF then, the value of constant block is 0 and LED is red. If the toggle switch is ON then, the value of constant block is 1 and LED is green.
- The outputs of the model are different states of the process such as Soaking, Washing, Rinsing, Drying and Finish. All these outputs are connected to individual displays and are linked with LEDs. If there is an output in any state then the display will show 1 and LED will be green. If there is no output then display shows 0 and LED will be red.
The stateflow chart is shown below in Figure 2.
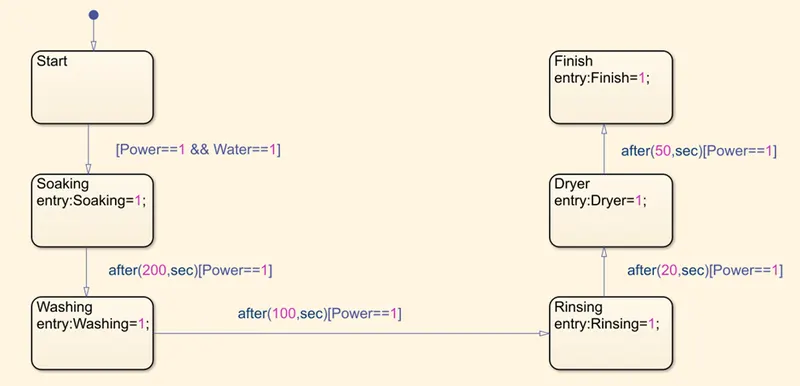
Figure 2
- The sequence of the control logic is as shown in Figure 2.
- The sequence starts with Start block. The next block is named Soaking. The sequence will move from start to soaking only if both, Power supply and Water supply, are available.
- Once the soaking is started, there is no need for water supply now so we can remove the condition Water==1 but power supply is essential for the entire process hence we will put Power==1 condition in every state transition.
- The soaking takes 200 sec and after that washing starts. So we place a condition after(200,sec) along with power supply condition between soaking and washing states.
- These manner keeps following till the end of the sequence.
Different outputs for the different input scenarios are shown below.
- When Power supply and Water supply both are available.
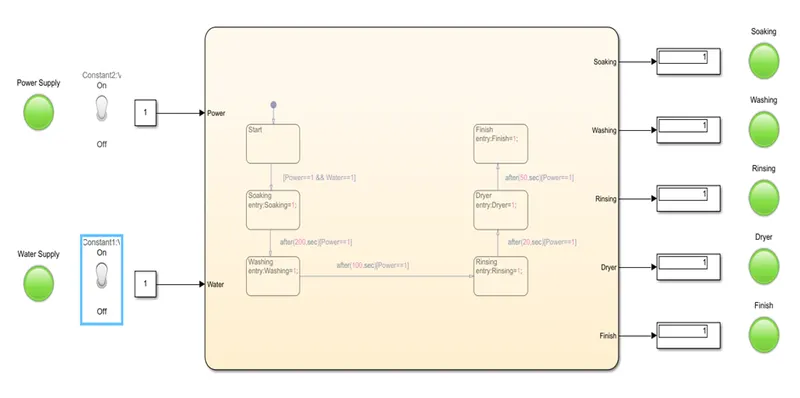
Figure 3
- When only Power supply is available.
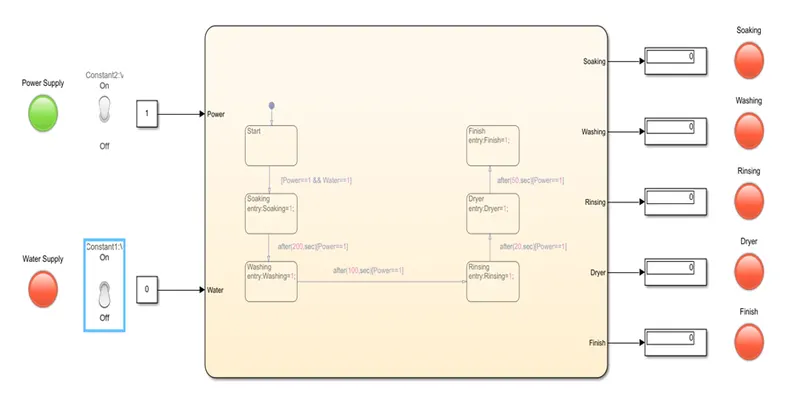
Figure 4
- When no supply is available at all.
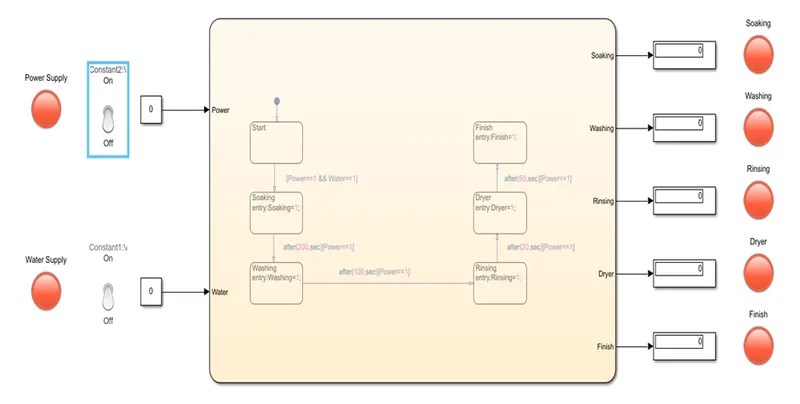
Figure 5
- When power supply is cut off in the middle of the process.
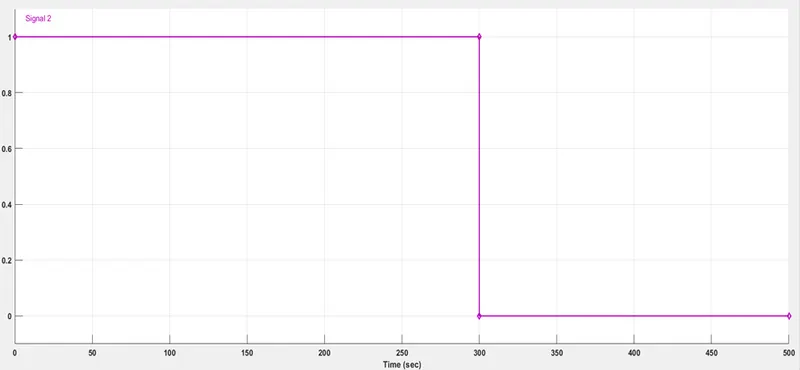
Figure 6: Power supply
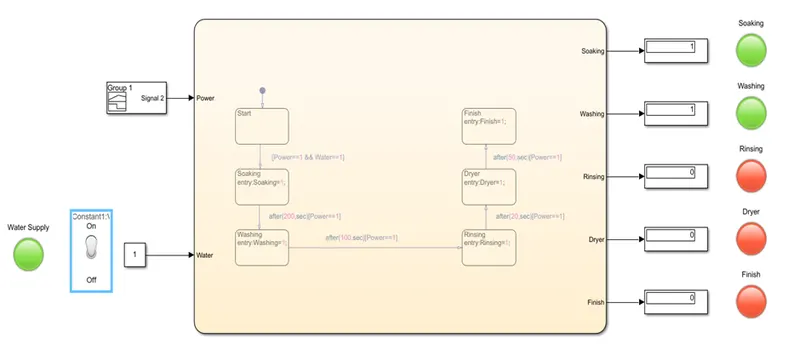
Figure 7
Answer 2:
The model of gear shift logic as per the given condition is shown in Figure 8.
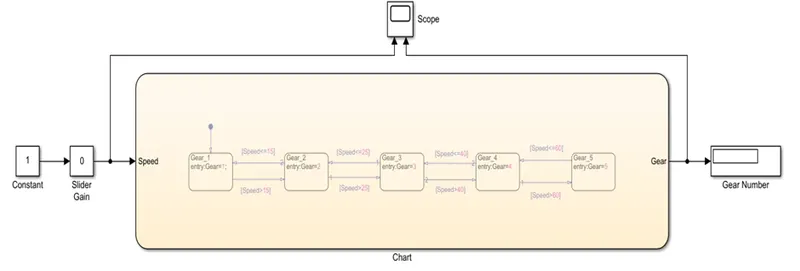
Figure 8
- The input of the model is speed. It is connected to a slider gain which is connected to a constant block valued 1. The slider gain allows user to select values between set low and high in the block itself.
- The output of the model is gear which shows the gear number respective of the given input as per the given conditions. The out put is connected to a display which shows the gear number.
- The input and output both are connected to a scope.
- The simulation is run for inf time period.
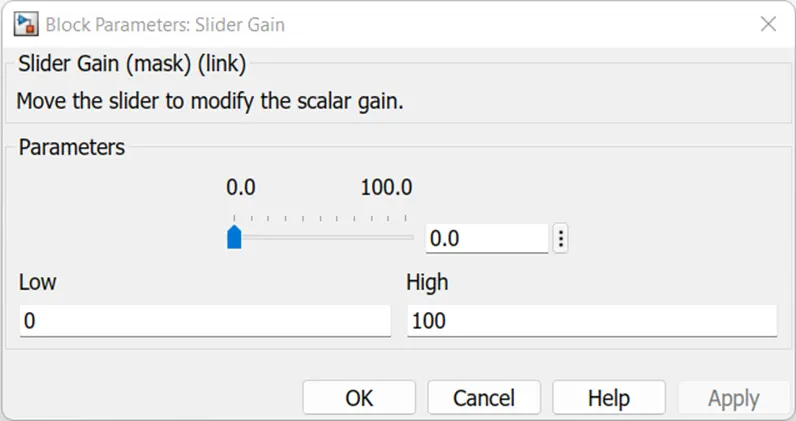
Figure 9: Slider Gain
The stateflow chart is shown below in Figure 10.

Figure 10
- First block named Gear_1 is a block for 1st The next block named Gear_2 is a block for 2nd gear and so on.
- As per the given condition, if the speed is greater than 15 then the state moves from 1st gear to 2nd Now, if the speed is say 20 so state is in 2nd block and suddenly speed drops to 10 then state again moves from 2nd gear to 1st gear.
- These instructions are given to each gear blocks as per their respective conditions.
Different outputs for the different speed inputs are shown blow.
- Input: Speed = 25 km/h
Output: Gear Number = 2nd
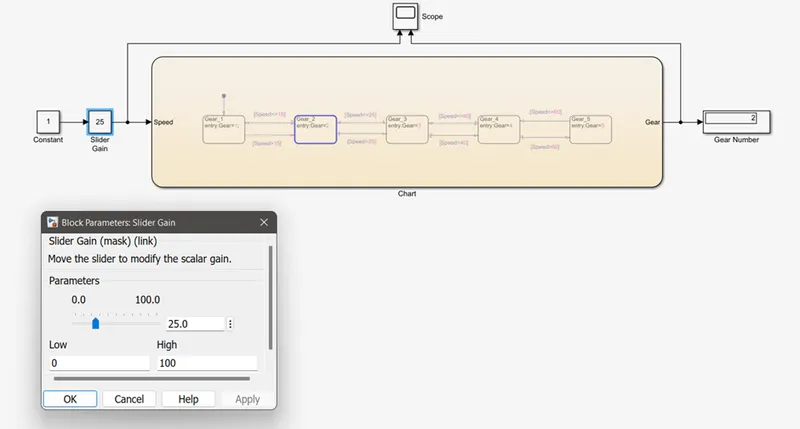
Figure 11
- Input: Speed = 51 km/h
Output: Gear Number = 4th
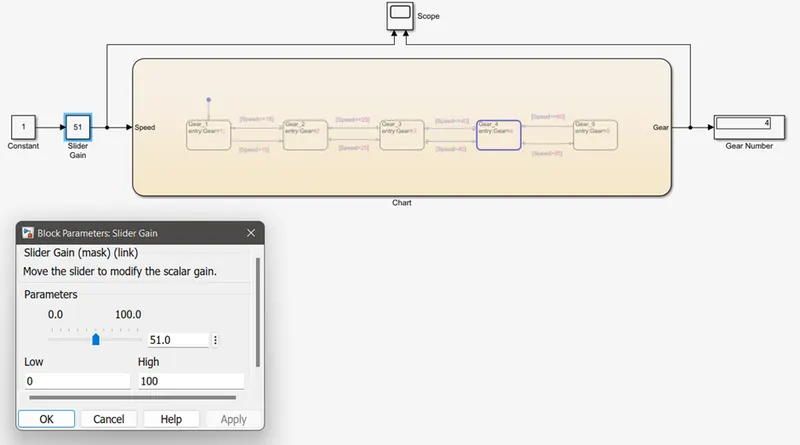
Figure 12
- Input: Speed = 80 km/h
Output: Gear Number = 5th
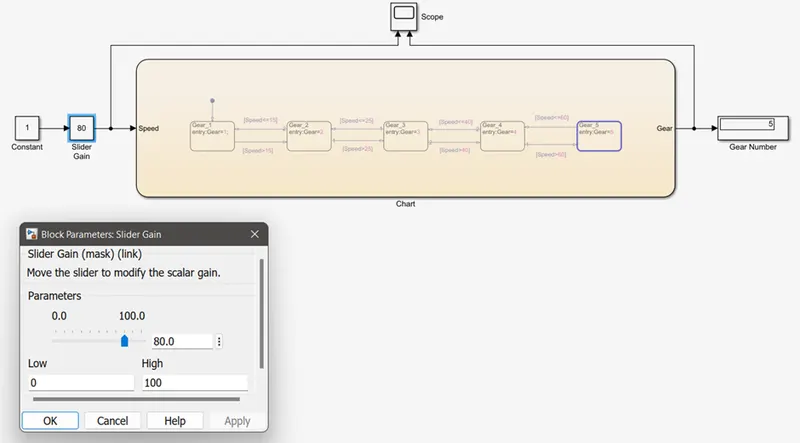
Figure 13
The output through scope is as shown below in Figure 14.
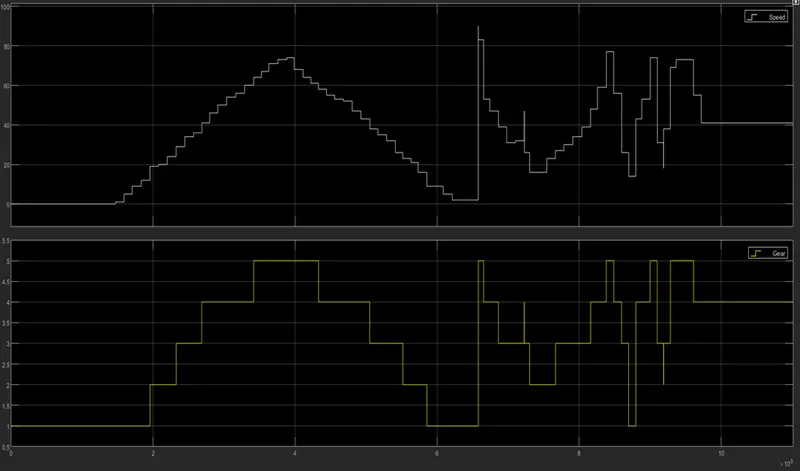
Figure 14
- As shown in Figure 14 as the speed increases, the gear number also increases and vice versa.
Conclusion:
From above models, we can conclude that using stateflow chart in Simulink, we can simulate any process consisting of state transition with their respective conditions to move from one state to another.