Week - 4
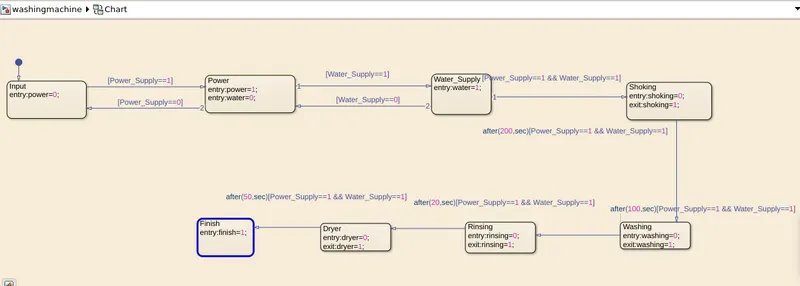
01)Aim: To design the Simulink model in order to control the logic of the Washing Machine according to the given Stateflow sequence.
- Stateflow Sequence :
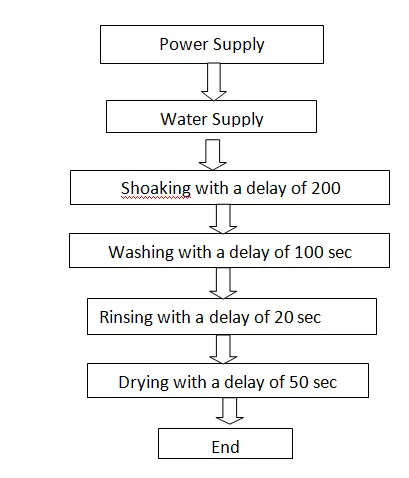
- According to the given data that is,
- When the power supply is available, the system gets activated.
- When the Water supply is not available, the washing machine is stopped and the same is indicated through the LED.
- The internal process like soaking, washing, rinsing, and drying should follow each other as per the sequence given with their corresponding delay.
- And finally when the process stops it should be indicated by the lamp.
- All the lamps will turn red when the process is not running and during the run time they will indicate the corresponding color code to easily understand the process.
Simulink Model of Washing Machine
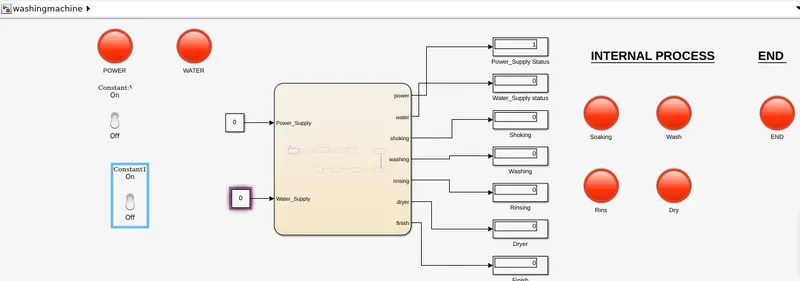
- When both the water supply and power supply are off in the washing machine all the processes are waiting for the power input and water input.
- Power input and water input are provided by the 'Toggle sitch'. With the help of the lamp block, we can check their status during the run time also.
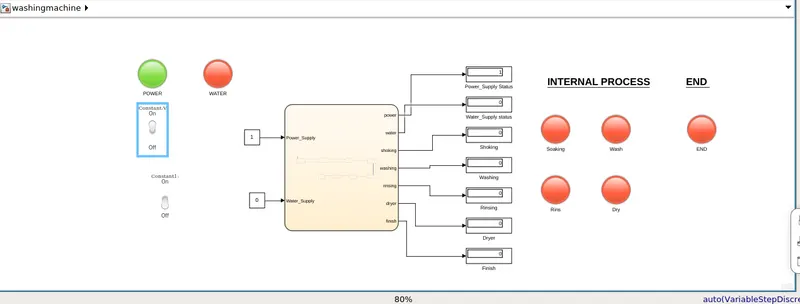
- Even though the power supply is on with the help of the toggle switch the internal process is still waiting for the water supply.
- Final Output:
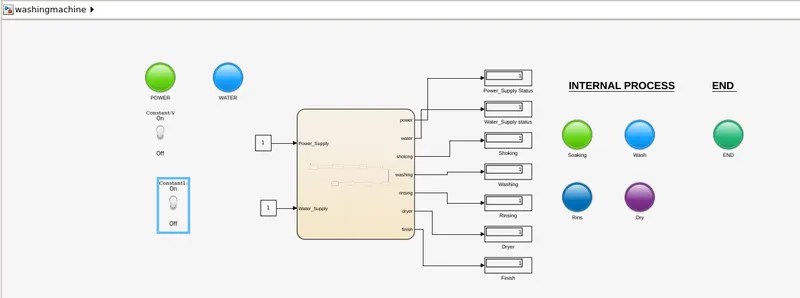
- Internal Process
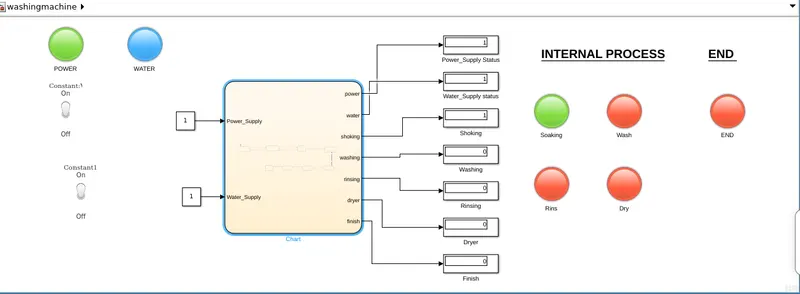
- 01)Shoaking
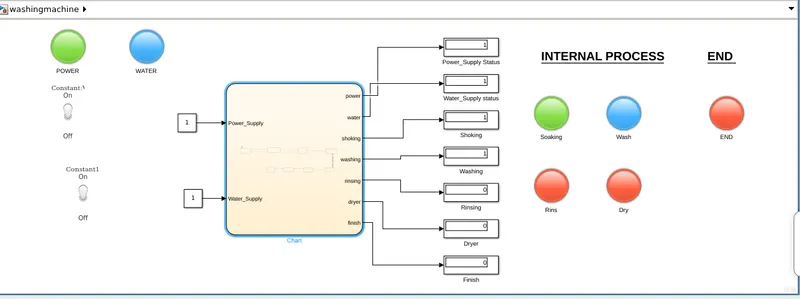
- 02) Washing
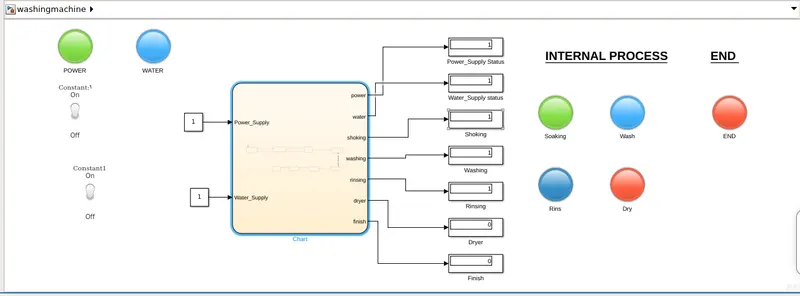
- 03)Rinsing
- 04) Dryer
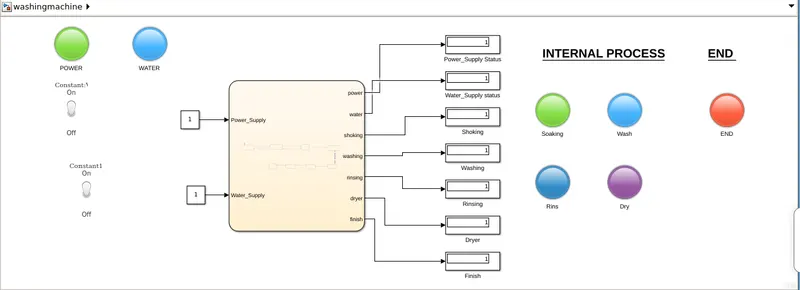
- The internal process like soaking, washing, rinsing, and drying start operating when they receive both the power input and water input available to the washing machine.
- Time delay for the shocking process is the highest delay of 200sec, for washing delay is 100 sec, rinsing and drying are 20 sec and 50-sec respectively.
- After all the process is completed the end Led is displayed and the process is ended.
Chart Diagram
Basic about Chart
- The chart is a finite state machine that represents an event-driven system, In which the system makes a transition from one state to another. This transition occurs if the condition is satisfied.
- The chart is a graphical representation of a finite state machine, where the states get the transition in the basic elements of the system. For simplicity, we can also have stateless flow charts.
- Google drive link:
- https://drive.google.com/file/d/1IluSqUJnIPfJ6qK7jMM90c_PJ6XPXTqq/view?usp=sharing
Conclusion
- In the above model, I have implemented a semi-controlled washing machine with the help of logic control, using the state flow according to the sequence given. The model is implemented successfully and the results are also shown. Additionally, the google drive link is also provided for your further reference.
02) Aim: Make a Simulink chart as per the Gear Shift logic given below.
- Given data:
| Speed Range | Gear |
| 0-15 | 1 |
| 16-25 | 2 |
| 26-40 | 3 |
| 40-60 | 4 |
| >60 | 5 |
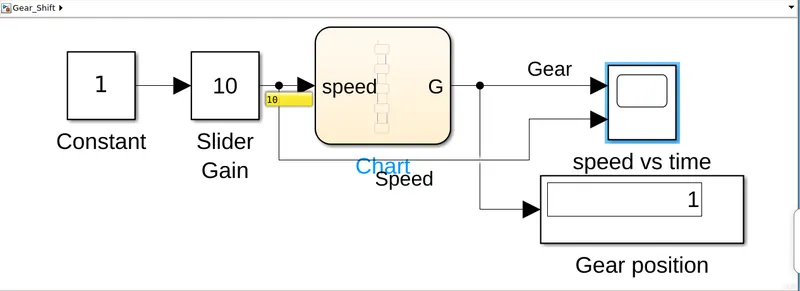
- Simulink Model
- Explanation
- In the above model shown I have used a slider gain to provide the variable input as per the user's wish.
- According to the above-given table, the speed is varied with the help of slider gain and the corresponding gear position is shown with the help of a display block.
- A scope block is used in order to view the change in gear position with the change in speed by slider gain.
- Simulink Chart
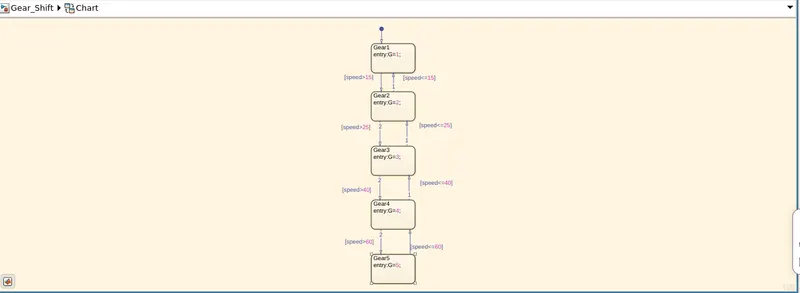
- The above chart file shown gives us an idea about how the change in gear is happening automatically with the variation in speed.
- Scope window
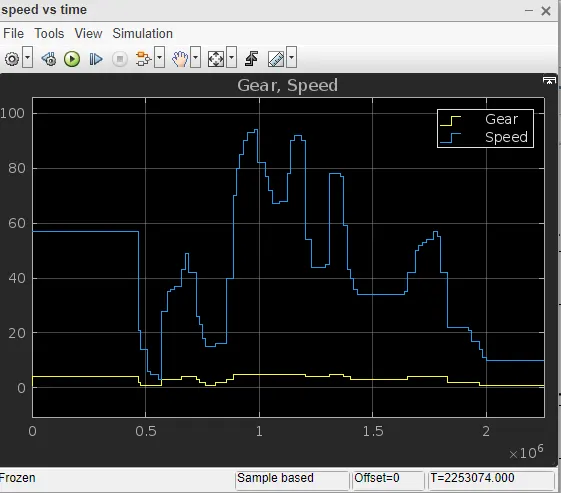
- The scope window shows the variation in gear position due to changes in speed.
- Google Drive Link:https://drive.google.com/file/d/17WaemugwrXTgjs9JCZ2KPNQMxGlPtjbR/view?usp=sharing
Conclusion:
In the above gear shift chart model shown, I have successfully implemented the Simulink model according to the given condition mentioned in the table. I have observed that with the change in speed the corresponding gear changes accordingly which is shown in the scope window. The google drive link is also provided for your reference.